トレードにおいてチャートデータの分析は非常に重要です。今回はチャートデータを画像とみなして予測を行います。
データセットの作成
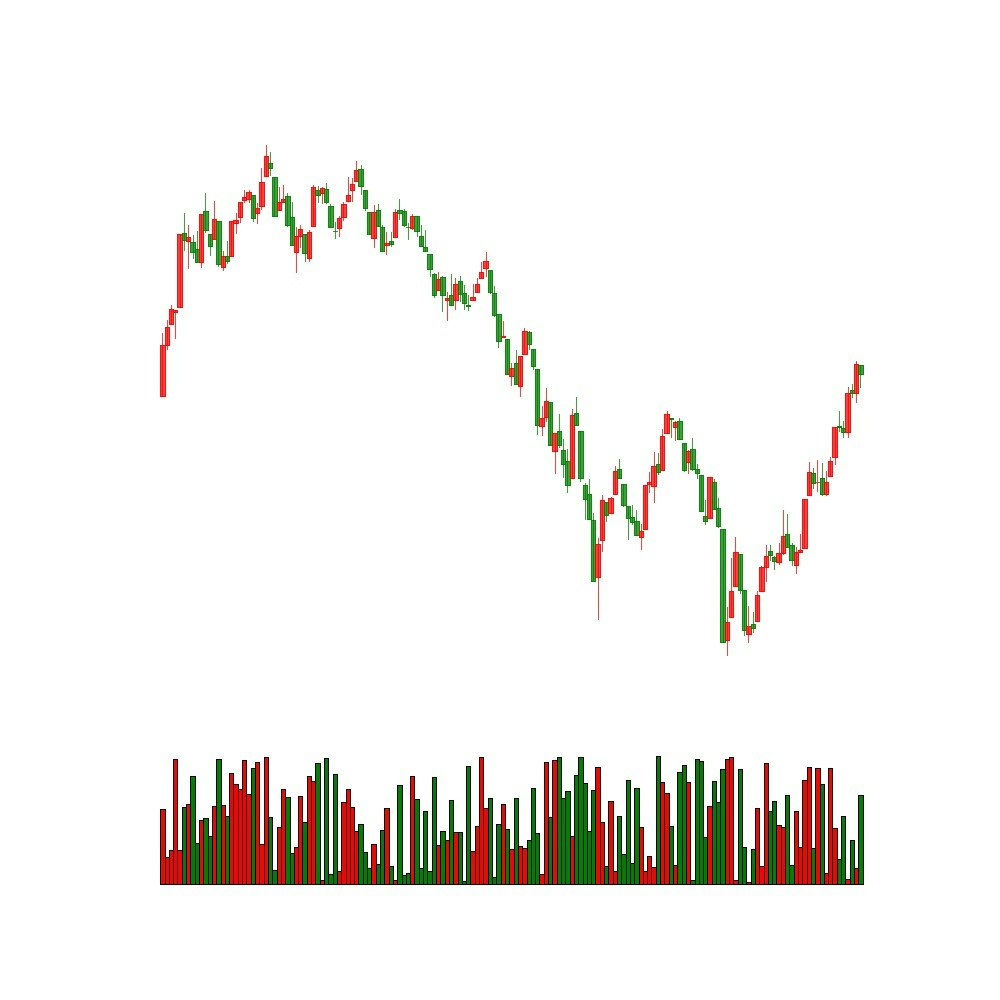
チャート画像の生成にはmatplotlibとmpl_financeを使いました。
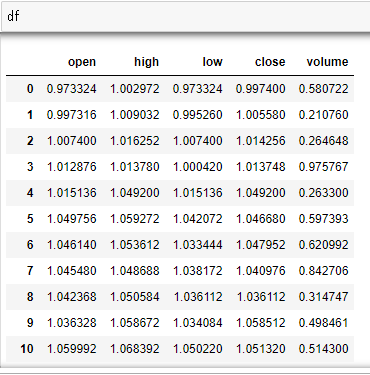
チャートデータは始値、高値、安値、終値の4つの時系列データによって構成されます。今回は出来高も加えています。こんな感じです。

このようなデータなのでXGBoostやRNNのほうが適してるのではないかと思いますが、必ずしもそうとは言えません。アルゴリズムで参戦していない人はこのチャートデータを視覚的に判断します。人間の行動を読むためにも人間が見ているデータ構造に変換することで学習できることもあるかもしれません。
画像生成
    import pandas
    import math
    import numpy
    import matplotlib
    matplotlib.use("Agg")
    import matplotlib.pyplot as plt
    import mpl_finance
    fig, ax = plt.subplots(nrows=2, ncols=1, figsize=(10, 10), sharex=True,
                         gridspec_kw={'height_ratios': [4, 1]})
    mpl_finance.candlestick2_ochl(ax[0], df['open'], df['close'], df['high'], df['low'],
                                  width=1, colorup='r', colordown='g')
    ax[0].grid(False)
    ax[0].set_xticklabels([])
    ax[0].set_yticklabels([])
    ax[0].xaxis.set_visible(False)
    ax[0].yaxis.set_visible(False)
    ax[0].axis('off')
    mpl_finance.volume_overlay(ax[1], df['open'], df['close'], df['volume'],
                            colorup='r', colordown='g', width=1)
    ax[1].grid(False)
    ax[1].set_xticklabels([])
    ax[1].set_yticklabels([])
    ax[1].xaxis.set_visible(False)
    ax[1].yaxis.set_visible(False)
    ax[1].axis('off')
    plt.savefig("tmp.jpg")
    plt.close("all")
ディープラーニング
2値分類のタスクをResNetで画像2471枚学習、589枚で評価します。サンプルなので分類する2値は学習する必要のない項目に設定してあります(75日移動平均と5日移動平均のどちらが値が高いかみたいな感じ)。実際はチャート画像から未来の値が上がるか下がるかを予測するタスクを学習させます。コードとしてはこう↓なりました。メモリに乗りきらないデータセットなのでジェネレータを使っているだけで、処理内容は極めてシンプルです。
from keras.preprocessing.image import ImageDataGenerator
from keras.callbacks import (
    ReduceLROnPlateau,
    EarlyStopping,
    CSVLogger,
    TerminateOnNaN,
    ModelCheckpoint
)
import _parameter as p
import network
import os
import keras.backend as K
import tensorflow as tf

def get_generator(batch_size, dirname):
    data_generator = ImageDataGenerator(
        featurewise_center=False,
        samplewise_center=False,
        featurewise_std_normalization=False,
        samplewise_std_normalization=False,
        zca_whitening=False,
        zca_epsilon=1e-6,
        rotation_range=0,
        width_shift_range=0.,
        height_shift_range=0.,
        brightness_range=None,
        shear_range=0.,
        zoom_range=0.,
        channel_shift_range=0.,
        fill_mode='nearest',
        cval=0.,
        horizontal_flip=False,
        vertical_flip=False,
        rescale=None,
        preprocessing_function=None,
        data_format="channels_last", # channels_first or channels_last=(samples, height, width, channels)
        validation_split=0.0,
        dtype=None)
    generator = data_generator.flow_from_directory(
        dirname, # img/train
        target_size=(p.IMG_ROWS, p.IMG_COLS),
        color_mode='rgb',
        classes=None,
        class_mode='categorical',
        batch_size=batch_size,
        shuffle=True,
        seed=None,
        save_to_dir=None,
        save_prefix='',
        save_format='png',
        follow_links=False,
        subset=None,
        interpolation='nearest'
    )
    return generator


def run(args):
    lr_reducer = ReduceLROnPlateau(factor=0.5, patience=2)
    early_stopper = EarlyStopping(min_delta=0, patience=1)
    csv_logger = CSVLogger("csv/logger.csv", separator=",", append=False)
    nan_terminater = TerminateOnNaN()
    check_pointer = ModelCheckpoint("models/best_model.h5",
                                    monitor="val_acc",
                                    #monitor="mymetric",
                                    mode="max",
                                    save_best_only=True)


    model = network.ResnetBuilder.build_resnet_18((p.CHANNELS, p.IMG_ROWS, p.IMG_COLS), p.CLASSES)
    loss = 'categorical_crossentropy'
    model.compile(loss=loss,
                  optimizer='sgd',
                  metrics=['accuracy']
                  #metrics=[mymetric]
                  )


    train_generator = get_generator(batch_size=32, dirname="img/train")
    test_generator = get_generator(batch_size=32, dirname="img/test")
    model.fit_generator(
        train_generator,
        steps_per_epoch=len(train_generator),
        epochs=args.epochs,
        verbose=1,
        callbacks=[lr_reducer, early_stopper, csv_logger, nan_terminater, check_pointer],
        validation_data=test_generator,
        validation_steps=len(test_generator),
        class_weight=None,
        max_queue_size=10,
        workers=args.workers,
        use_multiprocessing=False,
        shuffle=True,
        initial_epoch=0
        )
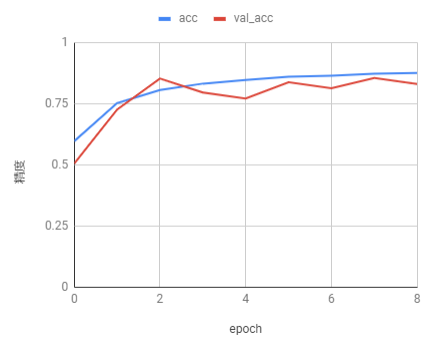
学習するとこんな感じで学習できました。当然のことですが実際に未来予測をしようとすると精度を上げるのは非常に難しいです。

今回作ったソースコードはここにあります。
https://github.com/shiibashi/qiita/tree/master/8
関連論文紹介
DEEP STOCK REPRESENTATION LEARNING: FROM CANDLESTICK CHARTS TO INVESTMENT DECISIONS
チャート画像を特徴ベクトルに変換して、クラスタリング、そのクラスタをもとにポートフォリオを組む研究です。ベクトル化ではVGGネットワークを使っています。
Stock Chart Pattern recognition with Deep Learning
チャート画像から特定の形状をディープラーニングで判別する研究です。データセット作るのが大変だけど、確実に学習は成功すると思います。
Using Deep Learning Neural Networks and Candlestick Chart Representation to Predict Stock Market
https://arxiv.org/pdf/1903.12258.pdf
チャート画像から未来の株価の上下を予測する研究です。この論文を読んで自分が扱っているデータに対応するように開発したものが今回作ったプログラムです。
最後に
今後の研究トレンドの予想としては、画像のディープラーニングはまだ研究例が少なく、今後も期待したい領域です。あとは自然言語処理技術を絡めた研究がここ最近では重要になっており、身につけなければいけない技術だと思います。
