(2019.09.18更新)
@timtoronto634 さんのおかげで、DetectronとVideopose3Dのビルドが成功。感謝感謝。
この元記事を必ず参照のこと
https://qiita.com/timtoronto634/items/ee018ac89e6b9f779194
ここで記されている、condaで作る環境、どのパッケージのどのバージョンを入れるかがキモ。@timtoronto634さんもそこをかなりご苦労された模様。
僕の場合は、上のやり方で環境を整え、それより前に成功していたVideopose3D公式のビルドから必要そうなものを都度もってきてみた。
Pythonだから、エラーが出るたびにそれをすれば進んでいくんだが、Cythonで作ったオブジェクトをもってくるところで詰まった。Cythonだもんね。Pythonのコードではない。
なので、公式の方法でもう一度makeし(cythonの部分がそれで作られる)、そのフォルダー群を、tobiasczさんのコードでビルドできたフォルダーであるVideoPose3Dフォルダー以下にコピーした。
detectrpm_tools/detectronフォルダーがtobiasczさんの実装での本体なので、ここに多くをコピーすることになるが、公式のを一度ビルドすれば、どこに置くべきかすぐわかる。
なので,一回は,公式の方法でビルドしてみるのを強くオススメ
ここで一つ、ご注意。
上記のやり方で順にやってきた直後だと問題ないのだが、後日また処理をしようとすると、caffe2まわりでエラーが出ることが多い。
その場合、@timtoronto634さん作成のcondaの環境になっているかどうか、再確認必要。さまざまなライブラリーの様々なバージョンを使うことになるので、それがふとバージョン違いがおきていることがある。以下で確認、バージョン違いだったら
conda list
conda install あるいは uninstall [package名]
後日動かすと、なぜかエラーというのはcaffe2まわりではおおいらしく、先ほど動かすと、
ImportError: No module named past.builtins
というのが出た。これは以下で簡単に解決
$ pip install future
https://github.com/facebookarchive/caffe2/issues/712
から。なぜこれで解決するのか、ここの書き込みの最後の人も僕も??なのだが、まあ古いcaffe2なので気にしないようにしよう。
Detectronで、自分のビデオを処理することになるが、ここで
AttributeError: 'NoneType' object has no attribute 'astype'
に悩まされた。
https://github.com/alexgkendall/SegNet-Tutorial/issues/87
と、ここにあるリンク先を見ると、OpenCVではよくあるそうで、入力するイメージやビデオのファイルのあるフォルダーへのパスの記述が融通きかない
僕のケースでは、~/VideoPose3D/detectron_tools の下に skateframesというフォルダ(ムービーから書きだしたpngがある)と、demo/outputフォルダーがある。~/VideoPose3D/detectron_toolsにおいて、上のコマンドでdetectronを起動した場合、普通ならこれらのフォルダ指定に"./"が不要のはずが必要だった。
python infer_simple.py --cfg e2e_keypoint_rcnn_R-101-FPN_s1x.yaml --output-dir ./demo/output --image-ext png --wts model_final.pkl ./skateframes
うまく行くと、demo/outputのなかに、スケルトンがオーバーレイされたpdfファイル(フレームの数だけある)と、data_2d_detections.npzファイルが生成される
3D推定部分(Videopose3D本体)
~/VideoPose3D/ で
out_cutted.mp4は、detectronの入力用とした(ffmpegでバラすまえの)動画ファイル名、output_video.mp4は、その動画の横に、推定したスケルトンの動画をおいた出力動画ファイル名
python run_wild.py -k detections -arc 3,3,3,3,3 -c checkpoint --evaluate d-pt-243.bin --render --viz-subject S1 --viz-action Directions --viz-video out_cutted.mp4 --viz-camera 0 --viz-output output_video.mp4 --viz-size 5 --viz-downsample 1 --viz-skip 0
なお、僕の場合、detectronのpython2.7 conda環境と、videopose3Dのpython3.6 conda環境を何度も行ったり来たりしていると、caffe2が謎エラーを出すようになるので、ここはちょっと注意。rebootで治るけど.
行ったり来たりよりは,ターミナル2つ開いて,condaもdetectronとvideopose3Dのconda環境がどちらも走っている状態でやったほうが,僕の場合は安定しています
推定された座標データの出力
https://github.com/facebookresearch/VideoPose3D/issues/40
3次元np.arrayに格納されているで、binaryでないと出せない flatten()してテキストファイルに出す方法もあるが,構造を壊さず尊重する方針にしました.バイナリーだと,えぇ〜と
おもってしまうのですが,
np.arrayのバイナリーでの読み書きの解説はこちらです。簡単です
https://note.nkmk.me/python-numpy-load-save-savez-npy-npz/
本体であるrun_wild.pyの304行目に、以下の行をいれただけです
    # save predicted marker positions (np.array) to np binary file
    np.save('predictions',prediction)
(内輪連絡〜 ゼミの諸君は、うえのパッチをあてたmyrun_wild.pyをつかってね)
推定されたスケルトンのビューワー
Jupyter notebookで動くように分割して書いてしまいましたが,
ひとまとめにしても動くとおもいます.
自分が作ったデータ形式ではないので.確認しながら動かすのが吉..
    import numpy as np
    import pandas as pd
    import matplotlib
    matplotlib.use('TkAgg') # Need to use in order to run on mac",
    from matplotlib import pyplot as plt
    from mpl_toolkits.mplot3d import Axes3D
    from matplotlib.colors import cnames
    from matplotlib import animation
    %matplotlib notebook

    arrayMarker3Dcoordinates = np.load('../data/predictions.npy')
一旦,2次元にする.列が,marker1x, marker1y, marker1z, marker2x, marker2y.....の形. マーカーは17種類
マーカーデータの並びは,なかなかにカオスで,どうしてこういう並びにしてるんだ??
僕の場合は,描画しながら特定していきました.間違いがあったらぜひ教えて
なお,3次元テンソルのデータを,一度,2Dの表の形式にしてしまうのは,プログラム的には無駄ですが,他の伝統的なバイオメカニクスのデータ分析と互換性をもたせるためと,xz,yz,xyの平面ごとの射影でみる,細かい分析のためにやっています
arrayMarker3Dcoordinates.shape
df = pd.DataFrame(arrayMarker3Dcoordinates.reshape(584,17*3),
                  columns=['pelvisX','pelvisY','pelvisZ', 'R-troX','R-troY','R-troZ', 'R-kneeX','R-kneeY','R-kneeZ', 'R-ankleX','R-ankleY','R-ankleZ',  'L-troX','L-troY','L-troZ', 'L-kneeX','L-kneeY','L-kneeZ','L-ankleX','L-ankleY','L-ankleZ','centerX', 'centerY','centerZ', 'neckX','neckY','neckZ','noseX','noseY','noseZ', 'headX','headY','headZ',  'L-shoX','L-shoY','L-shoZ', 'L-elbX','L-elbY','L-elbZ', 'L-wristX','L-wristY','L-wristZ','R-shoX','R-shoY','R-shoZ','R-elbX','R-elbY','R-elbZ', 'R-wristX', 'R-wristY','R-wristZ'])
3Dアニメーションを書くためのnumpy array x_tは,[マーカー数[フレーム数[x,y,z] ] ]の3次元テンソルになっているので,これに座標データを入れ直しています.
Stickpicture animationは
https://stackoverflow.com/questions/21367541/3d-animation-with-matplotlib-connect-points-to-create-moving-stick-figure を下敷きにして実装しました
 import numpy as np
    import pandas as pd
    import matplotlib
    #matplotlib.use('TkAgg') # Need to use in order to run on mac
    from matplotlib import pyplot as plt
    from mpl_toolkits.mplot3d import Axes3D
    from matplotlib.colors import cnames
    from matplotlib import animation
    %matplotlib notebook

    t_start = 0 # start frame
    t_end = df.shape[0]

    N_tag = df.shape[1]# nr of tags used (all)
    #print(N_tag)
    N_trajectories = N_tag

    t = np.linspace(0,t_end/30,df.shape[0]) # pseudo time-vector for first walking activity
    x_t = np.zeros(shape=(int(N_tag),df.shape[0],3)) # empty animation array (3D)

    for tag in range(17):
        # store data in numpy 3D array: (tag,time-stamp,xyz-coordinates)
        x_t[tag,:,:] = df.iloc[:,tag*3 :tag*3+3]

    #===STICK-LINES========================================================================================
    #xx = [x_t[1,:,0],x_t[2,:,0]]
    #yy = [x_t[1,:,1],x_t[2,:,1]]
    #zz = [x_t[1,:,2],x_t[2,:,2]]
    #======================================================================================================


    # Set up figure & 3D axis for animation
    fig = plt.figure()
    ax = fig.add_axes([0, 0, 1, 1], projection='3d')
    ax.axis('on')

    # choose a different color for each trajectory
    colors = plt.cm.jet(np.linspace(0, 1, int(N_trajectories)))
    #colors
    # set up trajectory lines
    lines = sum([ax.plot([], [], [], '-', c=c) for c in colors], [])
    # set up points
    pts = sum([ax.plot([], [], [], 'o', c=c) for c in colors], [])
    # set up lines which create the stick figures

    stick_defines = [
        (0,1),
        (0,4),
        (4,5),
        (5,6),
        (0,7),
        (1,2),
        (2,3),
        (7,8),
        (8,9),
        (9,10),
        (8,14),
        (8,11),
        (11,12),
        (12,13),
        (14,15),
        (15,16)
    ]

    stick_lines = [ax.plot([], [], [], 'k-')[0] for _ in stick_defines] #上で定義されたstick_definesにある点の間に線をひく

    # Automatically set axes limits
    # prepare the axes limits
    #ax.set_xlim(df_minmax.loc['x'].values)
    #ax.set_ylim(df_minmax.loc['y'].values)
    #ax.set_zlim(df_minmax.loc['z'].values)

    # Setting the axes properties
    # https://matplotlib.org/2.1.2/gallery/animation/simple_3danim.html
    mid_x =0
    x_range = 1
    ax.set_xlim3d(mid_x - x_range, mid_x + x_range)
    ax.set_xlabel('X')

    mid_y =0
    y_range = 1
    ax.set_ylim3d(mid_y - x_range, mid_y + x_range)
    ax.set_ylabel('Y')

    mid_z = 0.5
    z_range = 1
    ax.set_zlim3d(mid_z - z_range, 1.5)
    ax.set_zlabel('Z')

    ax.set_title('markers in 3D')

    # set point-of-view: specified by (altitude degrees, azimuth degrees)
    ax.view_init(20,45)

    # initialization function: plot the background of each frame
    def init():
        for line, pt in zip(lines, pts): # lines, ptsのリストから,同時にi番目のデータを取得する.linesからline, pts からpt
            # trajectory lines
            line.set_data([], [])
            line.set_3d_properties([])
            # points
            pt.set_data([], [])
            pt.set_3d_properties([])
        return lines + pts + stick_lines

    # animation function.  This will be called sequentially with the frame number
    def animate(i):
        # 1 * i means show every frame, 2*i means one frame show one frame no-show
        i = (1 * i) % x_t.shape[1]

        for line, pt, xi in zip(lines, pts, x_t):
            x, y, z = xi[:i].T # note ordering of points to line up with true exogenous registration (x,z,y)
            print(x)
            pt.set_data(x[-1:], y[-1:])
            pt.set_3d_properties(z[-1:])

        for stick_line, (sp, ep) in zip(stick_lines, stick_defines):
            stick_line._verts3d = x_t[[sp,ep], i, :].T.tolist()

        #ax.view_init(30, 0.3 * i)
        ax.view_init(20,60+i*2)
        fig.canvas.draw()
        return lines + pts + stick_lines

    # instantiate the animator.
    anim = animation.FuncAnimation(fig, animate, init_func=init, frames=t_end, interval=1, repeat = False, blit=True)

    # GIF animationで保存の場合.画面描画と両立する.
    #anim.save('3Dplotanimation.gif', writer='pillow', fps=10)

    plt.show()
自分メモなので,足りないところたくさんあると思います.
ご質問ください.
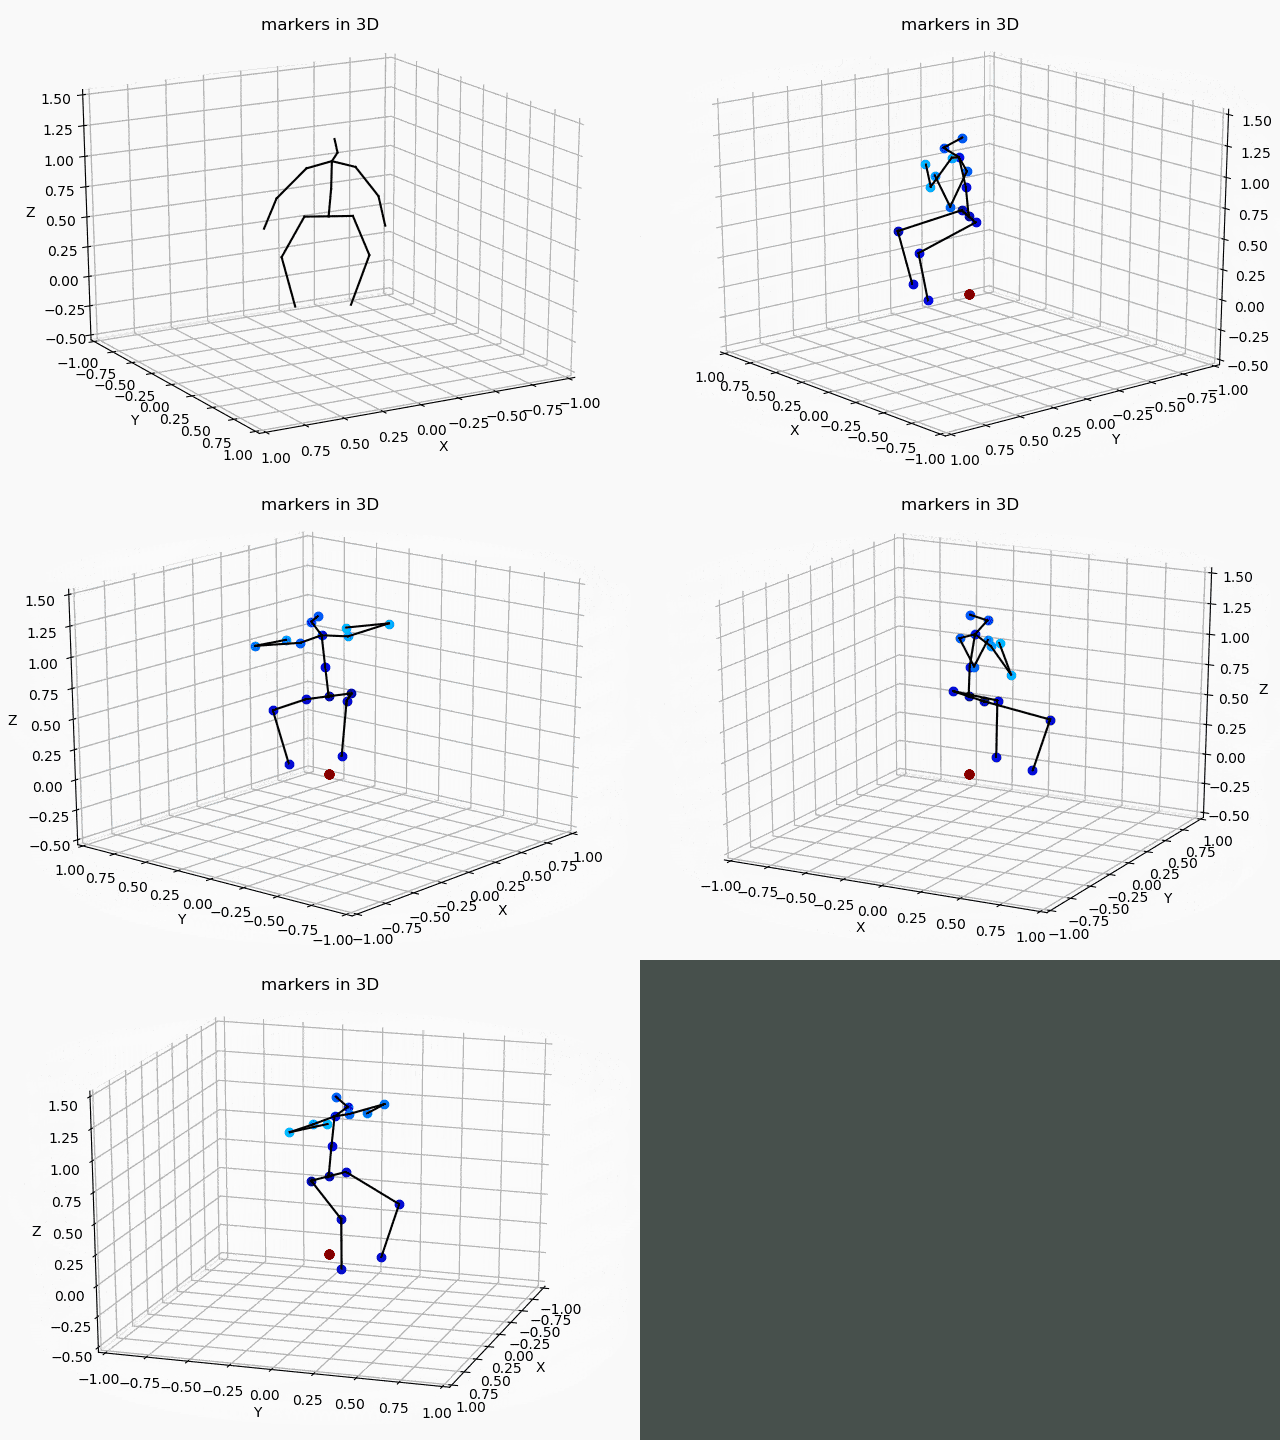
下のGIFアニメが自動で出なかったら,白いところをクリックして別ウインドウで見てください↓
