はじめに
import pandas as pd
pd.options.plotting.backend = "plotly"
とするだけで
# データ読み込み
df = pd.read_csv("file_path")

df.plot.hist(...) # ヒストグラム
# df.plot.bar(...)
# df.plot.scatter(...)
# df.plot.line(...)
など様々なグラフが綺麗にサクッと書ける! というお話です。
Pandas Plotting Backend in Python
各種グラフの書き方の紹介になるため、
分析として無意味なグラフがあることもご容赦くださいませ。
使用ライブラリ
google colabの環境を想定しております。
!pip install -U plotly pandas => ランタイム再起動が必須です
import numpy as np
import pandas as pd
pd.options.display.max_rows = 100
pd.options.display.max_colwidth = 100
pd.options.display.max_columns = 50
pd.options.display.unicode.east_asian_width = True
pd.options.display.float_format = "{:.2f}".format # 小数点第2位まで
pd.options.plotting.backend = "plotly"

# 対応してないチャートの際に使います
# import plotly.express as px
# import plotly.figure_factory as ff
使用データセット
UCI Bike Sharing Dataset Data Set
バイクシェアリングサービスの日次集計データ
# サイトからデータセットダウンロード
!wget http://archive.ics.uci.edu/ml/machine-learning-databases/00275/Bike-Sharing-Dataset.zip
!unzip Bike-Sharing-Dataset.zip
df = pd.read_csv("./day.csv", parse_dates=["dteday"])
df.drop(columns=["yr", "month"], inplace=True)
df["season"] = df.season.map({1: "冬", 2: "春", 3: "夏", 4: "秋"})
df["holiday"] = df.holiday.map({0: "平日", 1: "休日"})
df["weekday"] = df.weekday.map({0: "月曜日", 1: "火曜日", 2: "水曜日", 3: "木曜日", 4: "金曜日", 5: "土曜日", 6: "日曜日"})
df["weathersit"] = df.weathersit.map({1: "晴れ", 2: "曇り", 3: "小雨", 4: "大雨"})
df.head()
私も自転車シェアリング使ったことありますが結構便利なんですよね。
100円~200円で2駅先ぐらいまで行けちゃいます!
各種チャート
plotly Tutorial 各チャートのサンプルコードなど載ってます
plotly Documentation 各チャートの引数などが載ってます
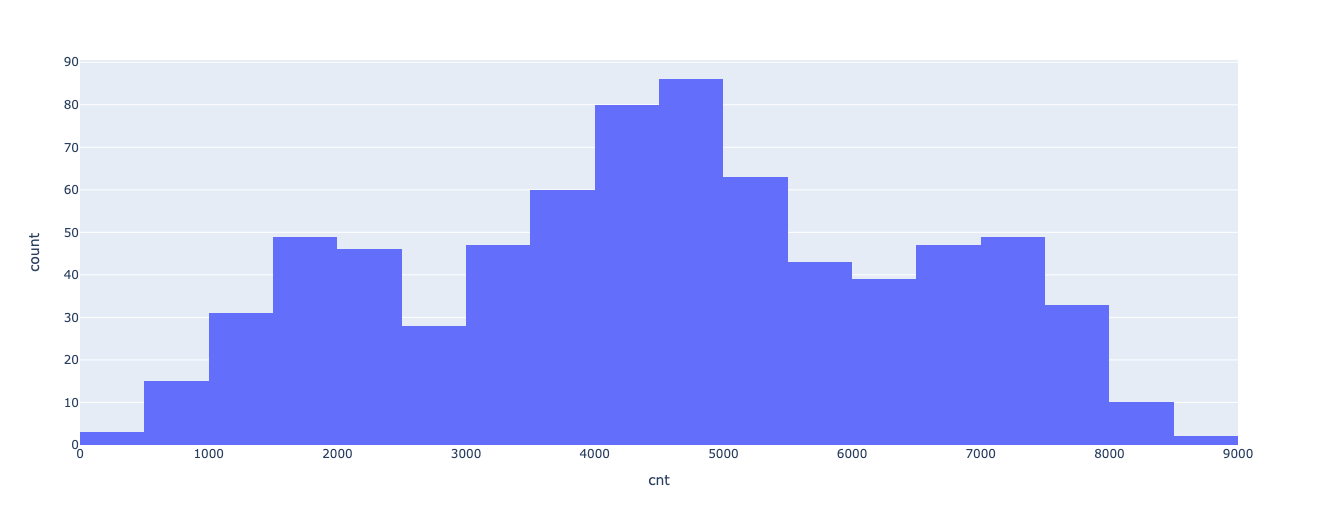
ヒストグラム
df.plot.hist(x="cnt")
# df.cnt.plot.hist() も同じ
# df.plot(x="cnt", kind="hist") も同じ
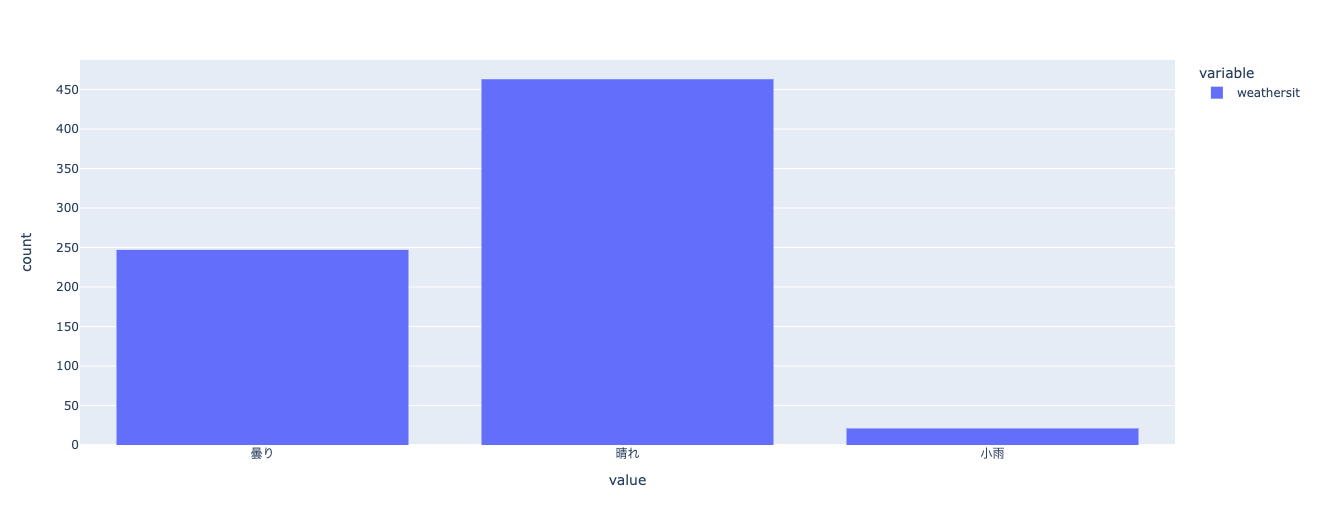
カテゴリでも可能です
df.weathersit.plot.hist()
# df.weathersit.value_counts().plot.bar() 同じ
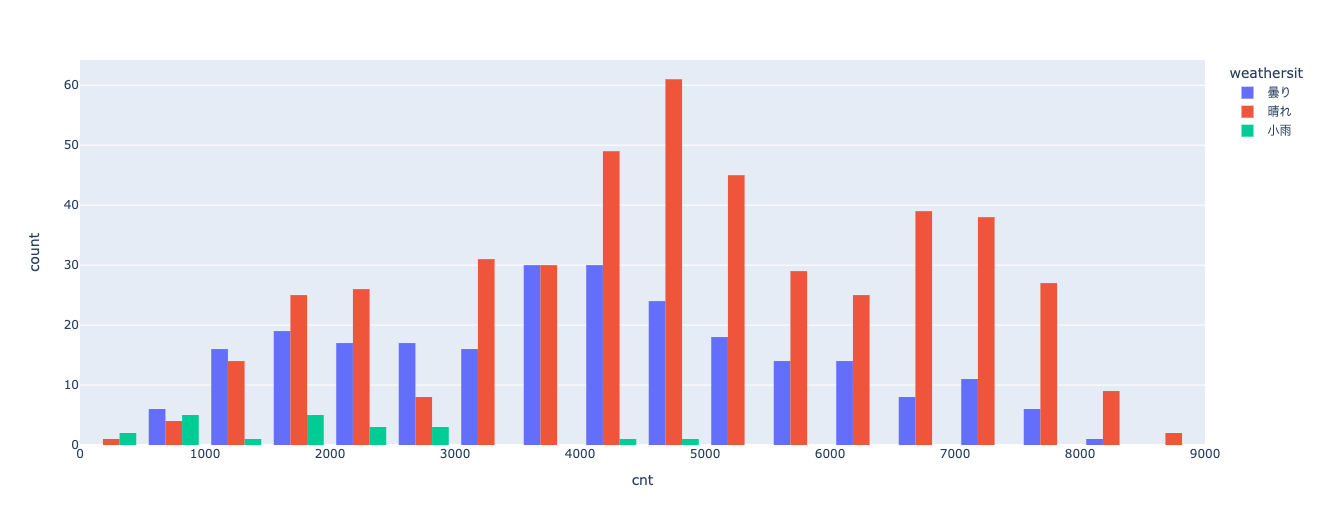
カテゴリごとに色分けできます
# barmodeにはstack, overlayなども指定可能
df.plot.hist(x="cnt", color="weathersit", barmode="group")
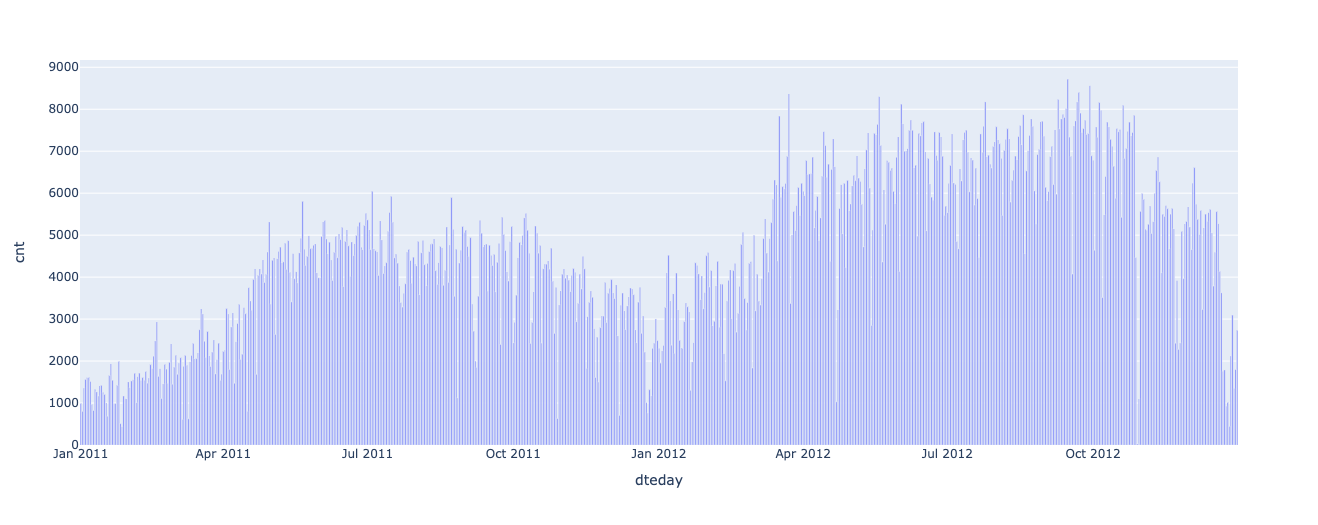
棒グラフ
df.plot.bar(x="dteday", y="cnt")
# ↓でも同じ。indexは自動的にx軸へ
# df.set_index("dteday").plot.bar(y="cnt")
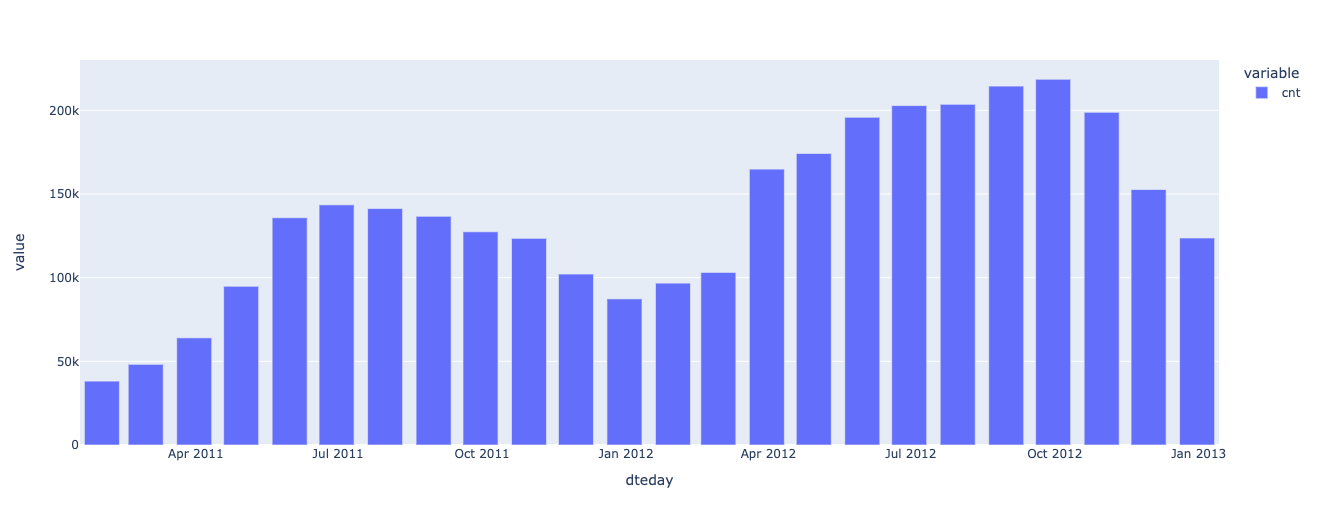
集計した後にそのまま可視化できます
df.set_index("dteday").resample("M").cnt.sum().plot.bar()
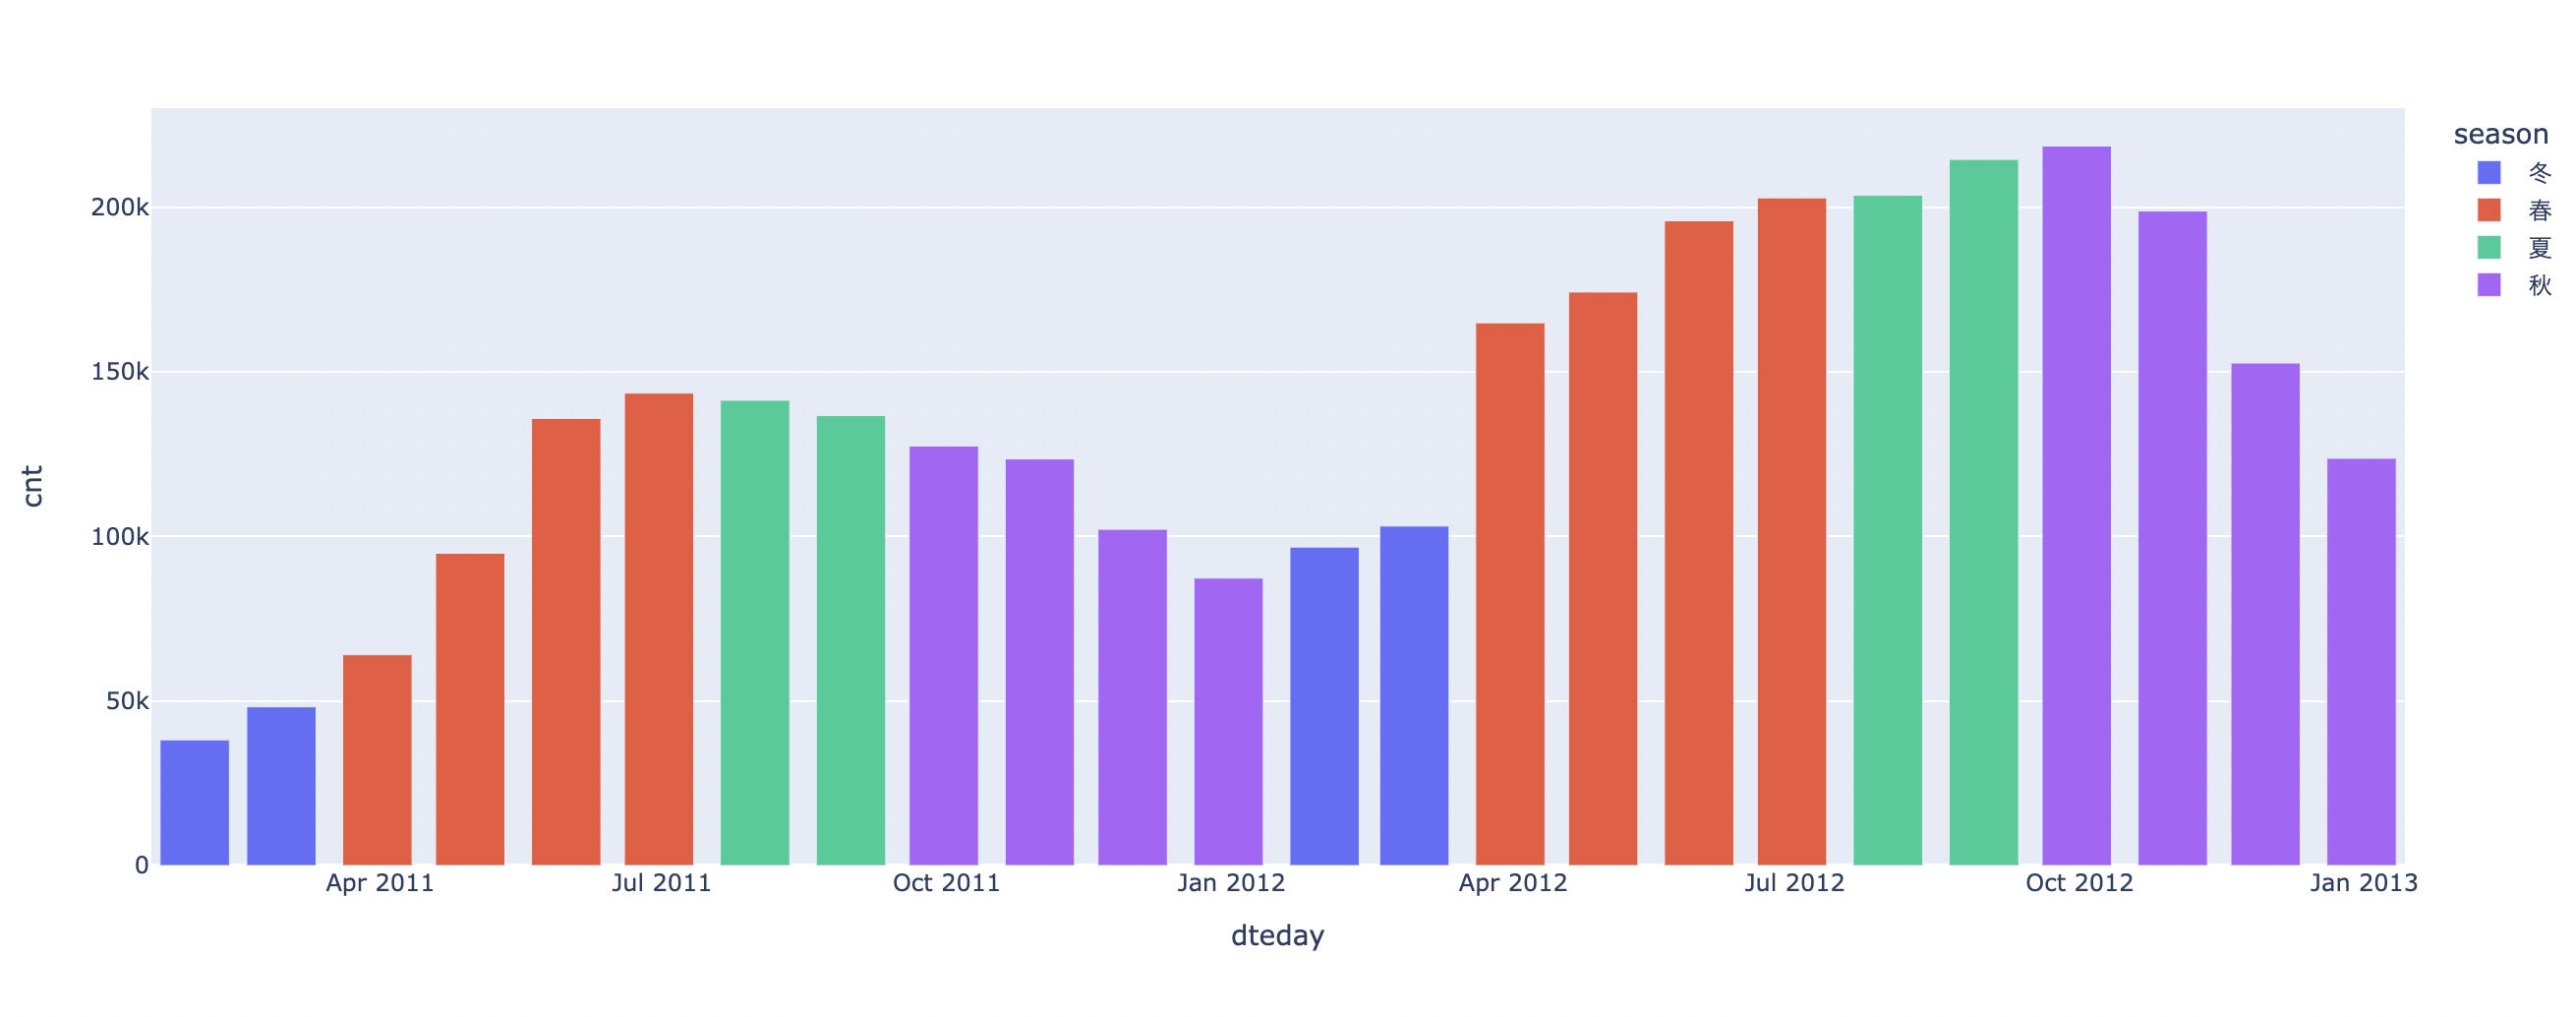
集計した後に色分けできます(季節で色付けする意味はないですが)
df.set_index("dteday").resample("M").agg({"cnt": "sum", "season": "max"})\
.plot.bar(y="cnt", color="season")
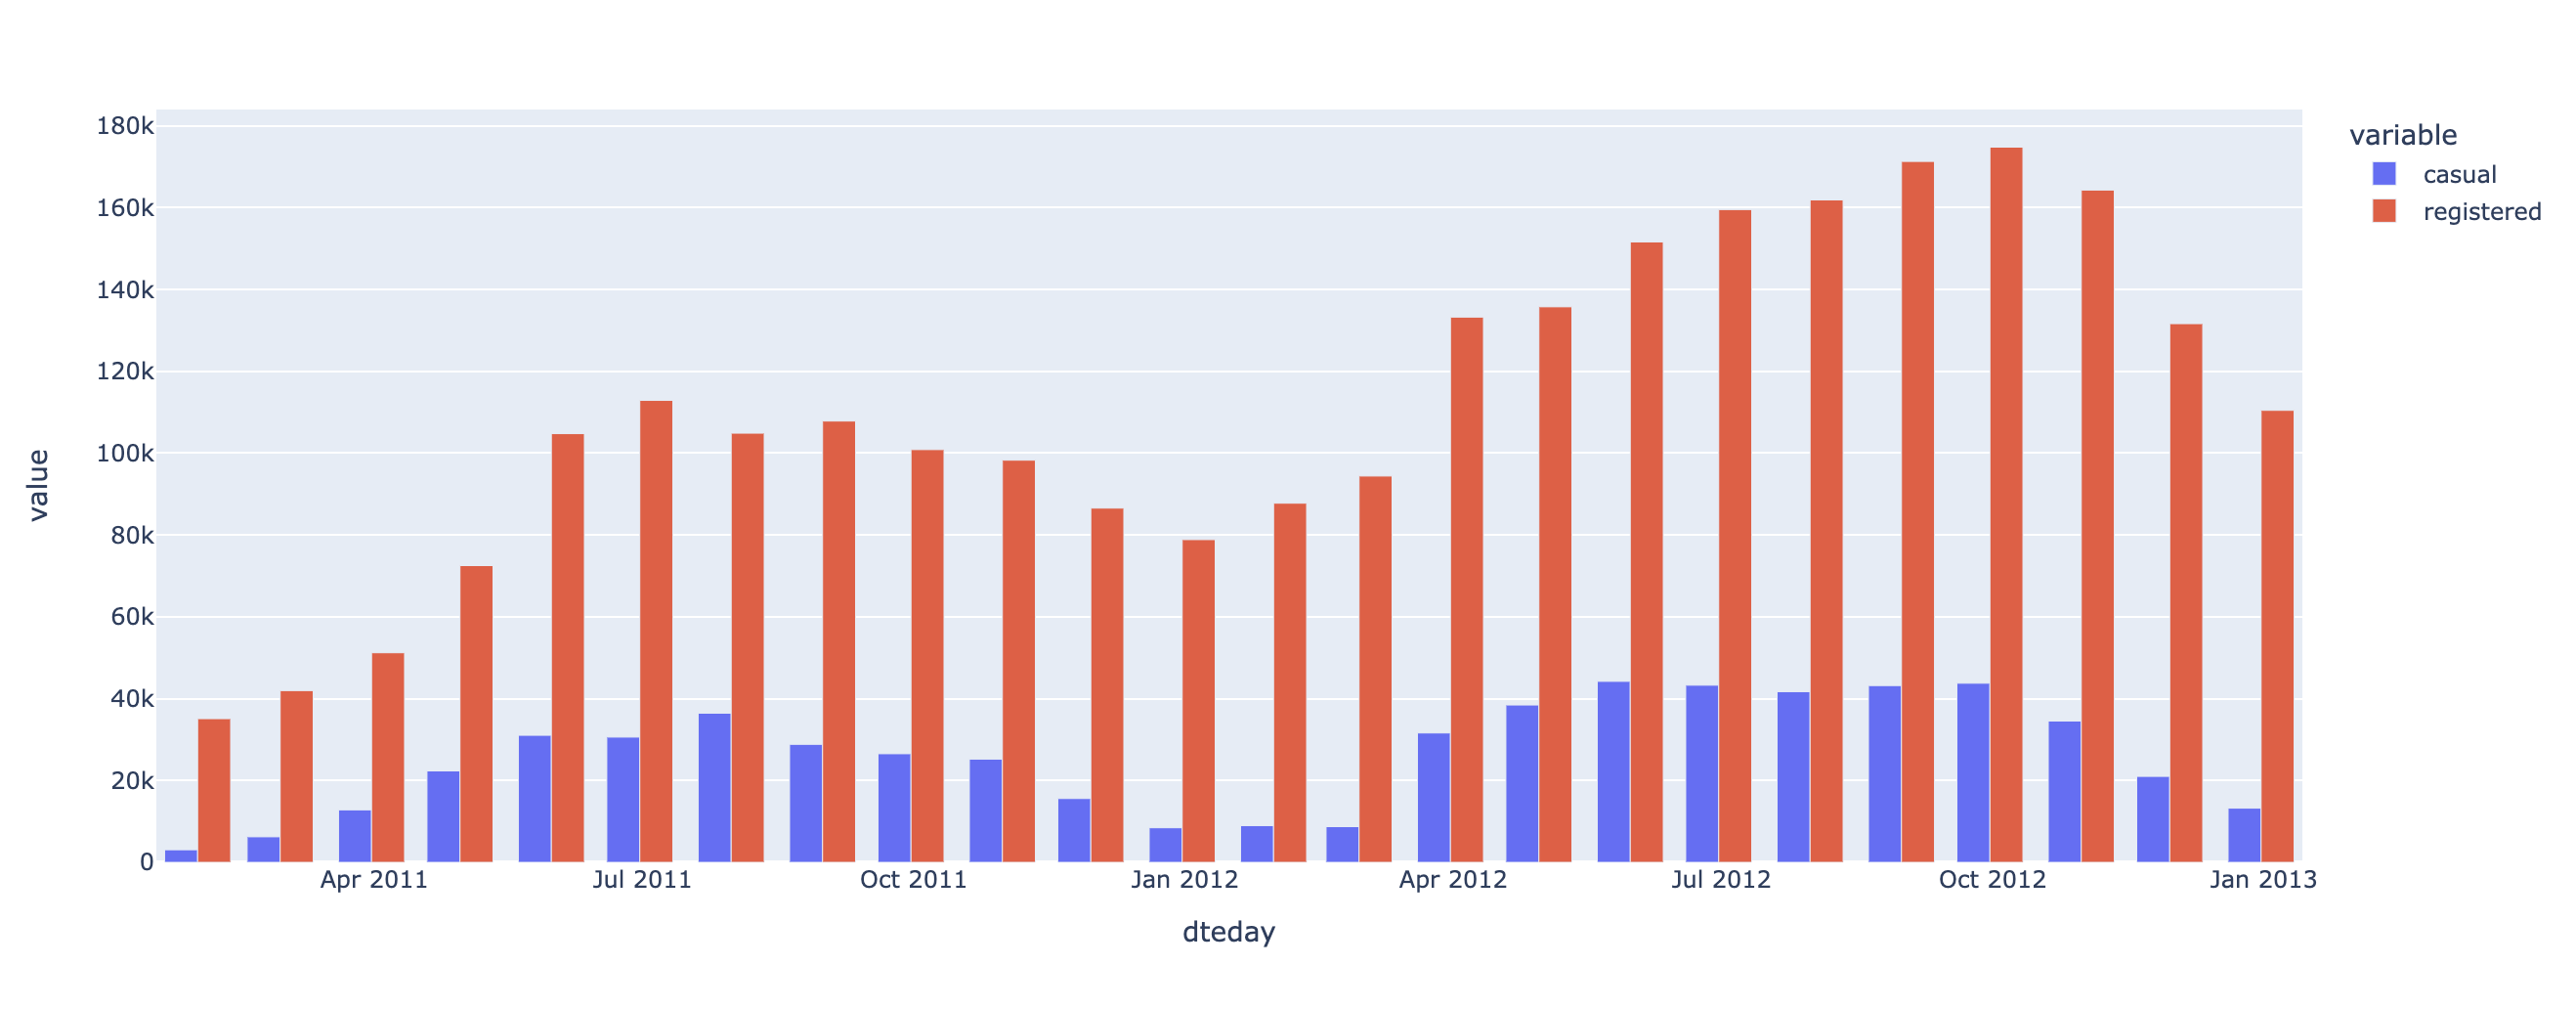
横持ちだと楽です
# 新規ユーザー, 既存ユーザーごと
df.set_index("dteday").resample("M")[["casual", "registered"]].sum()\
.plot.bar(barmode="group") # y=["casual", "registered"]は無くてもOK!
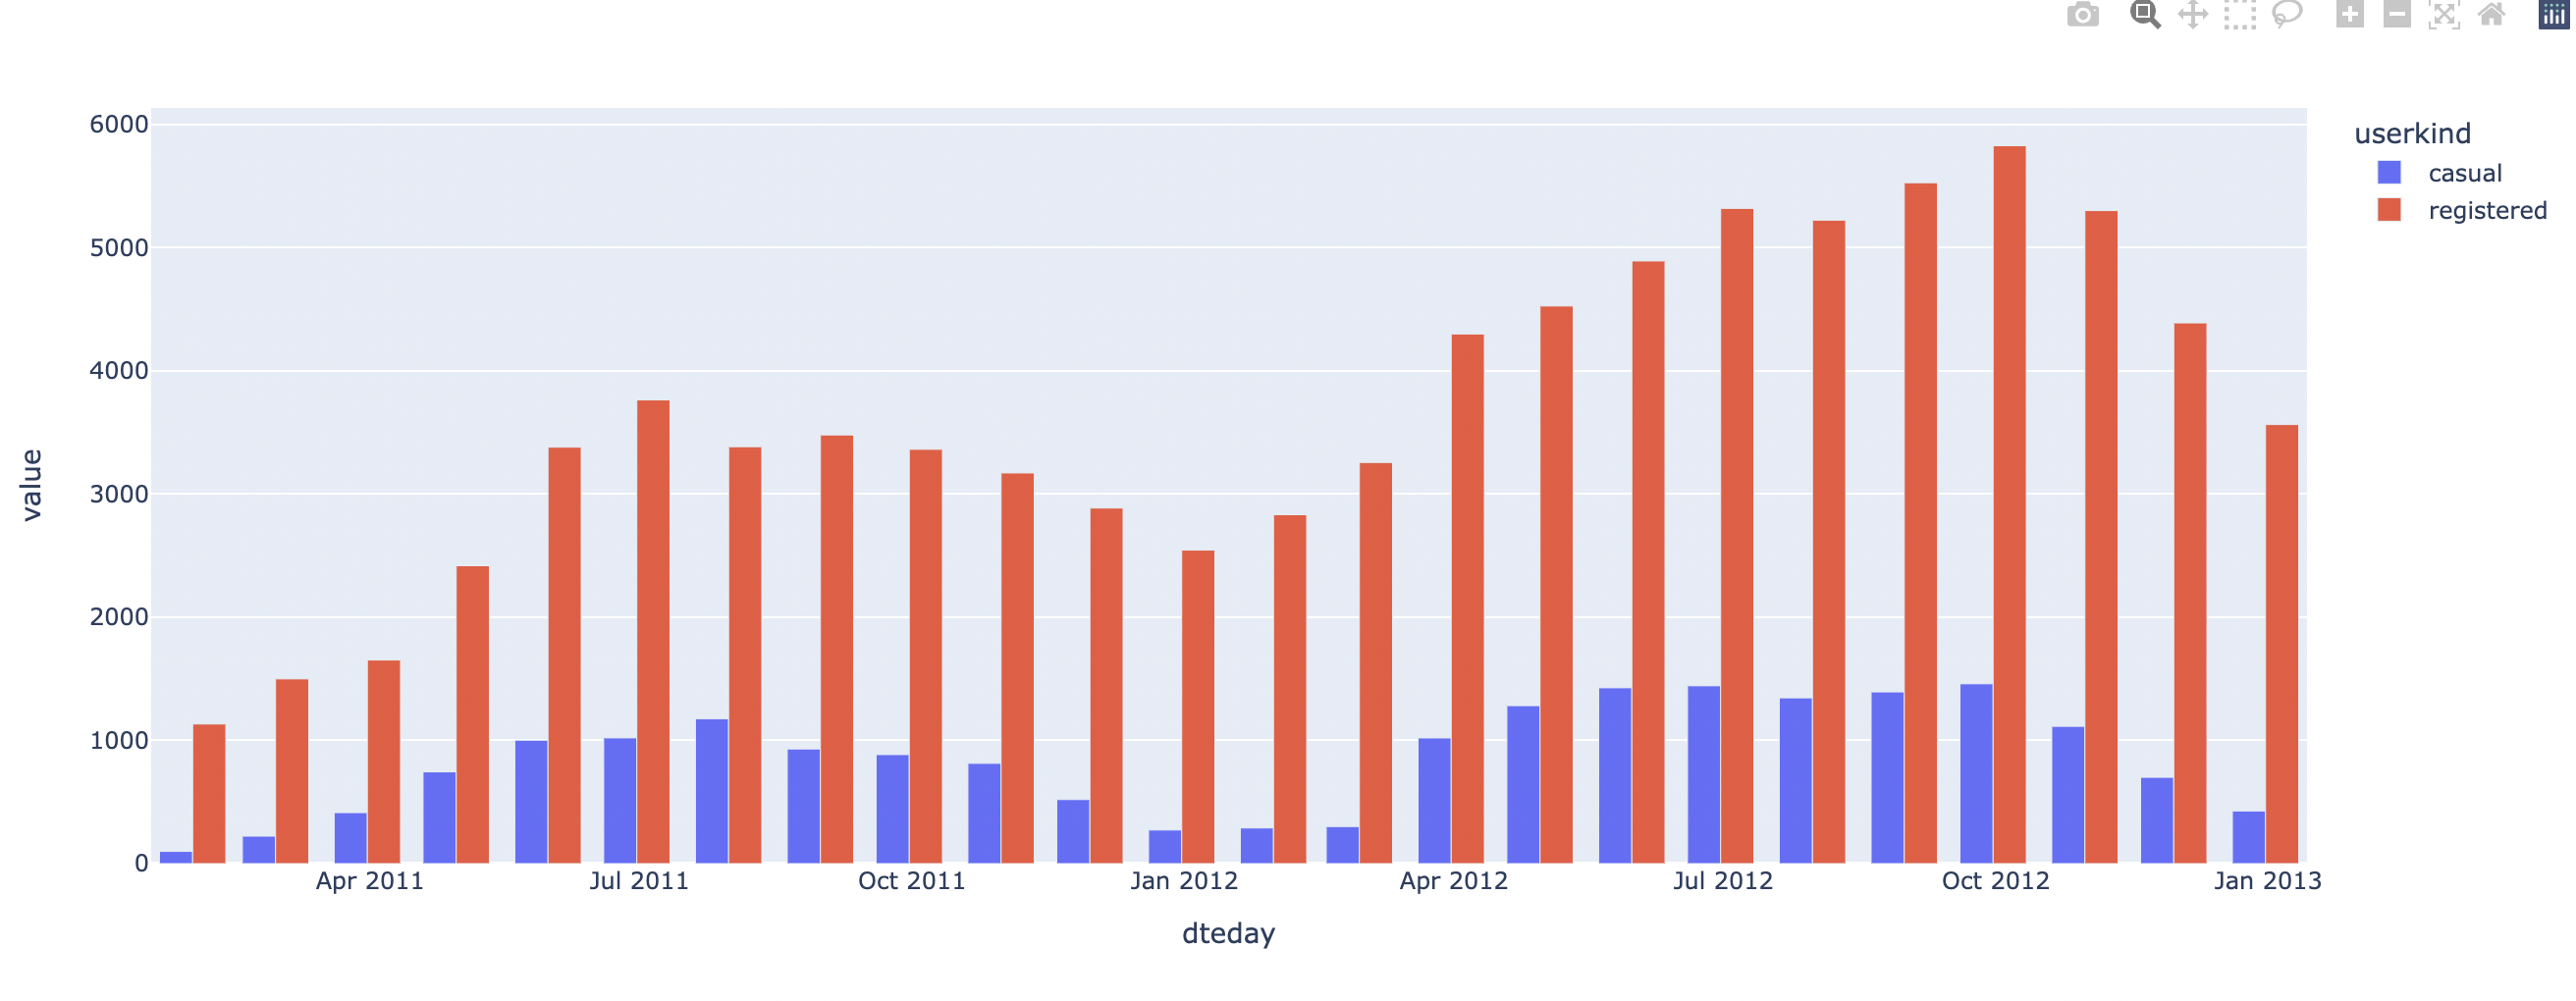
縦持ちの場合少し面倒です
df_tate = df.melt(
    id_vars=['instant','dteday', 'season', 'holiday', 'weekday',
                'workingday', 'weathersit', 'temp', 'atemp', 'hum', 'windspeed'],
    value_vars=["casual", "registered"],
    var_name="userkind",
    value_name="count").sort_values(by=["dteday", "userkind"])

df_tate.head()
# 他に良い方法ありそうです。
df_tate.groupby("userkind").apply(lambda g: g.set_index("dteday").resample("M").agg({"count": "mean"})) \
.reset_index("userkind").plot.bar(color="userkind", barmode="group")
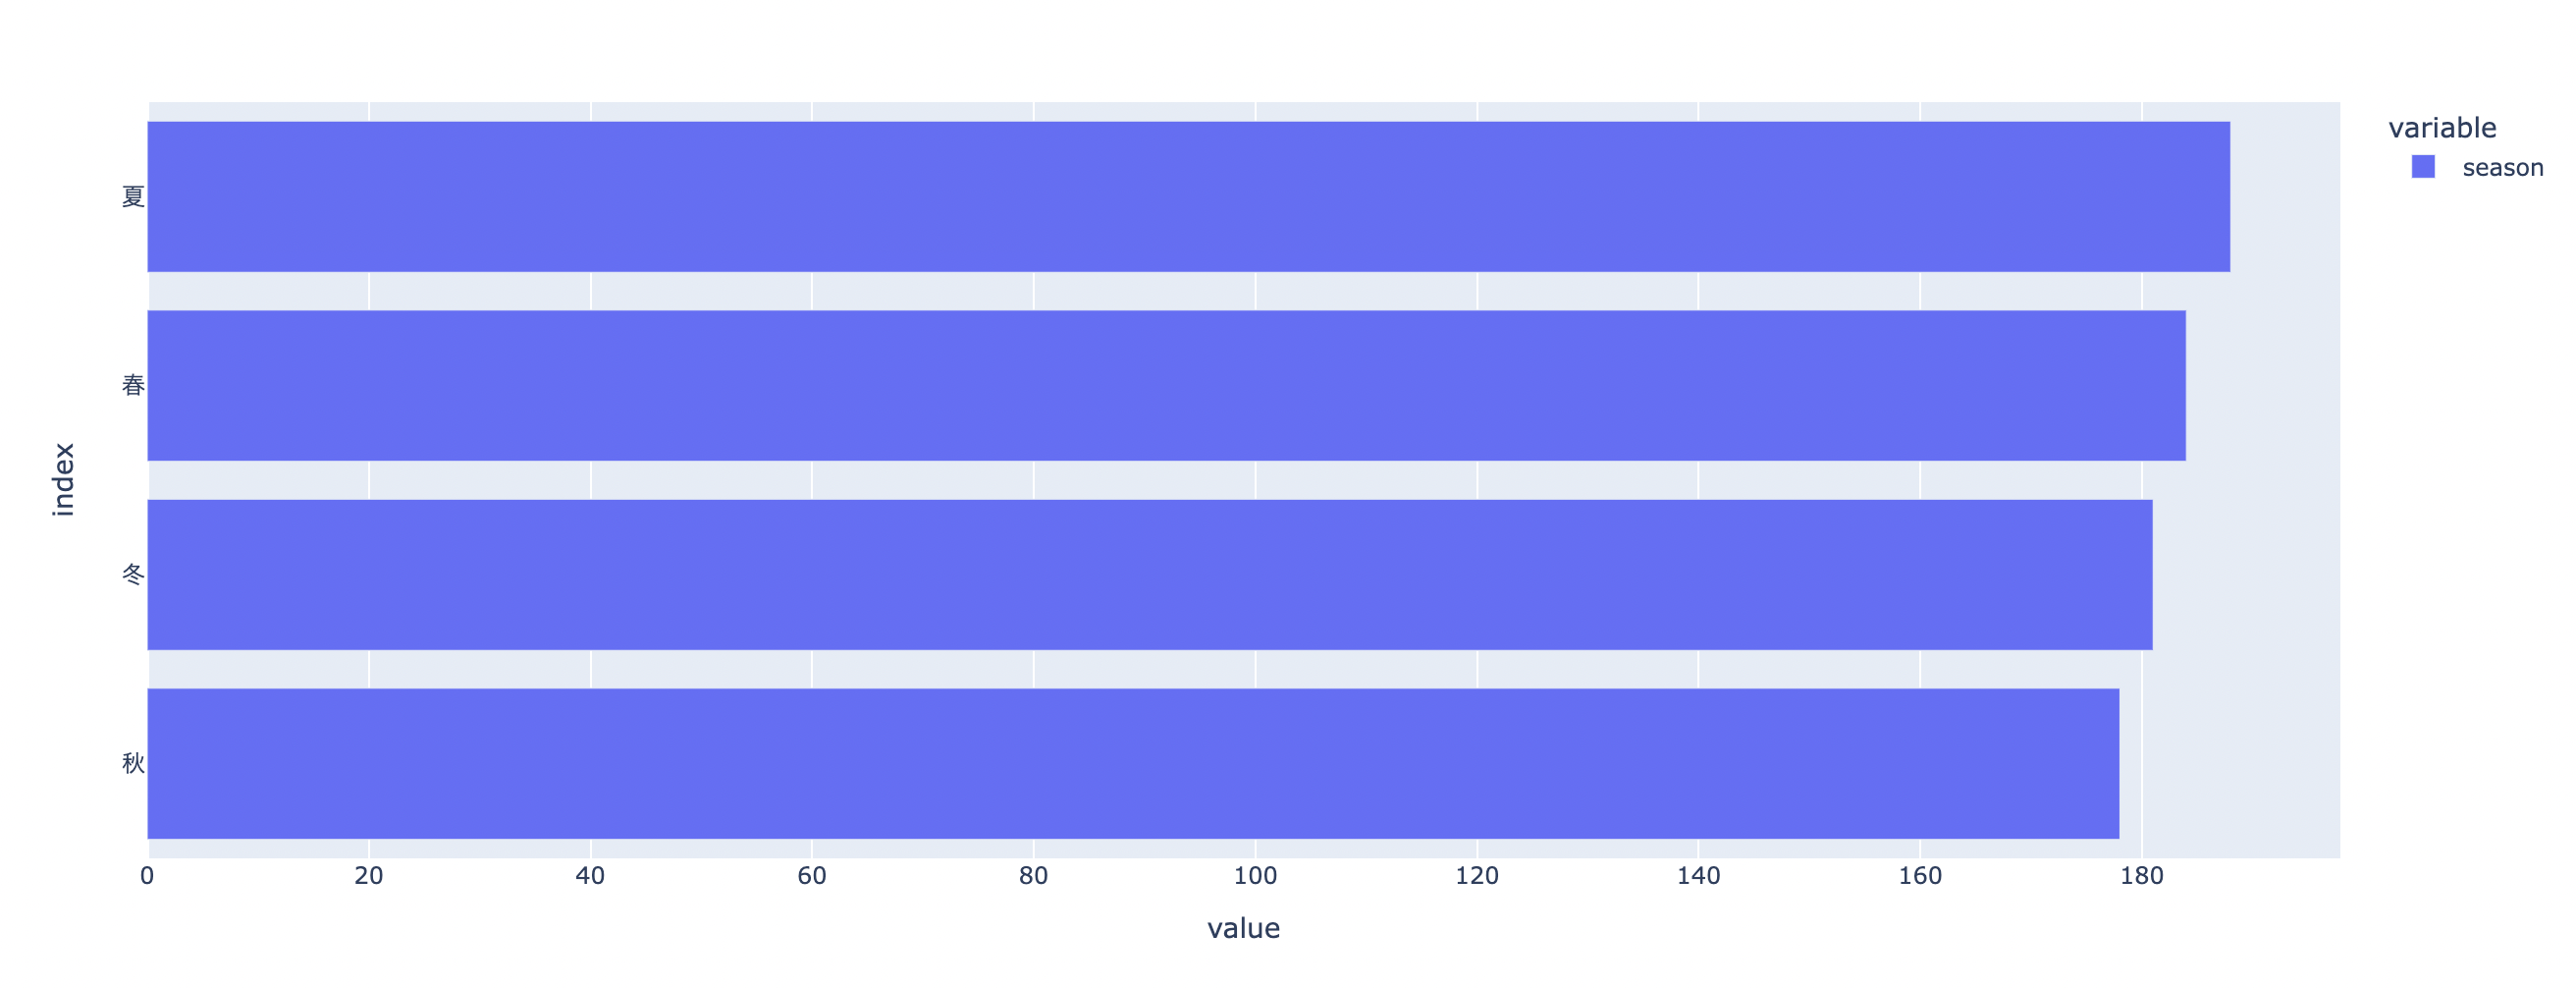
水平にしたい場合(変数重要度でよくみるチャート)
df.season.value_counts().plot.barh()
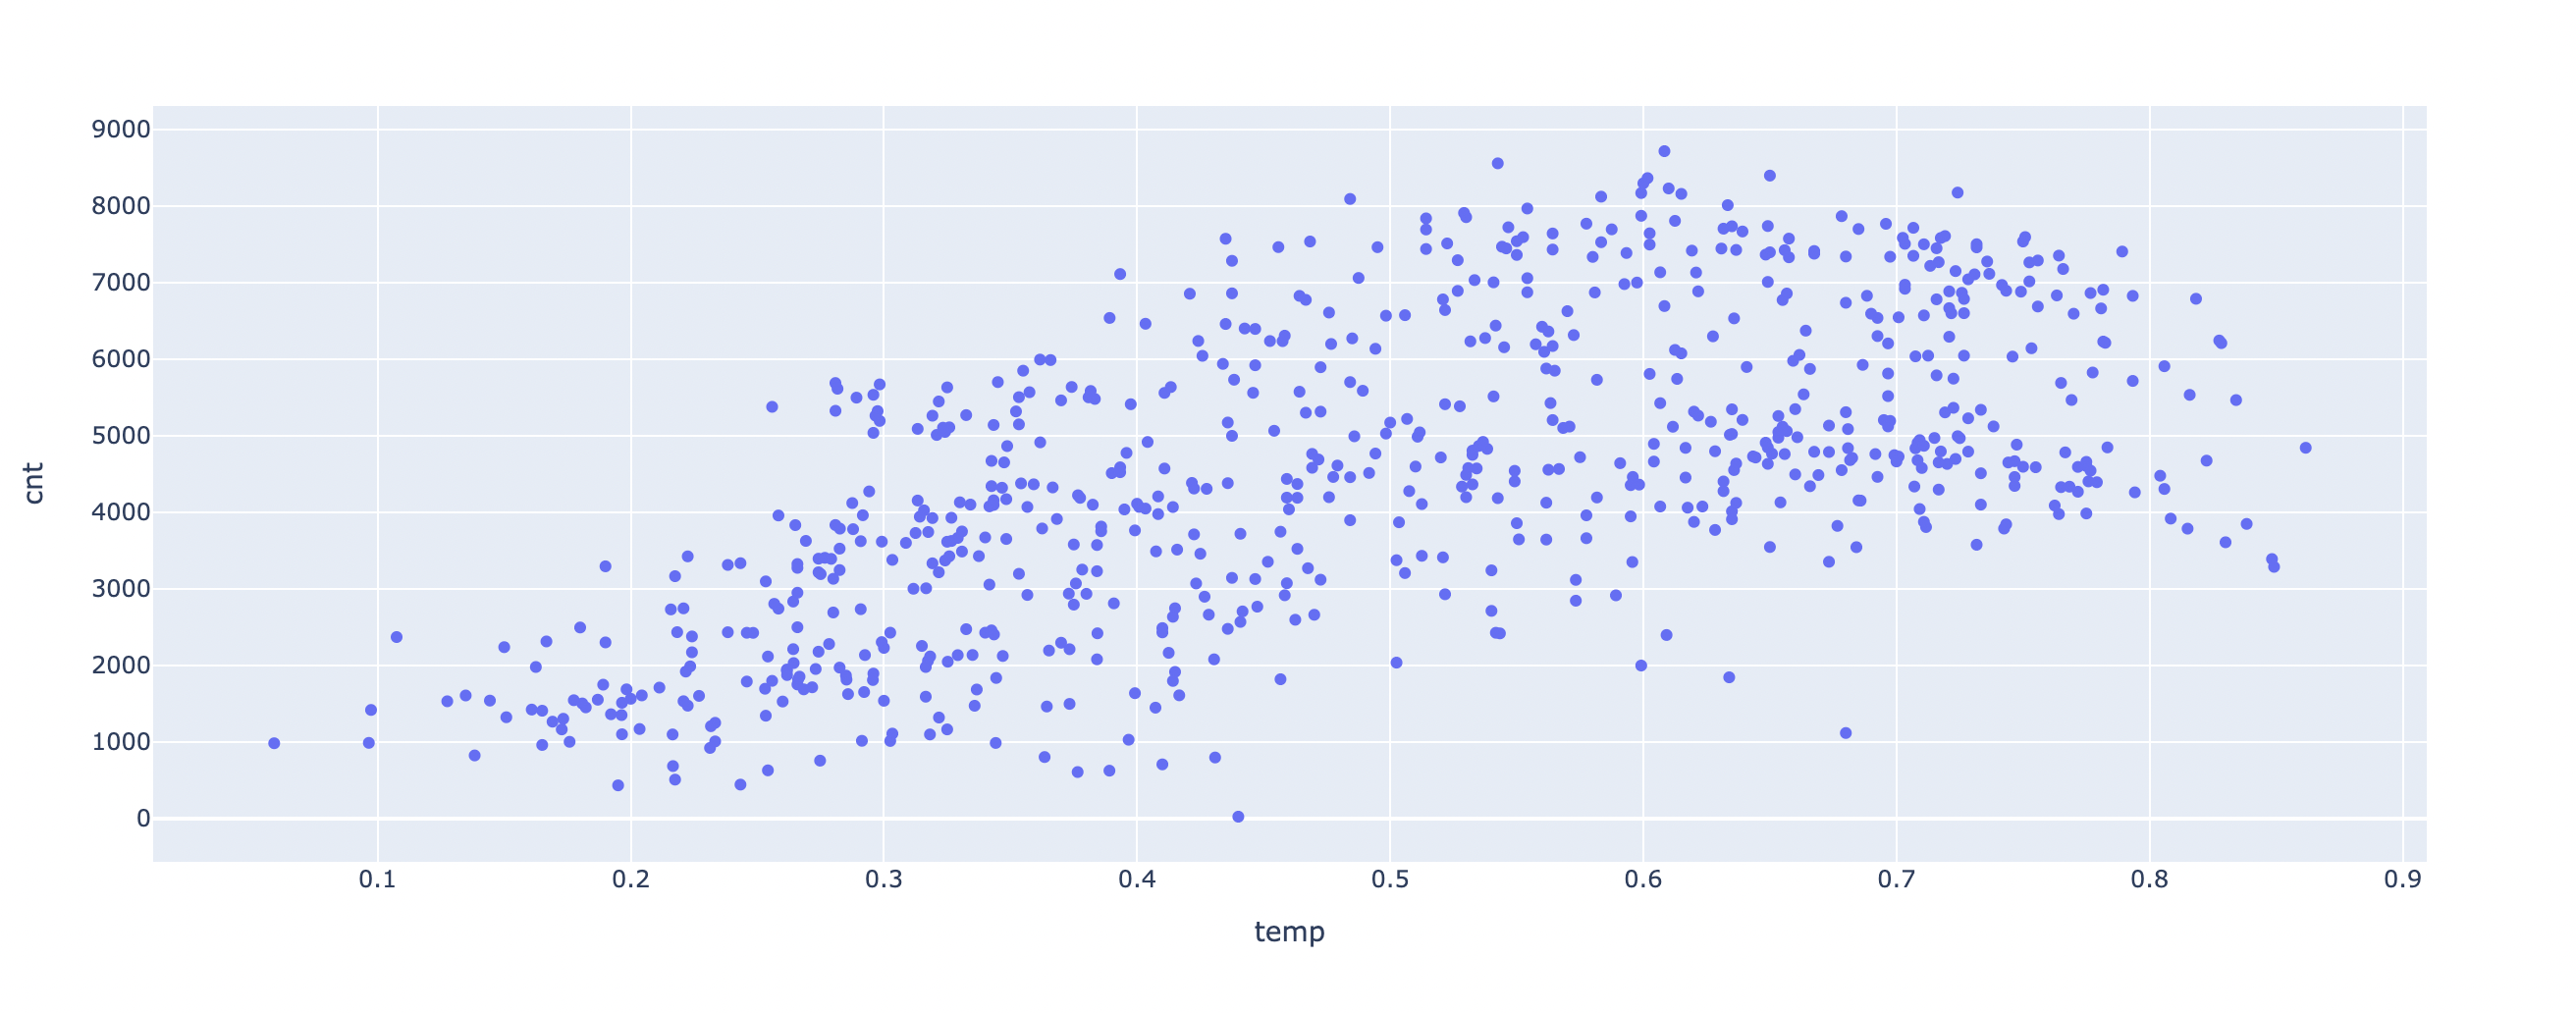
散布図
df.plot.scatter(x="temp", y="cnt")
# 濃淡を見たい場合はopacityを設定
# df.plot.scatter(x="temp", y="cnt", opacity=0.2)
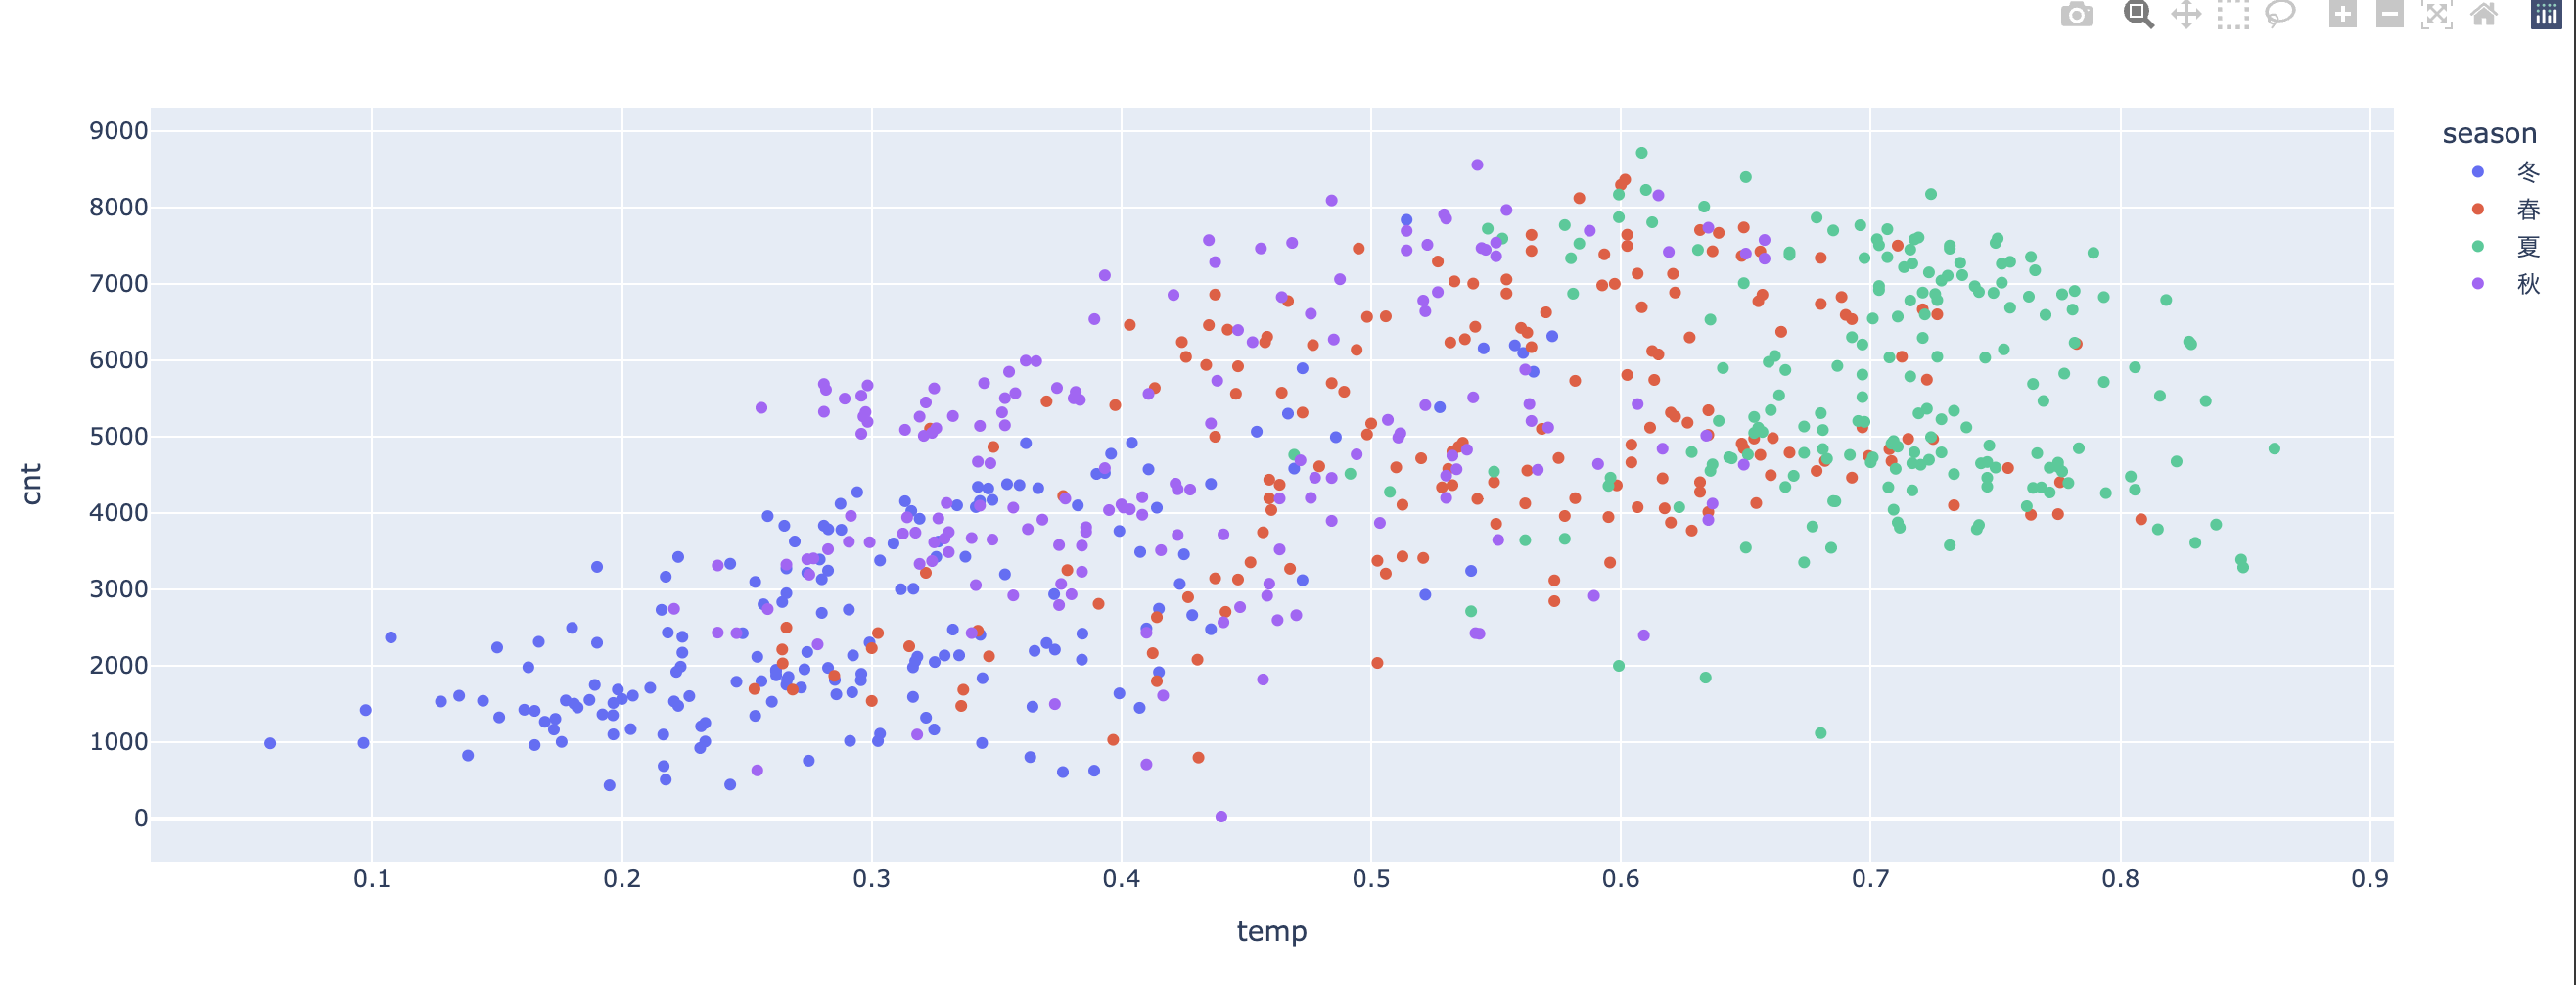
カテゴリごとに色分けできます
df.plot.scatter(x="temp", y="cnt", color="season")
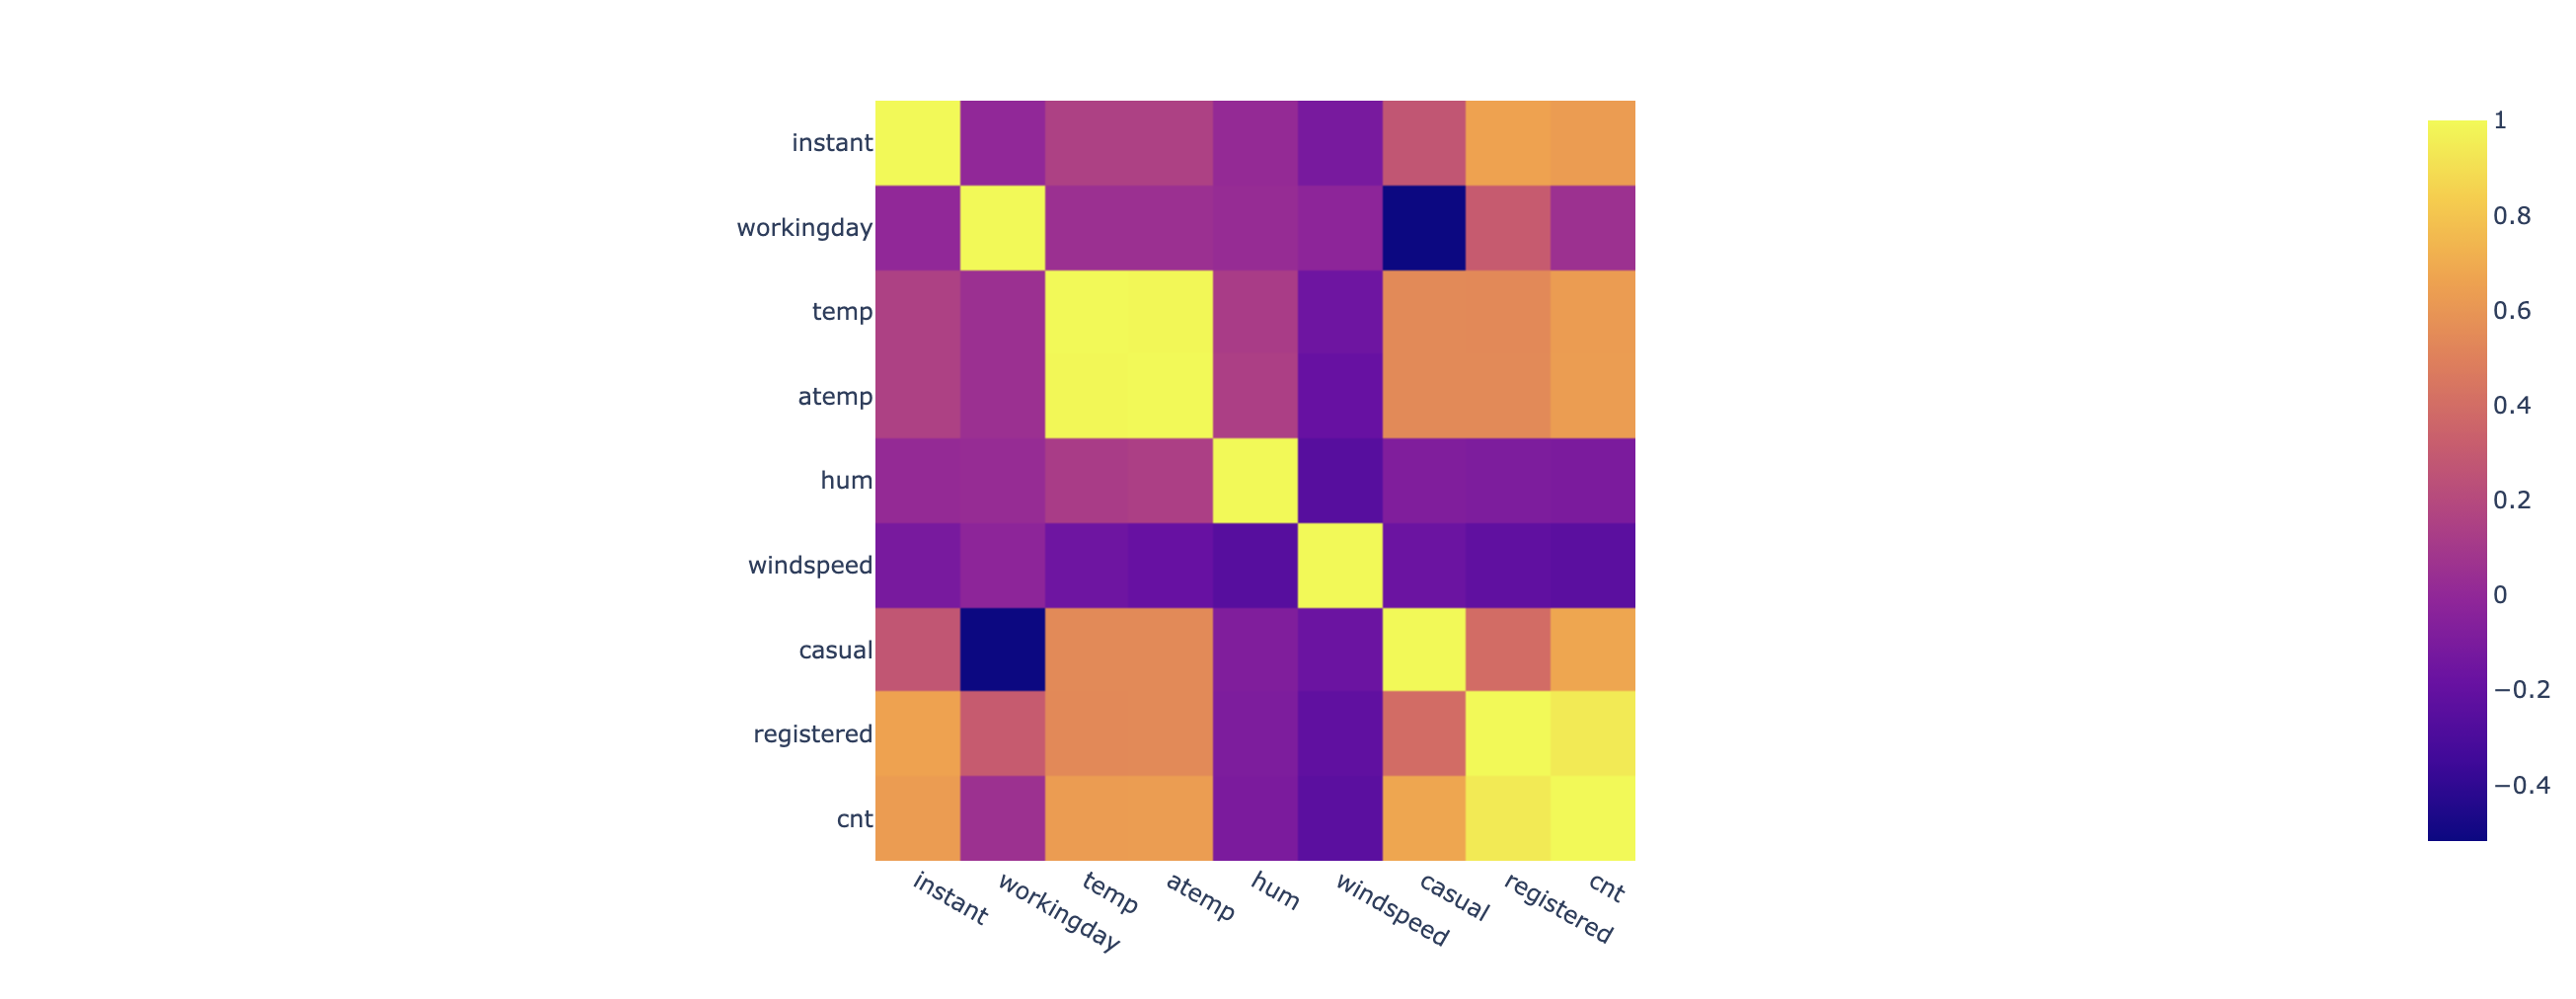
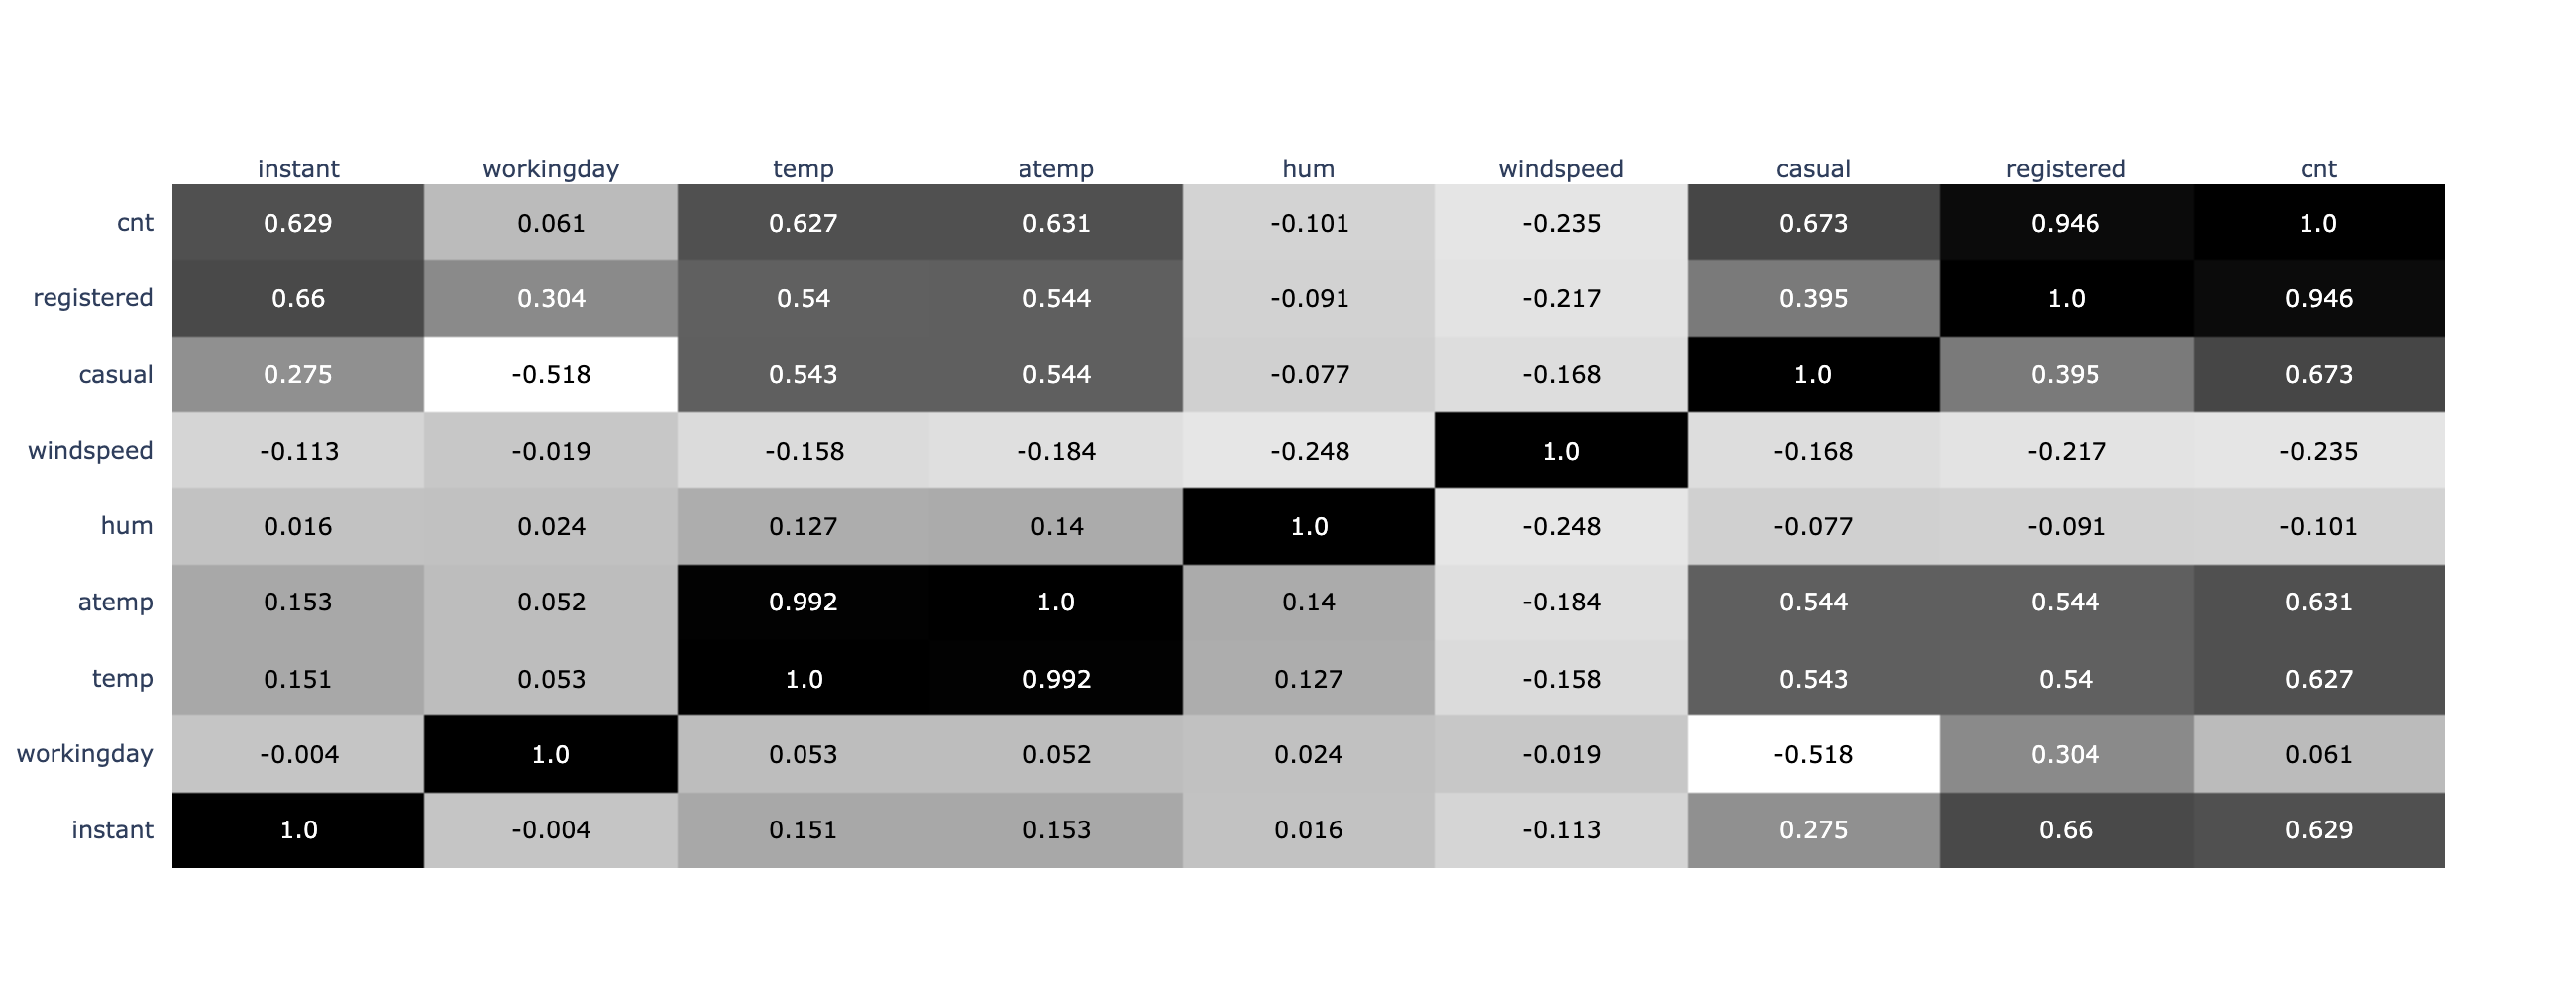
ヒートマップ
# 相関行列
df.corr().round(3).plot(kind="imshow")
アノテーションが欲しい場合はdf.plot()が使えないため, plotlyのライブラリを直接使います。
import plotly.figure_factory as ff
# 相関行列
corr_df = df.corr().round(3)
x_cols = corr_df.index.to_list()
y_cols = corr_df.columns.to_list()
ff.create_annotated_heatmap(corr_df.values, x=x_cols, y=y_cols, colorscale='Greys')
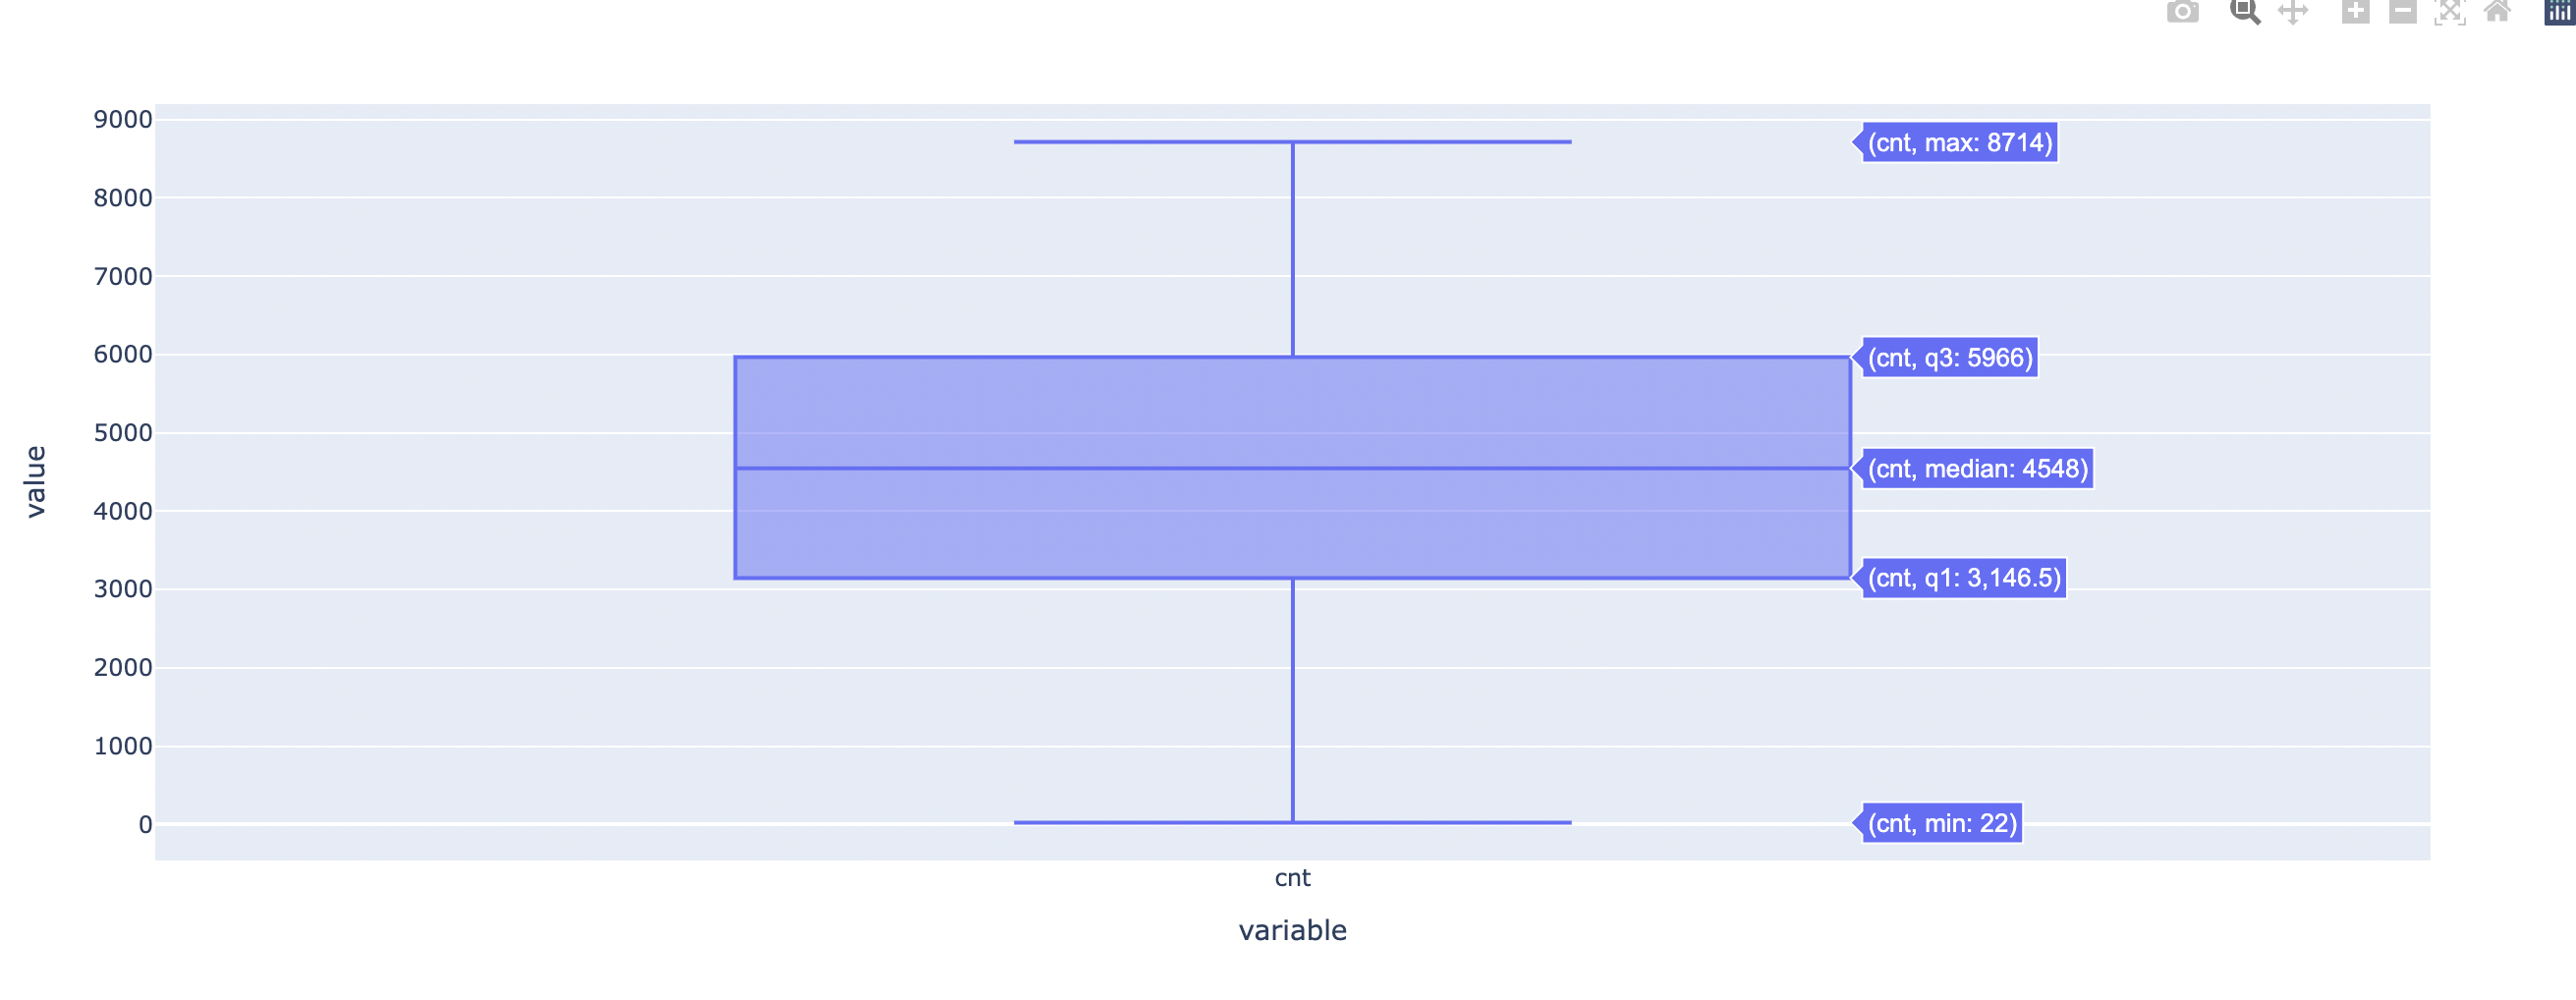
箱ひげ図
df.cnt.plot.box()
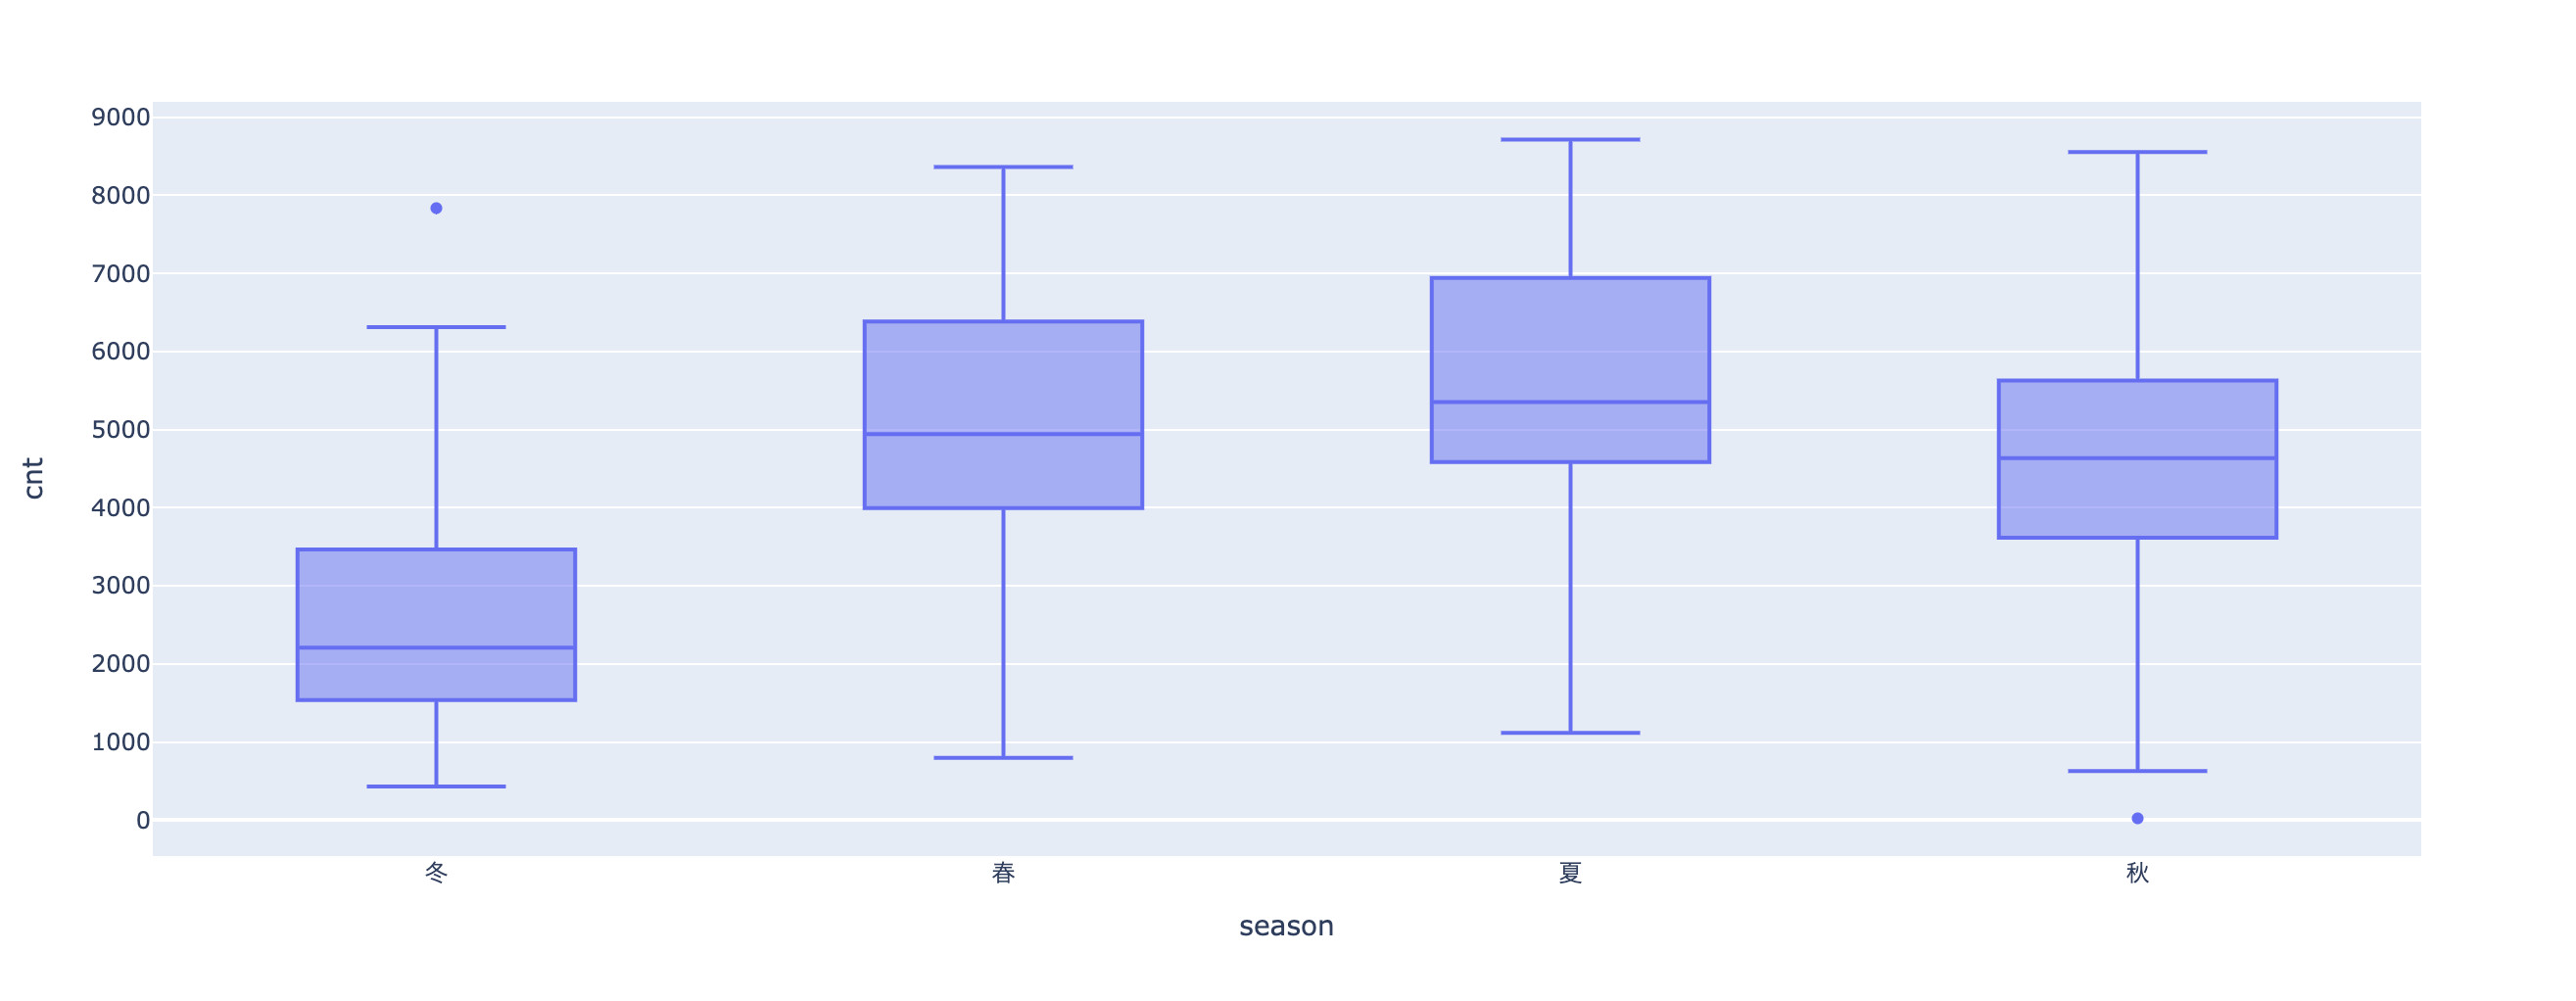
カテゴリごとに分けれます
df.plot.box(x="season", y="cnt")
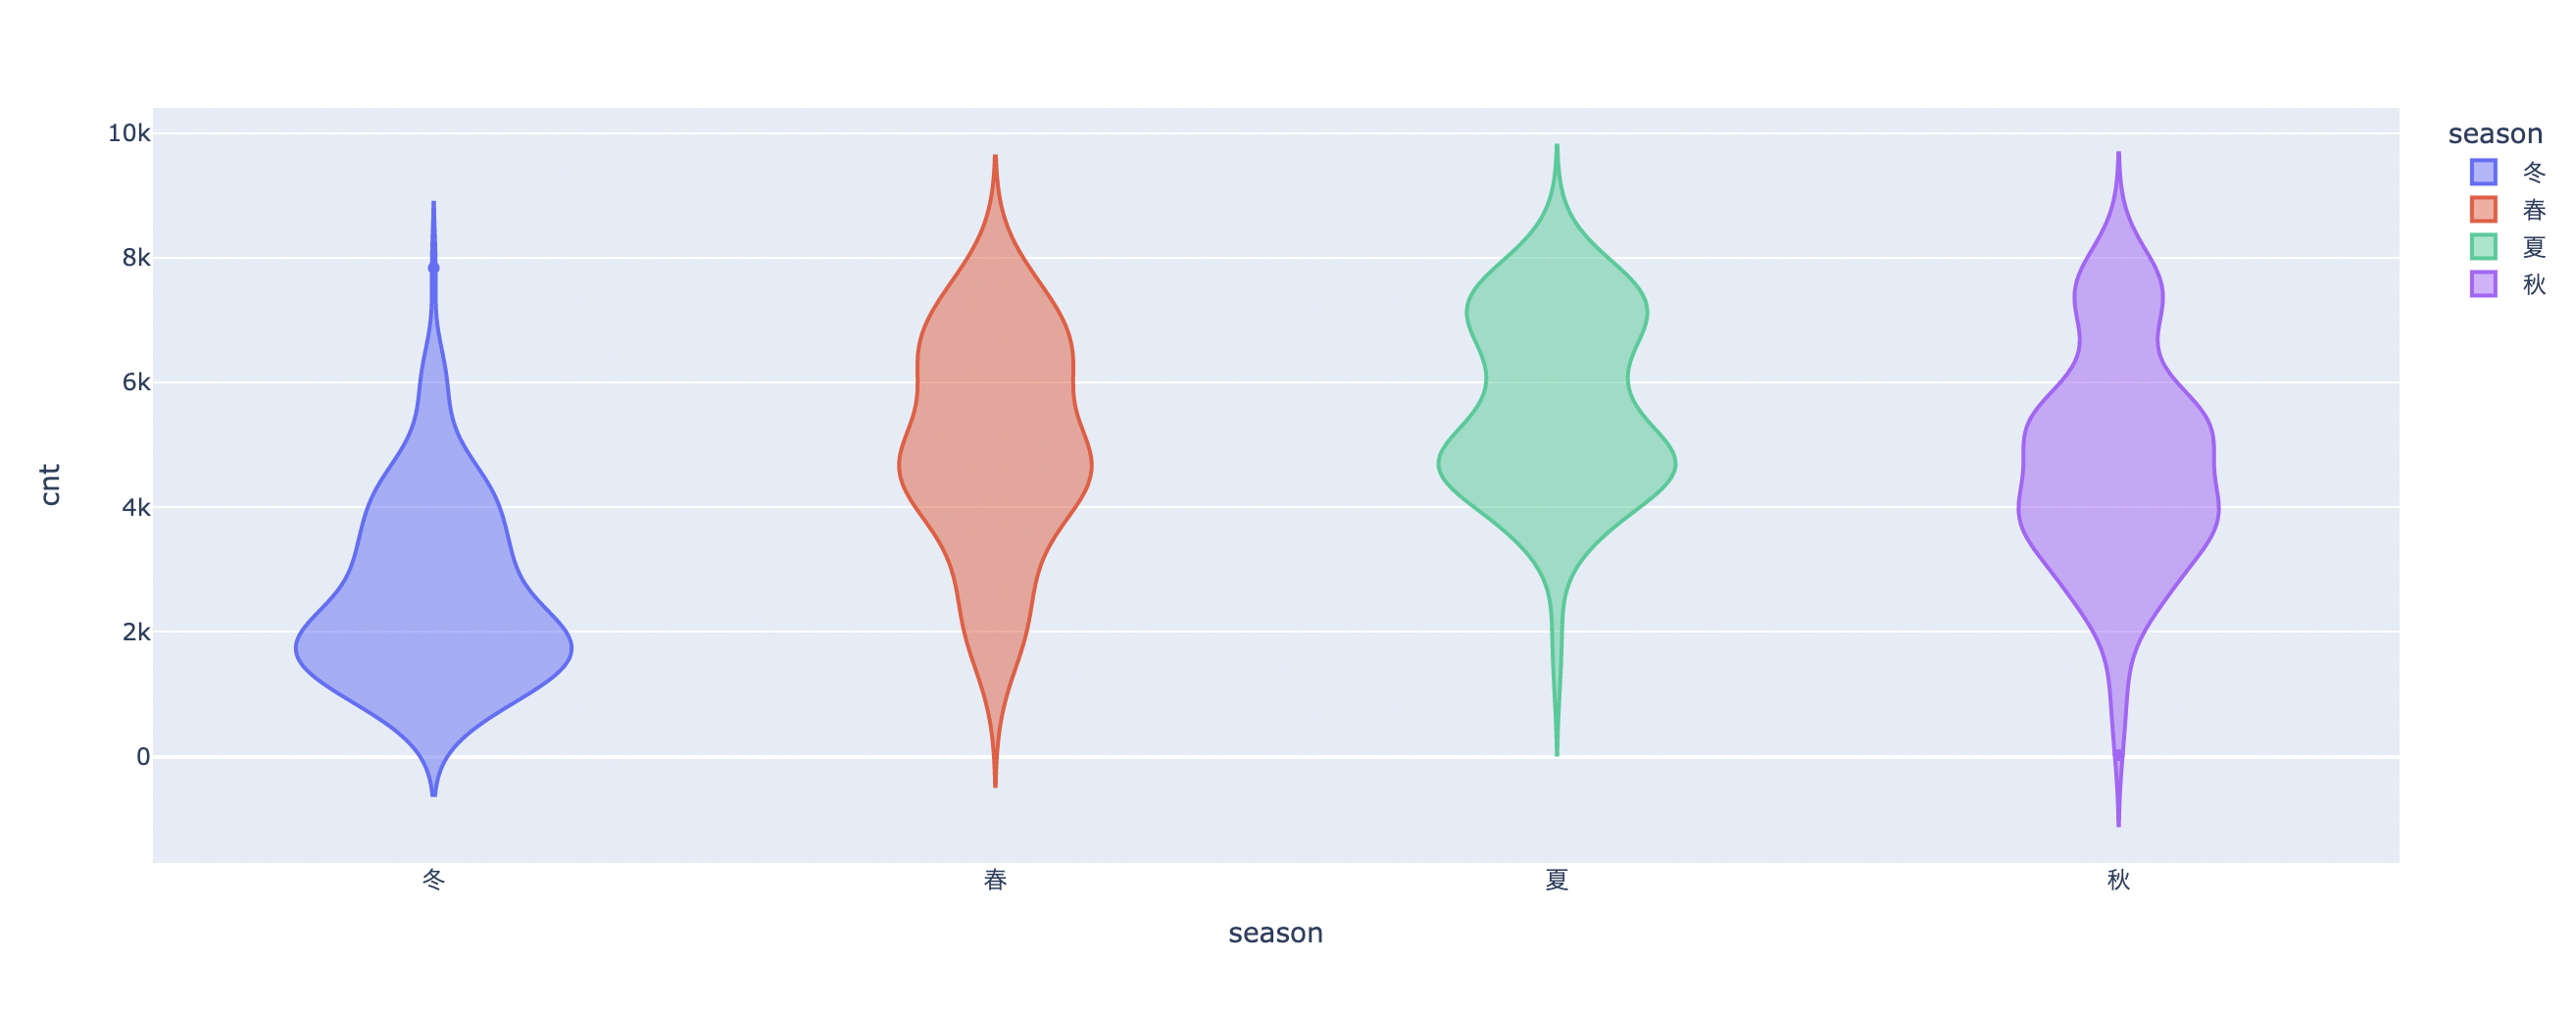
バイオリンプロット
df.plot.violinが無いのでdf.plot(kind="種類")で指定します
df.plot(x="season", y="cnt", kind="violin", color="season")
線グラフ
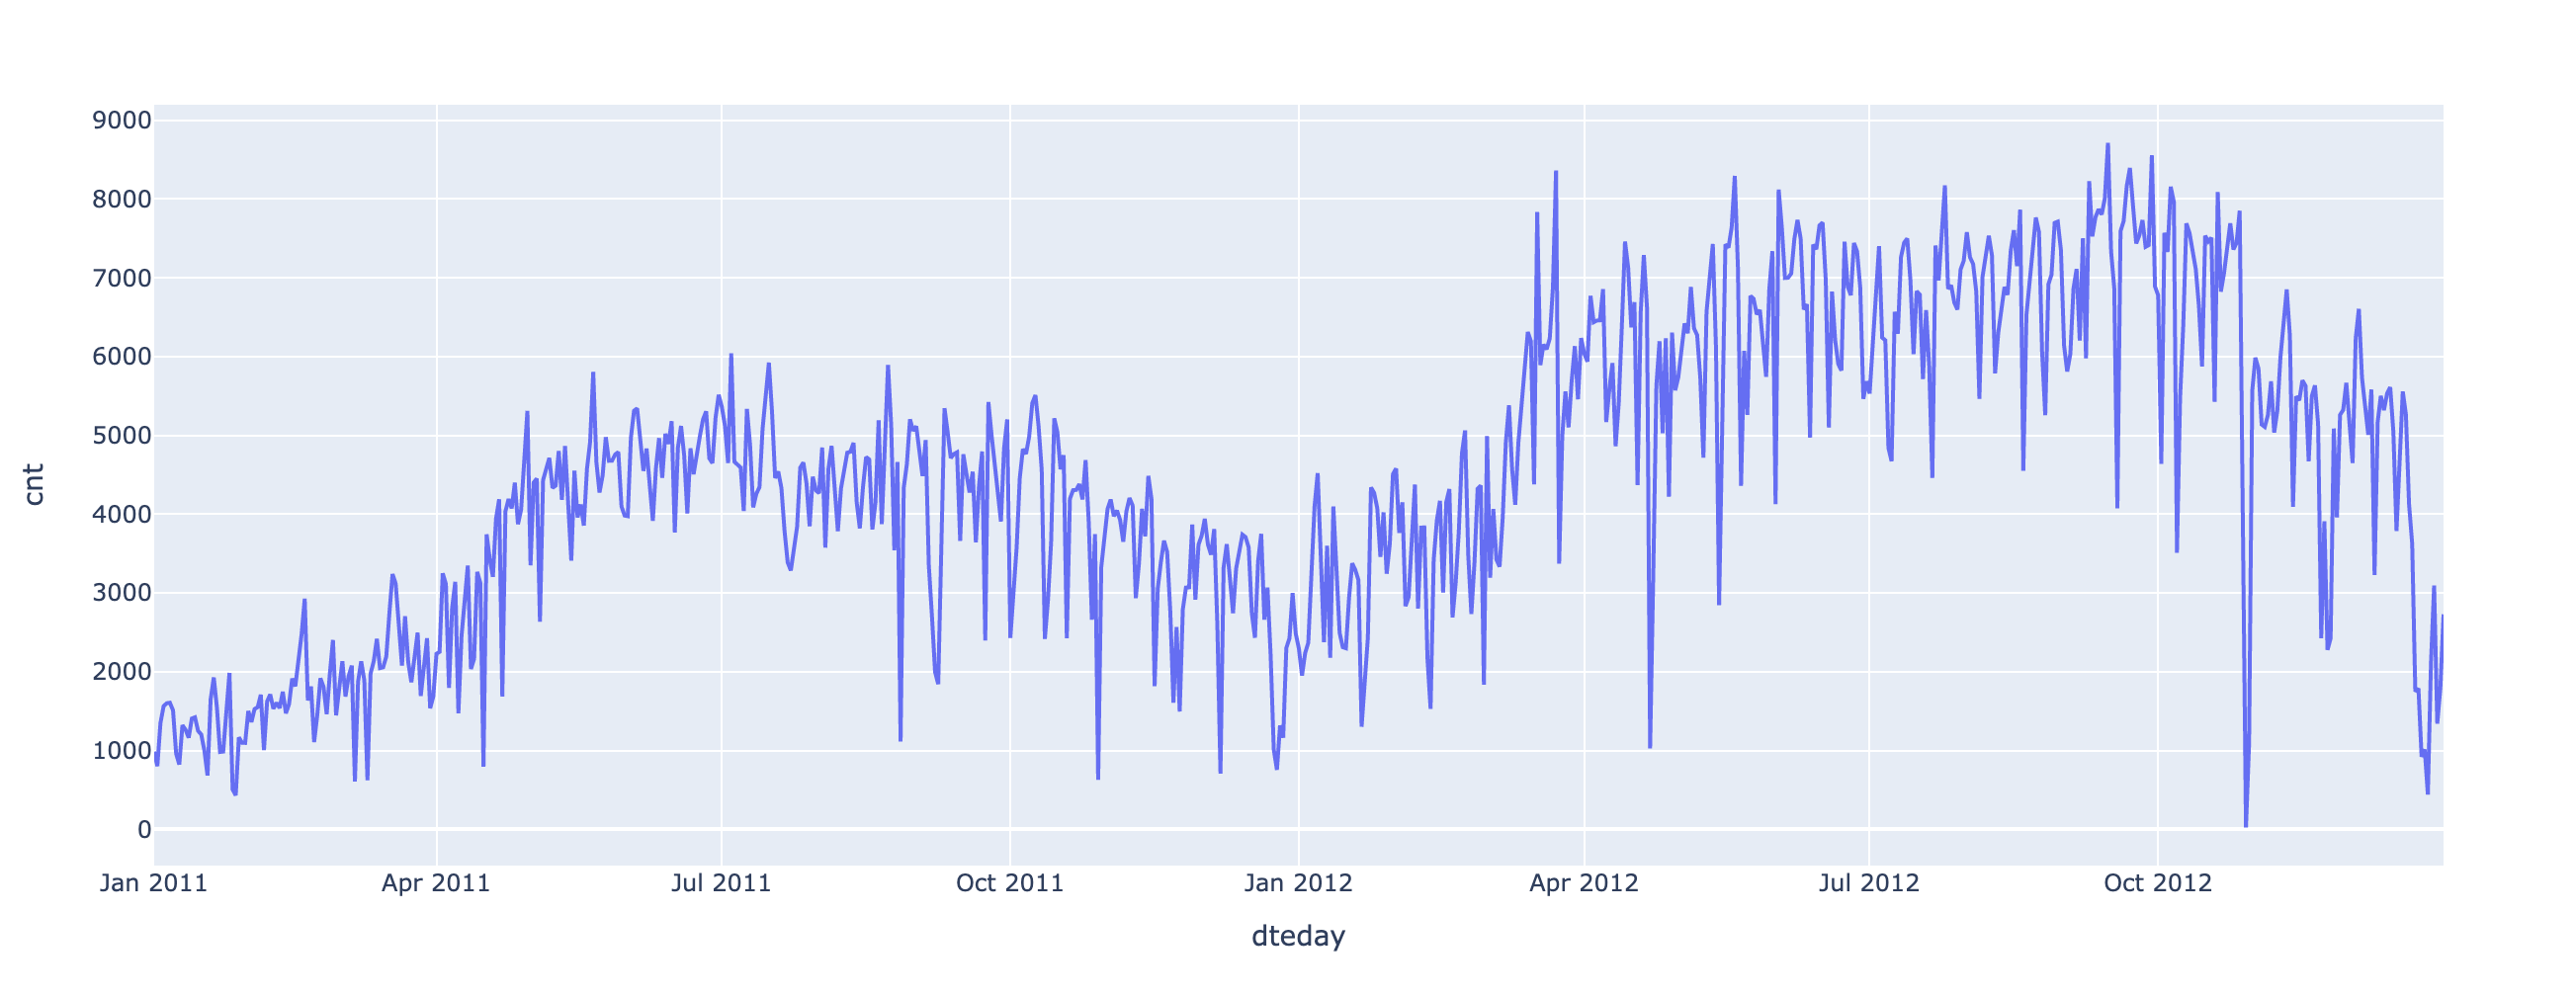
df.plot.line(x="dteday", y="cnt")
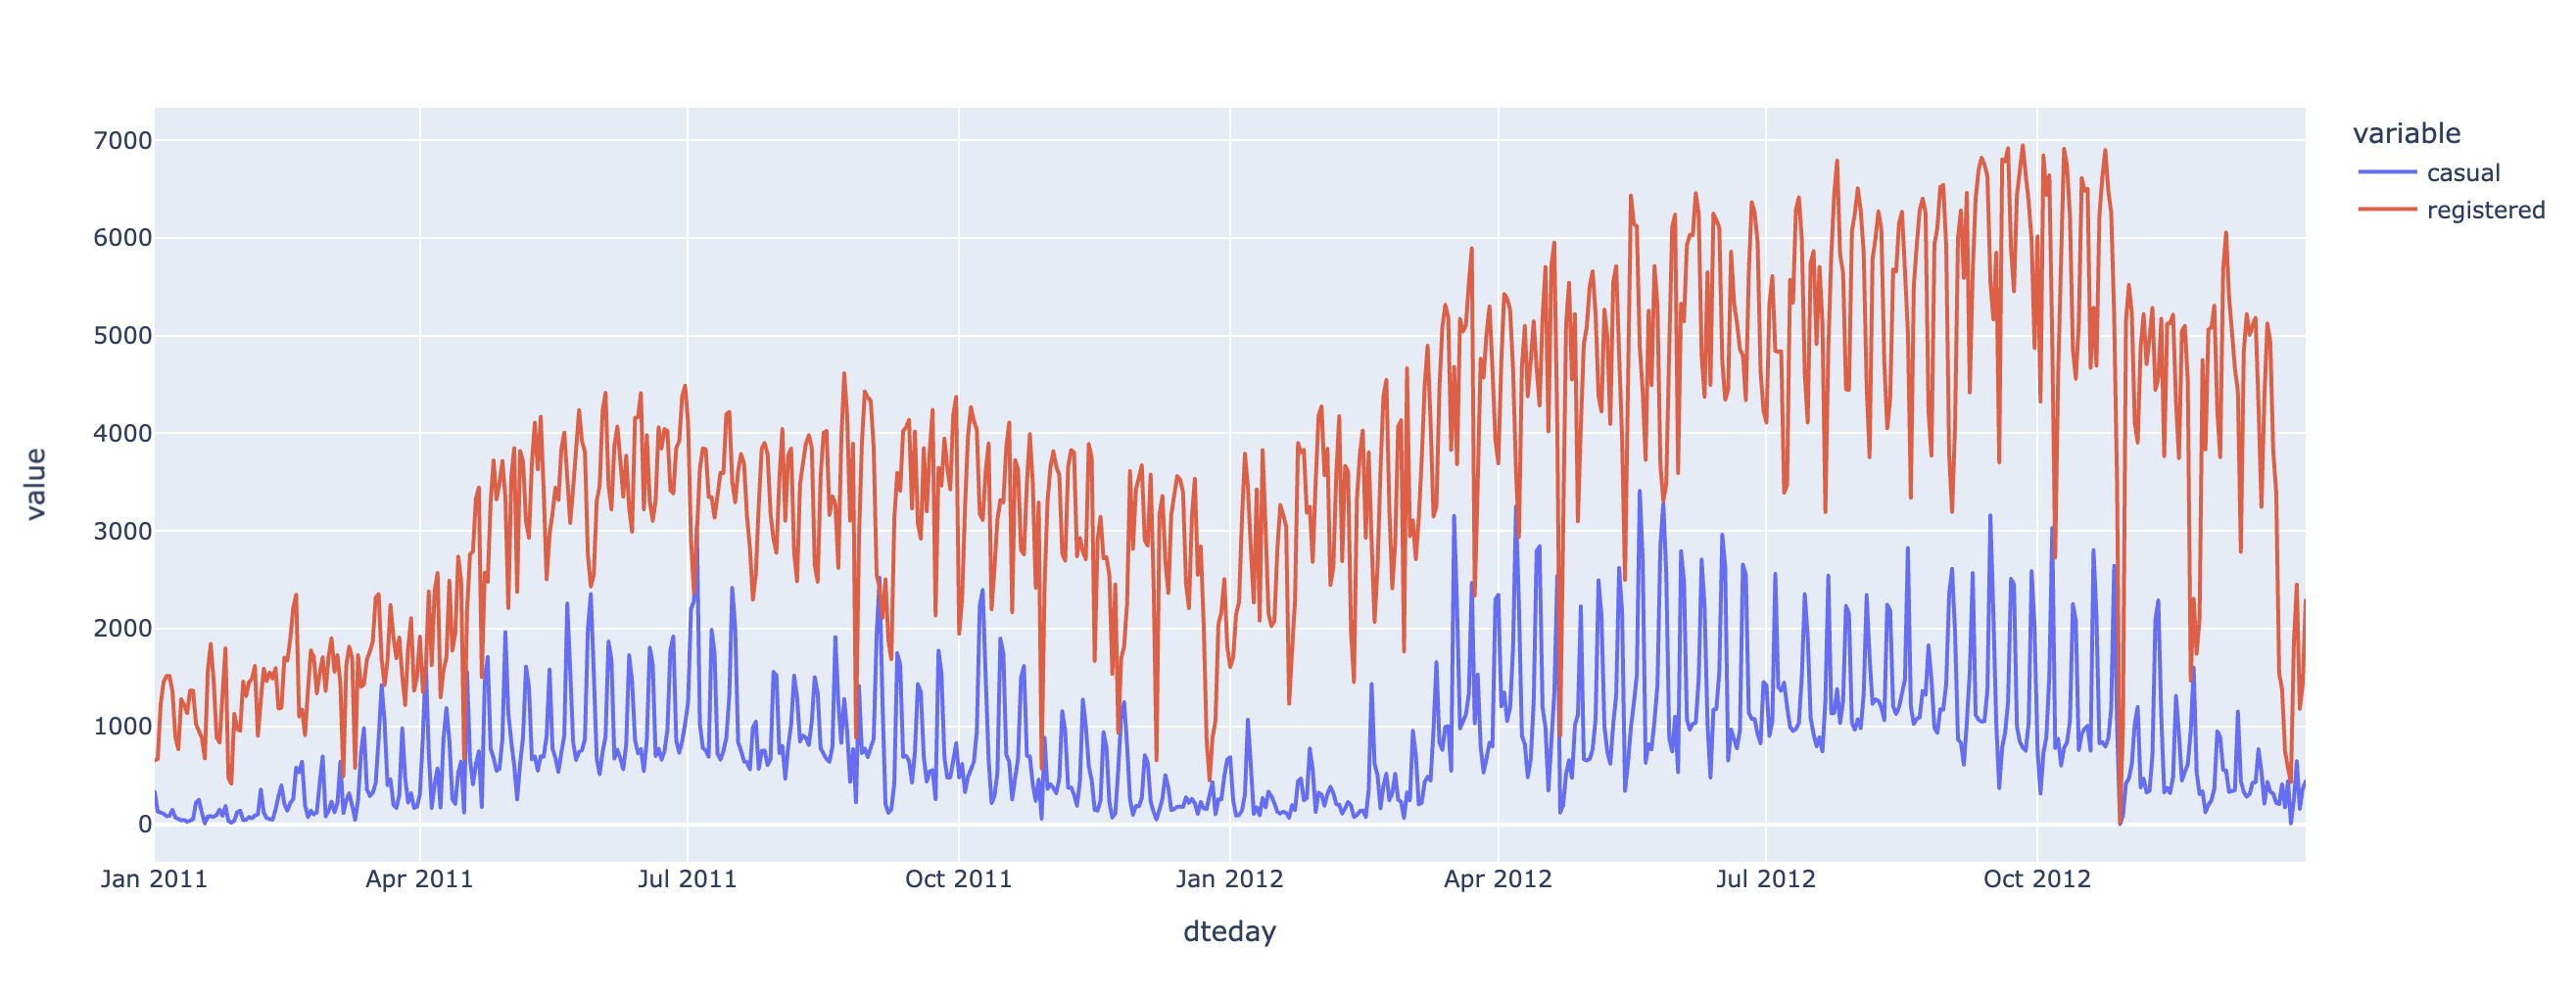
横持ちなら楽に分けれます
df.set_index("dteday").plot.line(y=["casual", "registered"])
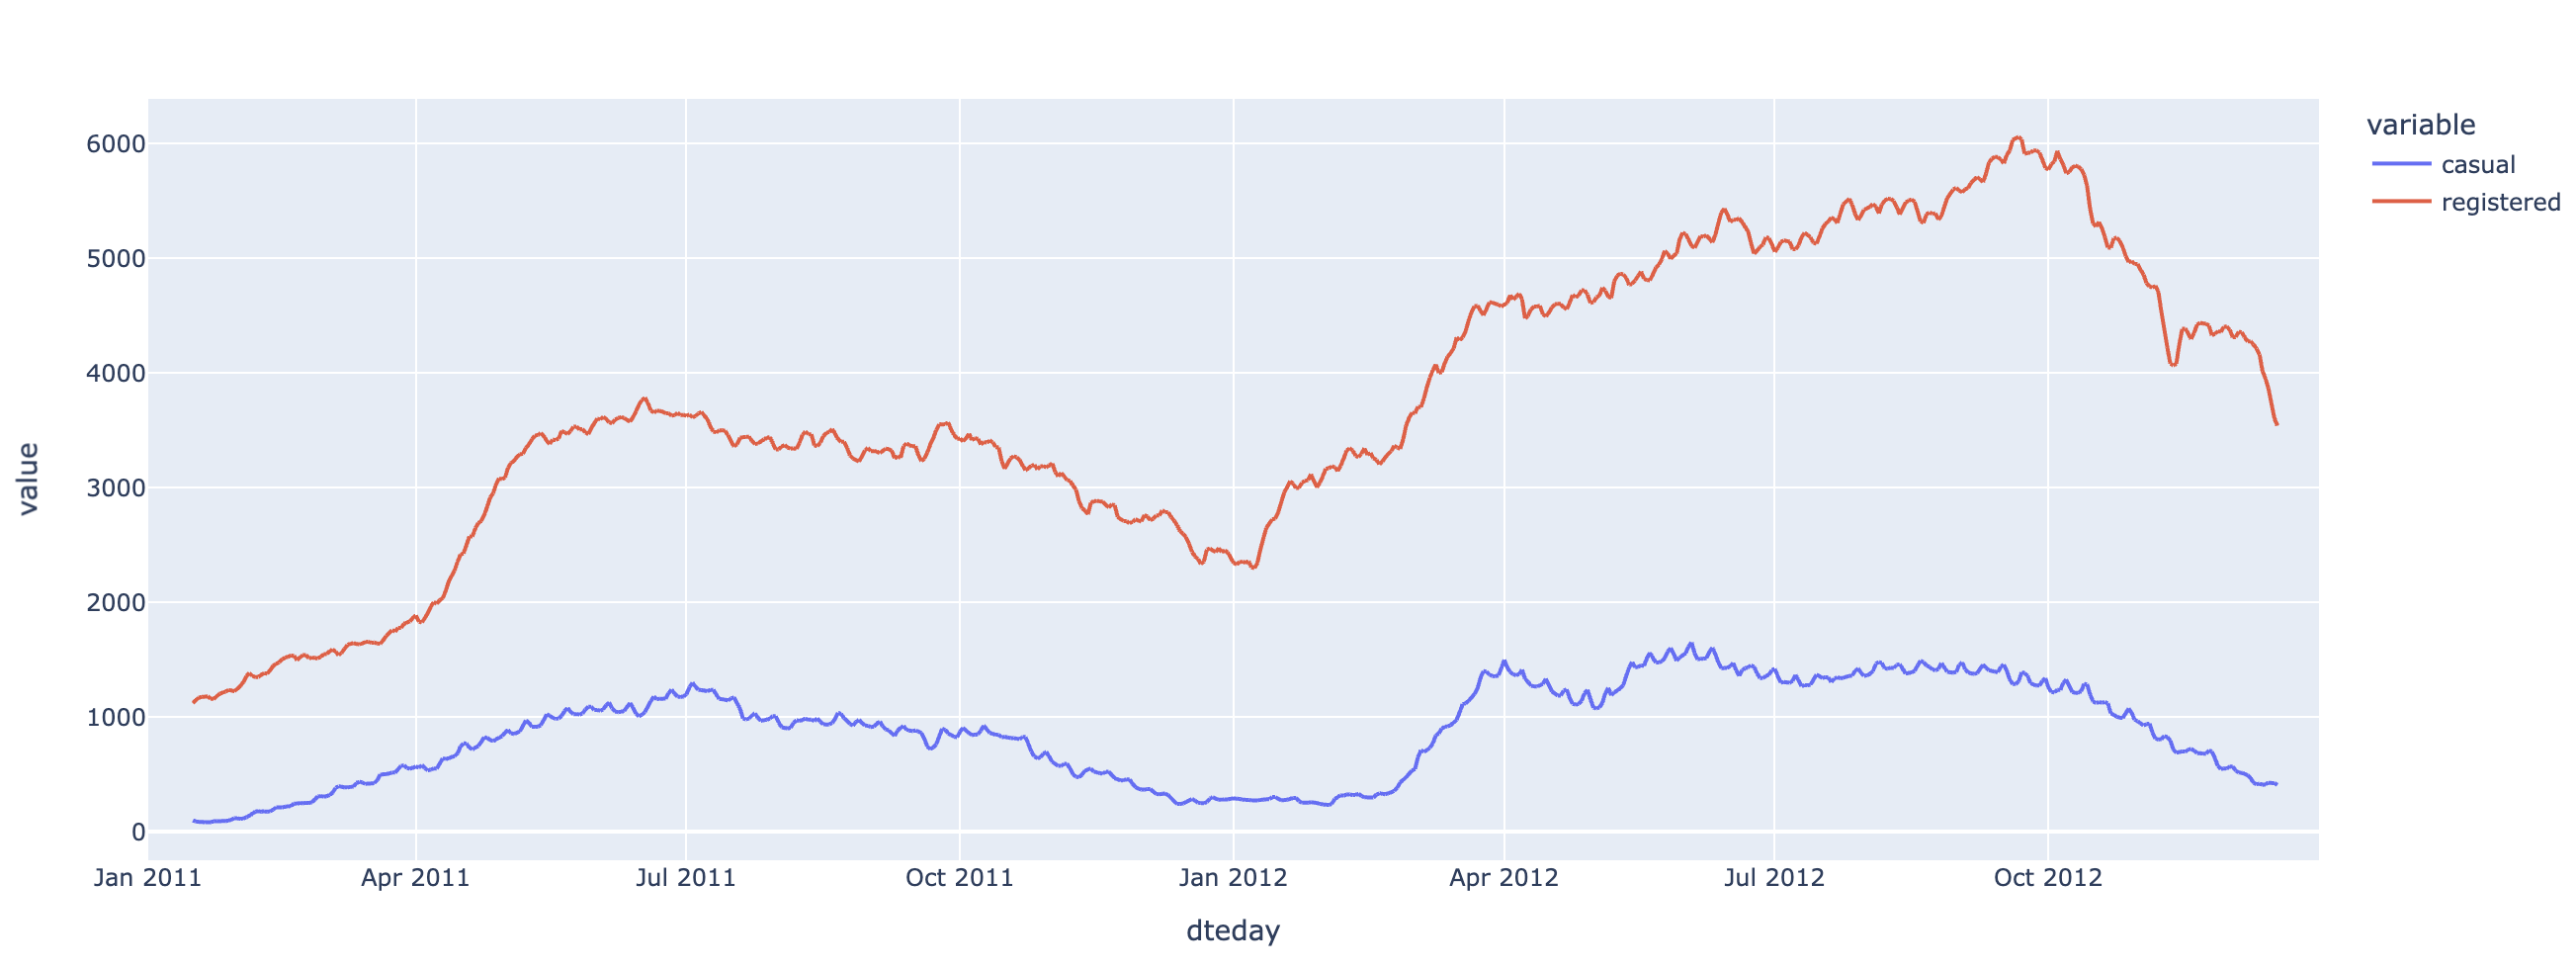
30日移動平均を計算後そのまま可視化できます
df.set_index("dteday")[["casual", "registered"]].rolling(window=30, center=True).mean().plot.line()
円グラフ
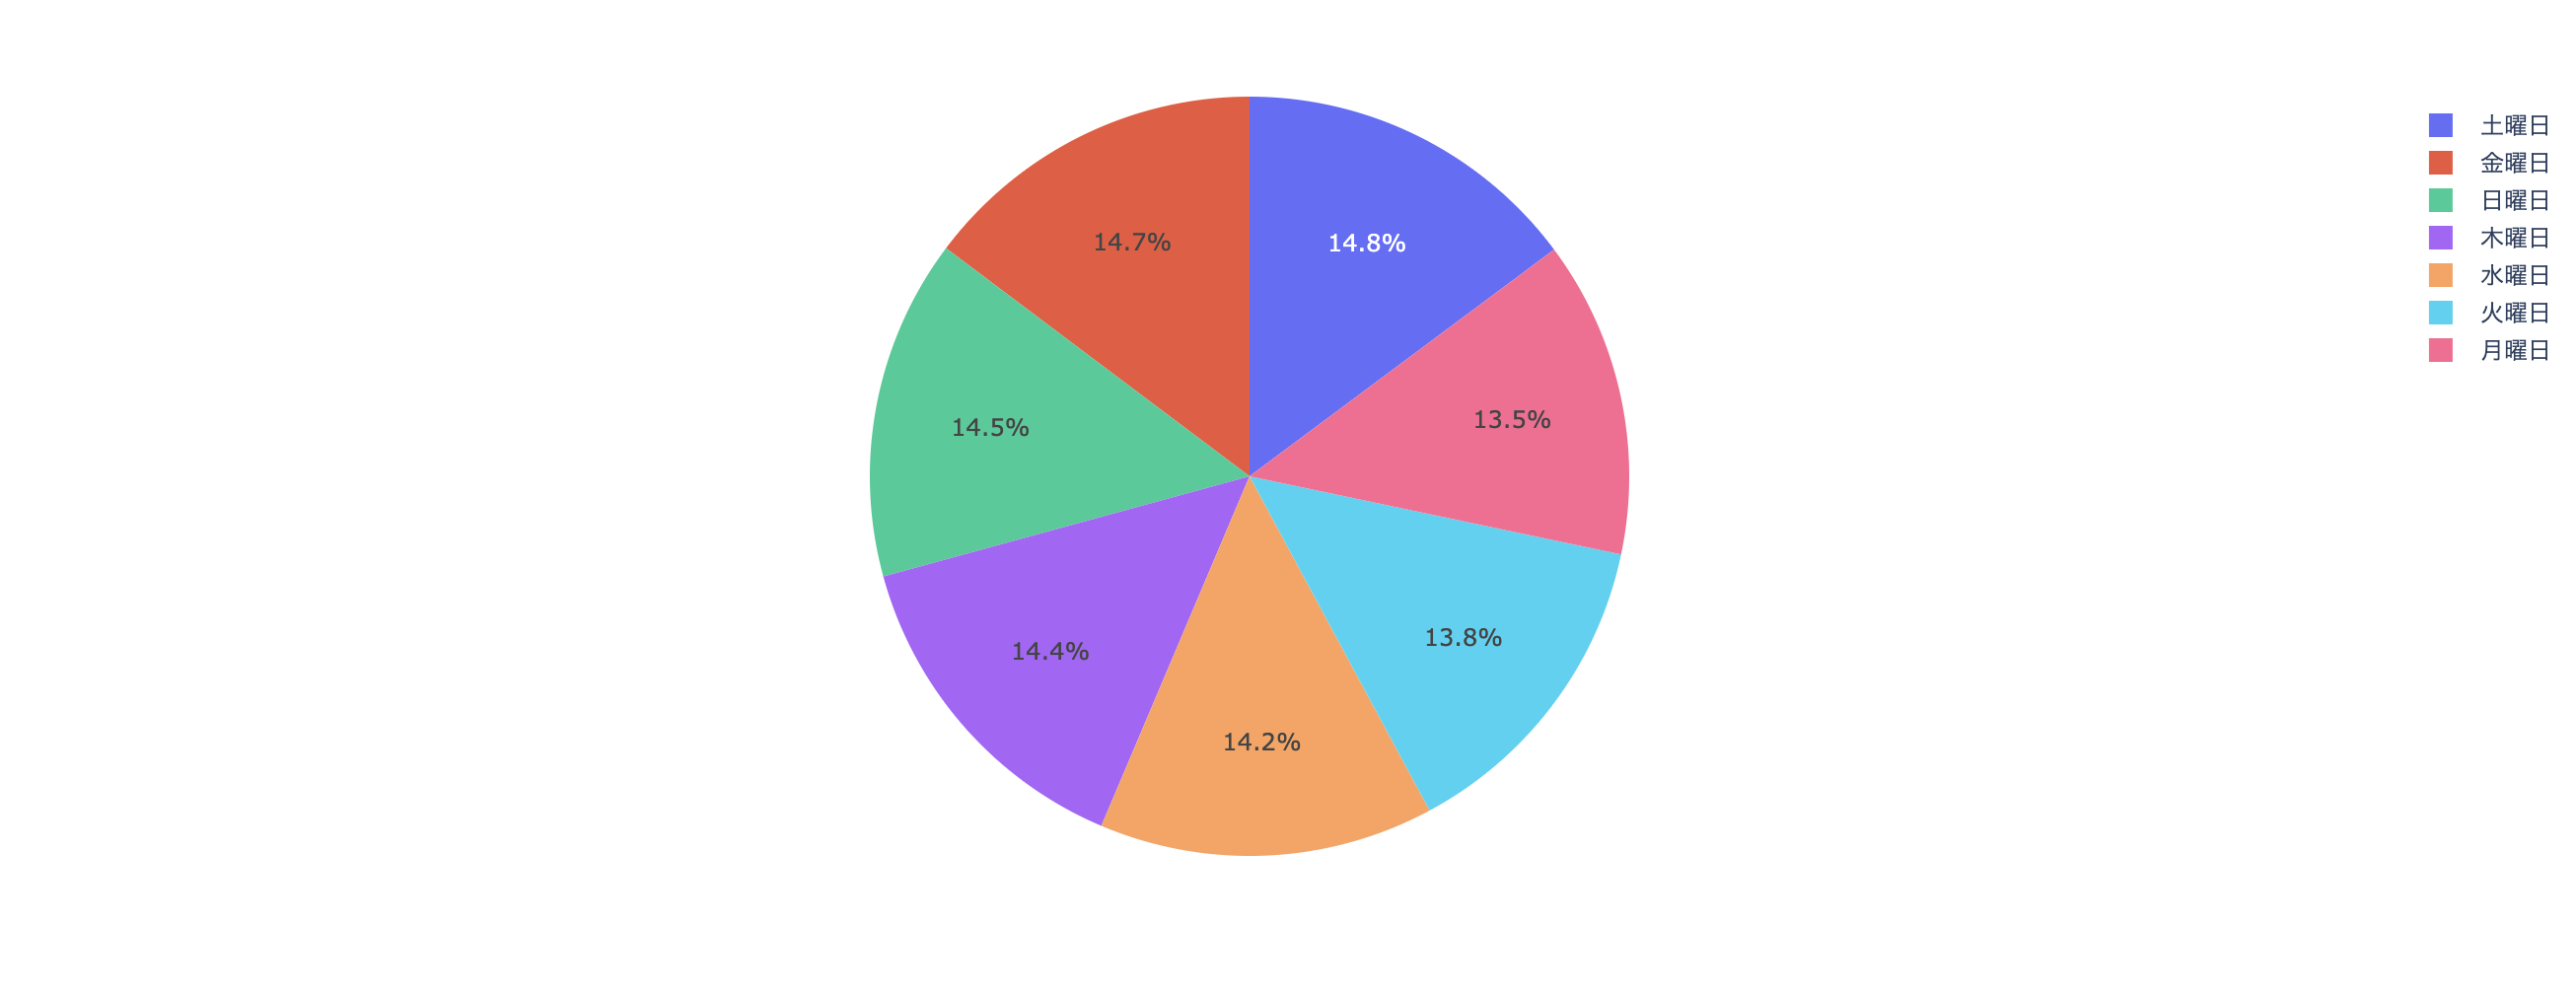
df.plot.pie(x="weekday", y="cnt")がまだ対応して無いです。。(使用頻度少ないので大丈夫そうですが)
import plotly.express as px
px.pie(df, values="cnt", names="weekday")
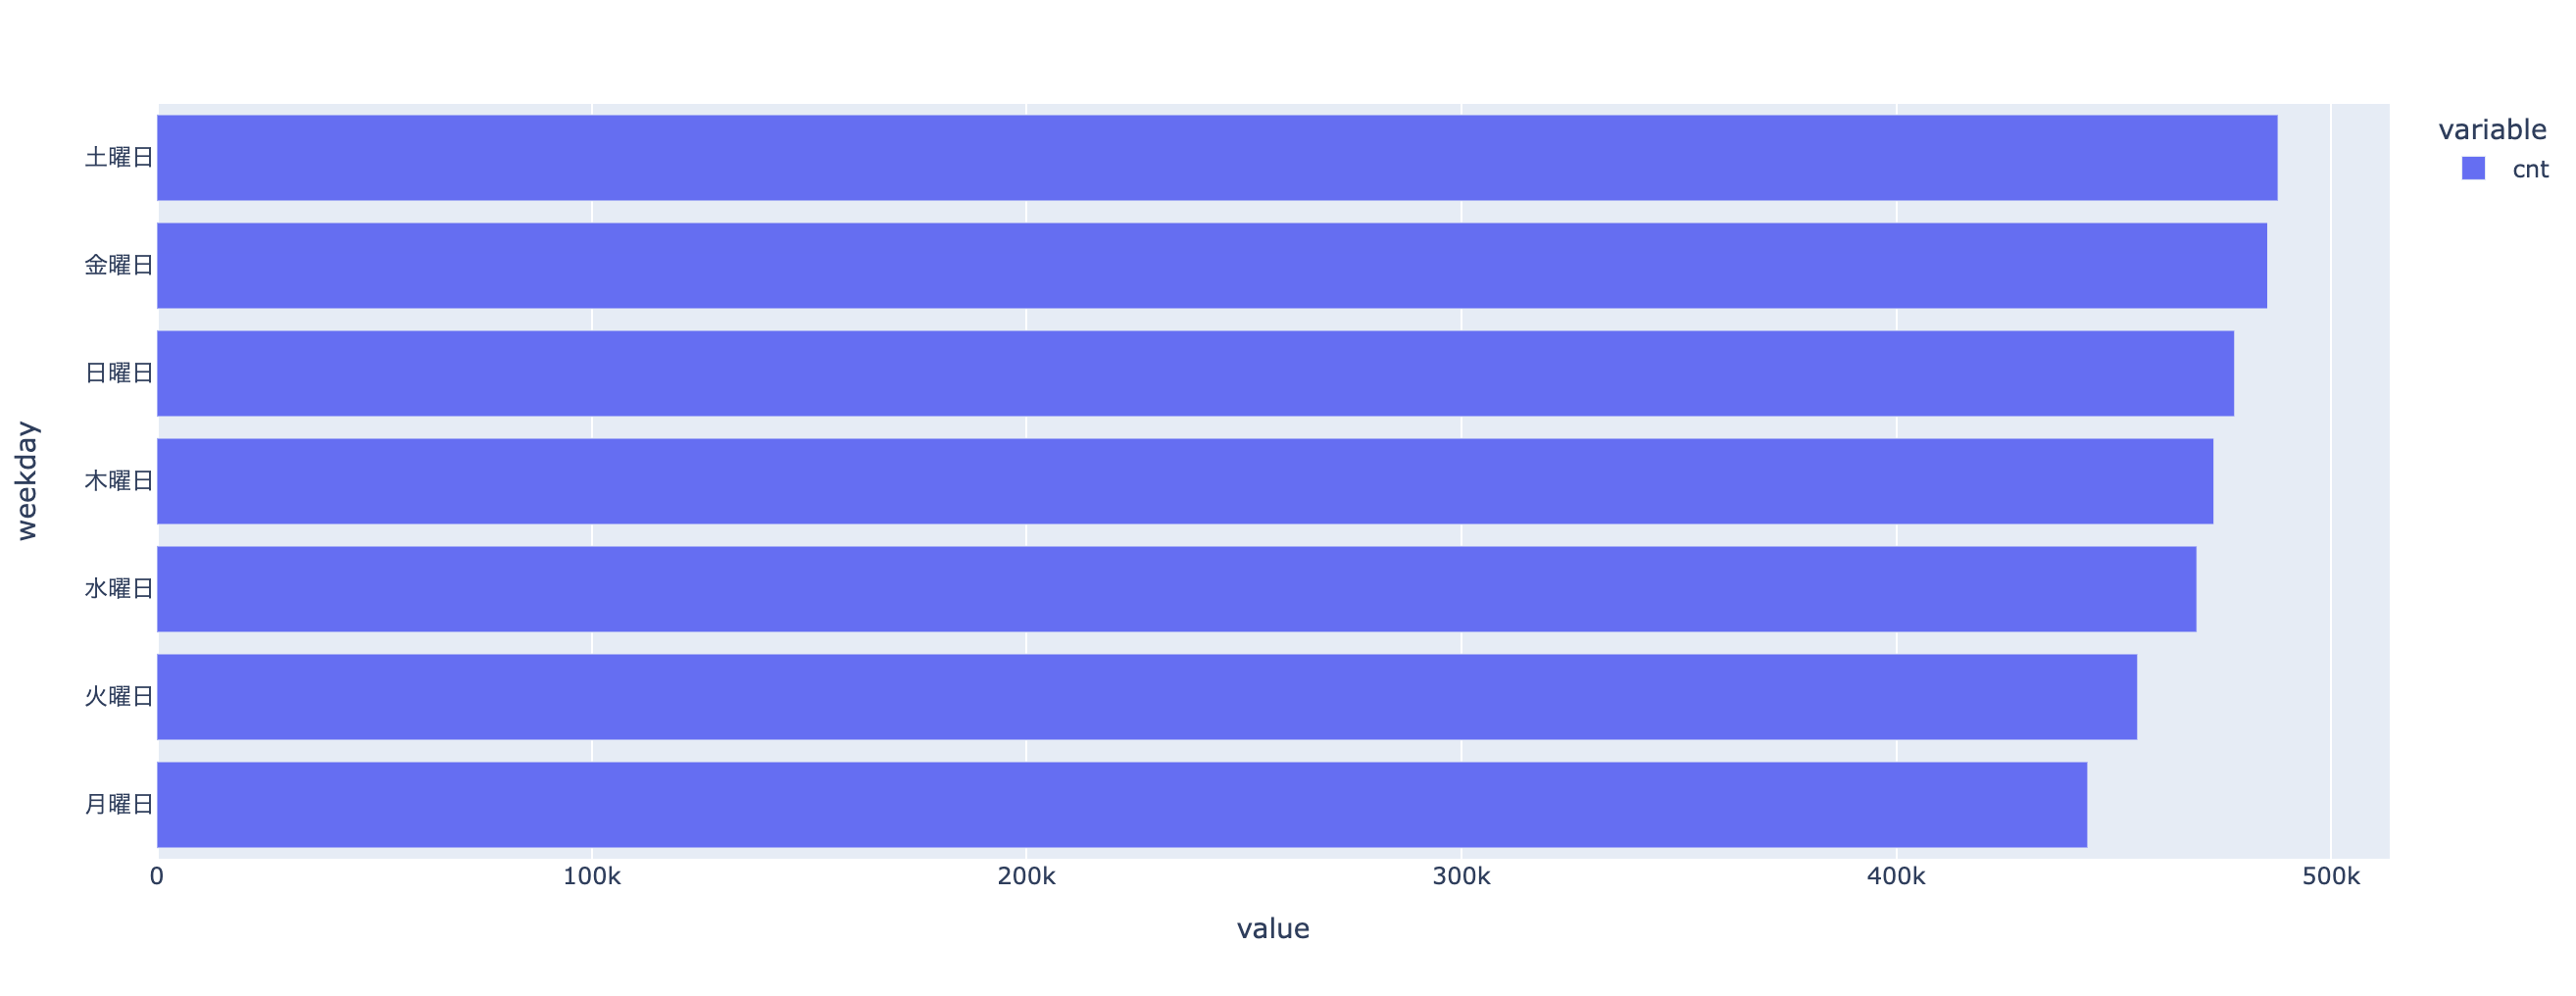
少し綺麗に見せたい
df.groupby("weekday").cnt.sum().sort_values().plot.barh()
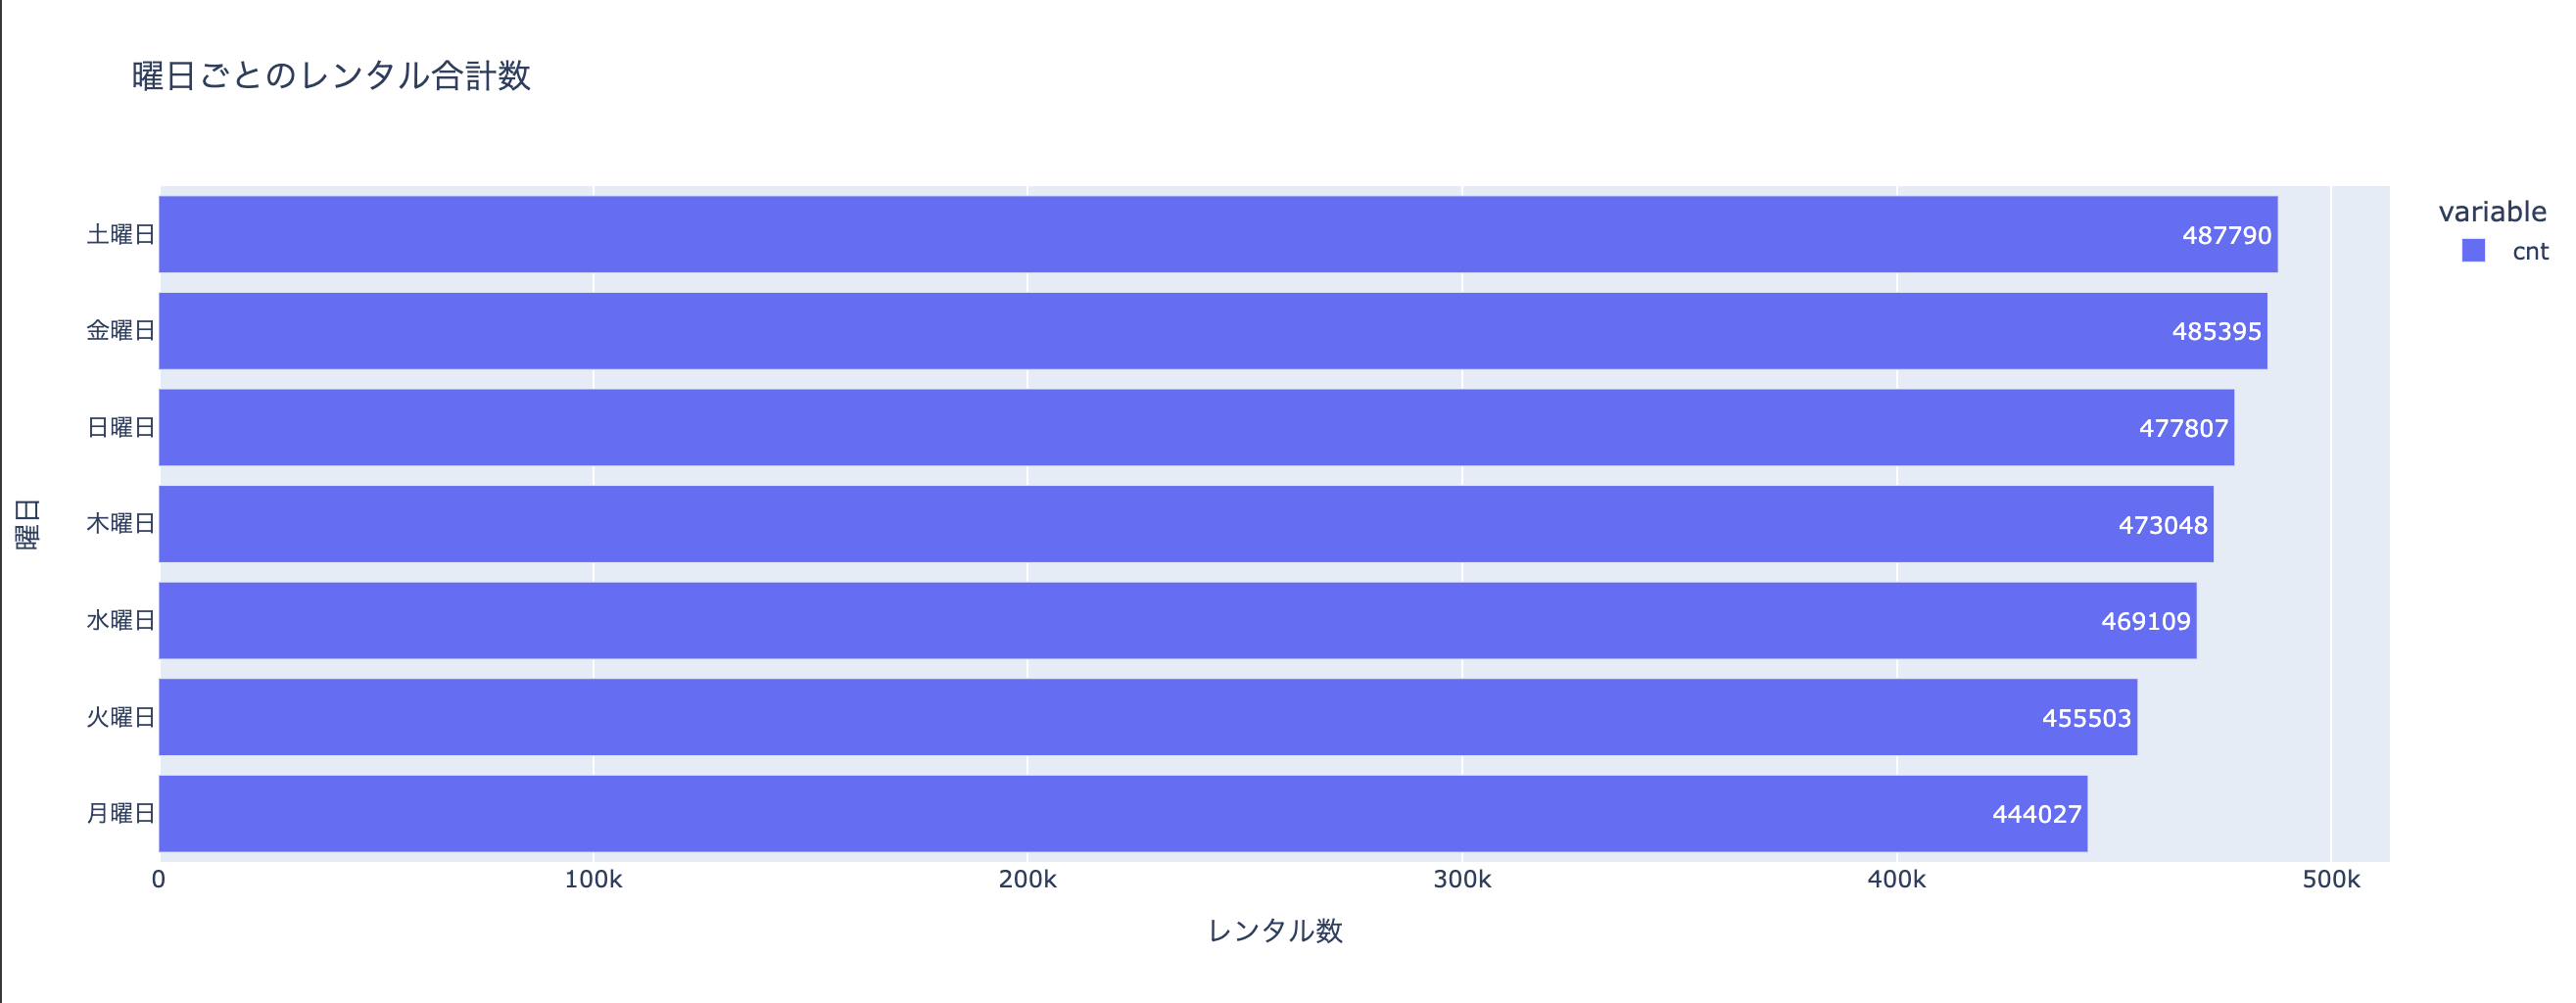
タイトルやラベルを変えたり、値をアノテーションできます
df.groupby("weekday").cnt.sum().sort_values().plot.barh(
    title="曜日ごとのレンタル合計数",
    labels={"value": "レンタル数", "weekday": "曜日"},
    text="value")
さいごに
他のチャートも次第随時更新していきたいと思います。
「こういう書き方あるよ!」「こういうグラフもあるよ!」などアドバイス頂けるととても嬉しいです!!
見ていただきありがとうございました!

