ディープラーニングで日経平均株価を予測#
この記事は、ディープラーニングの勉強の一環です。
間違いなどはご指摘頂ければ幸いです。
今回は、RNN との比較のため、まずはニューラルネットワークで予測をしました。
日経平均株価を選んだのは、特に理由はありません。
今回のソースファイルはこちら
※この記事を参考にした取引によって発生した損害、またはトラブルについては、一切の責任を負いかねます。
環境##
- Windows 7 Proffessional 64bit
- Python 3.6.7 (anaconda)
- TensorFlow 1.12.0
- Keras 2.2.4
データのダウンロード##
以下のサイトより日経平均株価の日時データをダウンロード
日経平均プロフィル ダウンロードセンター
データの確認##
データの取り込み###
import numpy as np
import pandas as pd
import matplotlib.pyplot as plt

data_file = 'nikkei_stock_average_daily_jp.csv'
df = pd.read_csv(data_file, index_col=0, encoding='cp932')

## 最終行はデータではないため削除
df = df[:-1]

## 終値
closing_price = df['終値'].values
欠損値の確認###
print('欠損値の個数')
print(df.isnull().sum(), '\n')
実行結果 欠損値なし
欠損値の個数
終値    0
始値    0
高値    0
安値    0
dtype: int64
基本統計量の確認(終値)###
print('終値の基本統計量')
print(df['終値'].describe(), '\n')
実行結果
終値の基本統計量
count      843.000000
mean     19990.357865
std       2341.431256
min      14952.020000
25%      17862.420000
50%      20163.800000
75%      22011.195000
max      24270.620000
Name: 終値, dtype: float64
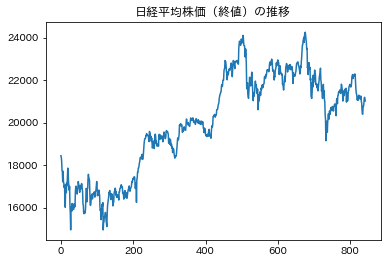
終値を時系列にプロット###
plt.title('日経平均株価(終値)の推移')
plt.plot(range(len(closing_price)), closing_price)
plt.show()
訓練・検証・テスト用データを作成##
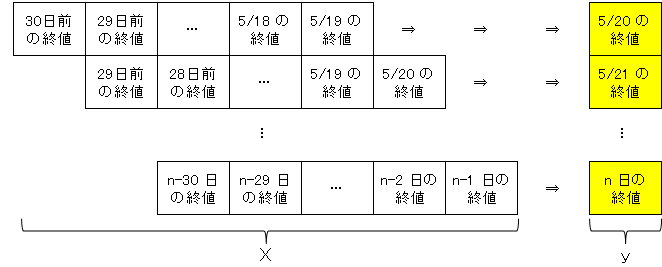
各データを以下のように設定
- 過去300~61日分を訓練用データ
- 過去60~31日分を検証用データ
- 過去30~0日分をテスト用データ
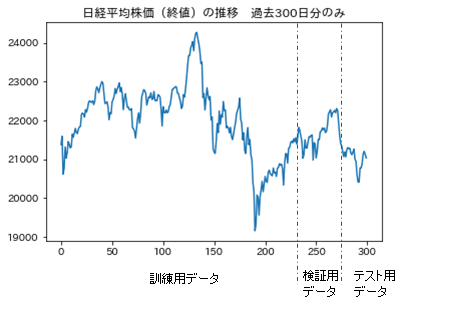
また、各データは過去30日分の株価を説明変数(X)、当日の株価を目的変数(y)とする。
訓練##
今回は入力層・隠れ層1つ・出力層の3層のニューラルネットワークとしています。
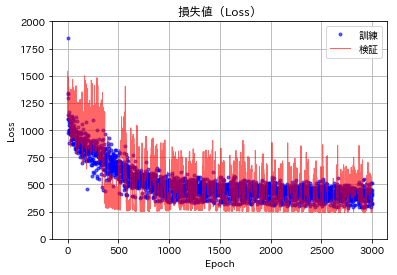
損失関数は mae、エポック数は 3,000 としています。
from keras.models import Sequential
from keras.layers import Dense
from keras.optimizers import RMSprop

model = Sequential()
model.add(Dense(32, activation='relu', input_shape=(X_train.shape[-1],)))
model.add(Dense(16, activation='relu'))
model.add(Dense(1))

model.compile(optimizer=RMSprop(), loss='mae', metrics=['accuracy'])

result = model.fit(X_train, y_train,
                   verbose=0,
                   epochs=3000,
                   batch_size=64,
                   shuffle=True,
                   validation_data=(X_valid, y_valid))
訓練結果(損失値)##
予測(テスト)結果##
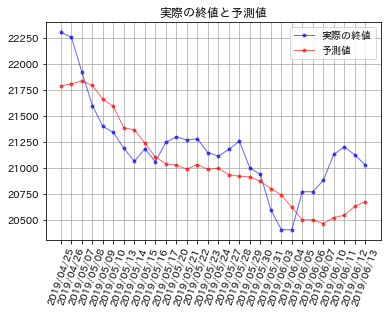
直近30日を予測(テスト用データを予測)した結果です。
二乗平均平方根誤差(RMSE)は 313.059
まあまあ良い精度が出ました。
