目的
CSVファイルの緯度・経度をもとに、対象範囲のデータ抽出及びメッシュコードの付加を行うスクリプトを作成しました。
前提条件
- Windows10
- Python3がインストール済みであること。
- pandas、jismesh等の各種ライブラリーがインストール済みであること。
- jismeshは、緯度経度からメッシュコードを求めることができるPythonのライブラリーになります。
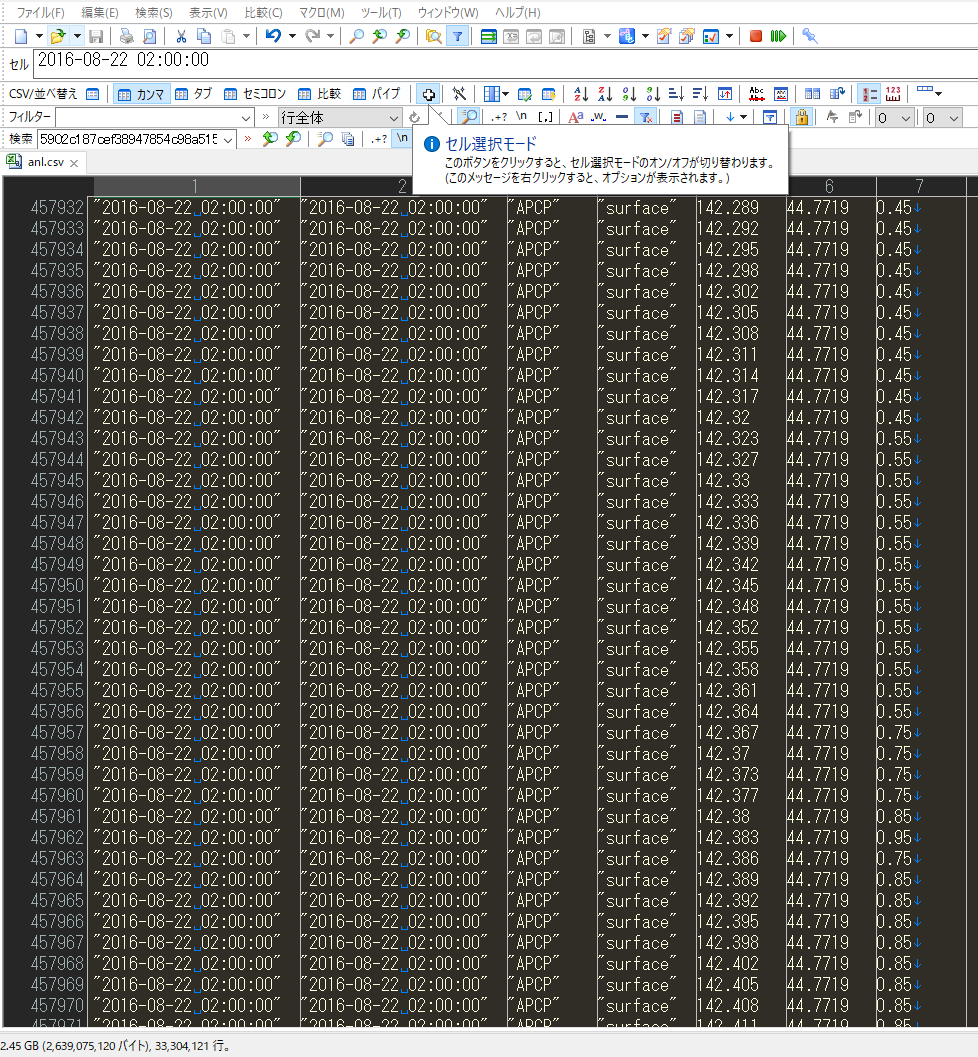
- 入力するcsvファイルは、下記の記事で出力した高解像度ナウキャストデータ(csvファイル)を使用しています。
【備忘録】grib2形式のデータをcsvファイルに変換するスクリプトを作成しました
実行
- 入力フォルダ(csvファイルは複数存在する想定)及び出力CSVファイルを指定してください。
- データを抽出する対象範囲を緯度、経度で指定してください(y1、y2、x1、x2)。
- 本記事では、関東圏を対象範囲としています。
- Pythonスクリプトを実行してください。
highres_nowcast_add_meshcode.py
# -*- coding: utf-8 -*-
import os
import glob
import csv
import pandas as pd
import pprint
import calendar
import jismesh.utils as ju

# 出力ファイルの指定
output_csvfile = "./out/highres_nowcast_anl_kanto.csv"

# 対象範囲の設定
y1 = 37.29166666666667
y2 = 34.04166666666667
x1 = 140.9375
x2 = 137.0625

# 出力ファイルオープン
with open(output_csvfile, 'a', encoding='utf-8', newline="") as f:

    # フォルダ内の全csvファイルのパスを取得
    All_Files = glob.glob('./data/*.csv')
    pprint.pprint (All_Files)

    # csvファイル数分ループ処理
    for file in All_Files:
        # データをリストに格納
        df = pd.read_csv(file, header=None, encoding='utf-8')
        print(u'データフレームに格納処理終了')

        #カラム名を付ける
        df.columns = ["time_s_utc","time_f_utc","sign","surface","lon","lat","rain"]

        print("---データ抽出前---")

        # 最初の5個の値を表示する
        print(df.head(5))

        # 各列のdtypeを見る
        print(df.dtypes)

        # 行と列の個数をとる
        print(df.shape)

        # 対象範囲のデータを抽出
        df_kt = df[(df["lon"]>x2) & (df["lon"]<x1) & (df["lat"]>y2) & (df["lat"]<y1)]

        # 5次メッシュコード追加
        df_kt['meshcode'] = ju.to_meshcode(df_kt.lat, df_kt.lon, 5)

        print("---データ抽出後---")

        # 最初の5個の値を表示する
        print(df_kt.head(5))

        # 各列のdtypeを見る
        print(df_kt.dtypes)

        # 行と列の個数をとる
        print(df_kt.shape)

        # 出力CSVファイルに書き込む
        df_kt.to_csv(f, index=False)

    print(u'処理終了')
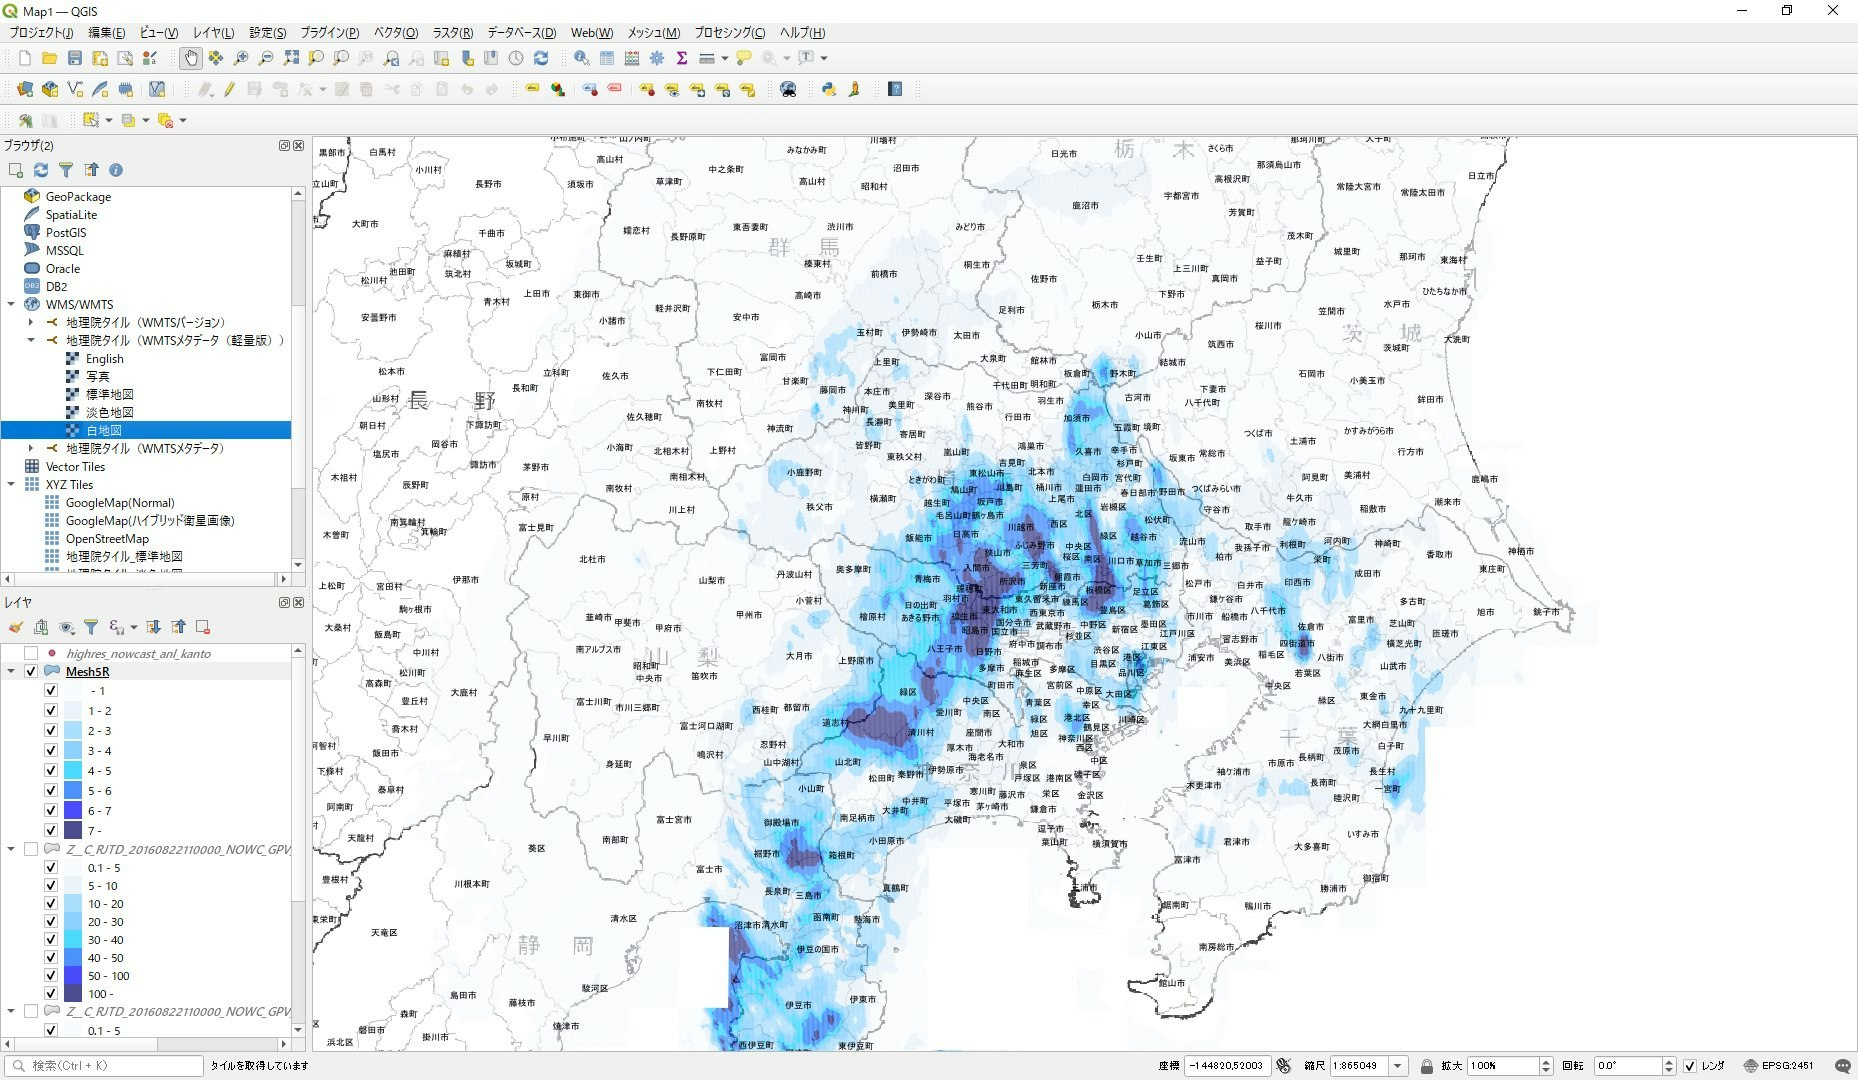
出力結果の図化
出力したcsvファイル(5次メッシュごとの5分間降水量)と5次メッシュのシェープファイルをもとに、QGISで図化します。

