Init pprof
main.go
package main

import (
	"net/http"
	_ "net/http/pprof" <------------------Add this.
)

func main() {
    if err := http.ListenAndServe(":8899", nil); err != nil {
        log.Fatal(err)
    }
}
Surf web browser
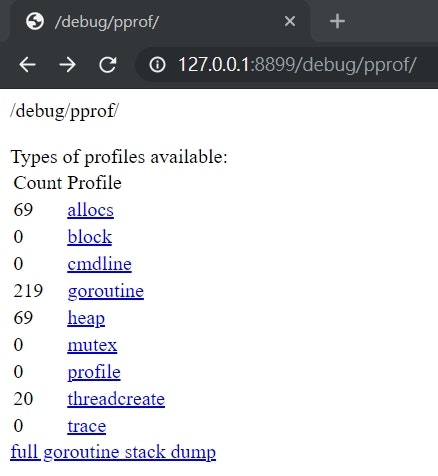
Profile Descriptions:
- allocs: A sampling of all past memory allocations
- block: Stack traces that led to blocking on synchronization primitives
- cmdline: The command line invocation of the current program
- goroutine: Stack traces of all current goroutines
- heap: A sampling of memory allocations of live objects. You can specify the gc GET parameter to run GC before taking the heap sample.
- mutex: Stack traces of holders of contended mutexes
- profile: CPU profile. You can specify the duration in the seconds GET parameter. After you get the profile file, use the go tool pprof command to investigate the profile.
- threadcreate: Stack traces that led to the creation of new OS threads
- trace: A trace of execution of the current program. You can specify the duration in the seconds GET parameter. After you get the trace file, use the go tool trace command to investigate the trace.