はじめに
センサーデータの異常検知についてEDA+教師あり学習してみました。
データについて
油圧テストに関するマルチセンサーデータです。
センサーデータは以下で、全部で2205インスタンスあります。
- Pressure sensors (PS1-6): 100 Hz, 6000 attributes per sensor (6 sensors)
- Motor power sensor (EPS1): 100 Hz, 6000 attributes per sensor (1 sensor)
- Volume flow sensors (FS1/2): 10 Hz, 600 attributes per sensor (2 sensors)
- Temperature sensors (TS1-4): 1 Hz, 60 attributes per sensor (4 sensors)
- Vibration sensor (VS1): 1 Hz, 60 attributes per sensor (1 sensor)
- Efficiency factor (SE): 1 Hz, 60 attributes per sensor (1 sensor)
- Virtual cooling efficiency sensor (CE): 1 Hz, 60 attributes per sensor (1 sensor)
- Virtual cooling power sensor (CP): 1 Hz, 60 attributes per sensor (1 sensor)
油圧システムの状態については以下です。
- Cooler condition / %: 3: close to total failure (732 instances) 20: reduced effifiency (732 instances) 100: full efficiency (741 instances)
- Valve condition / %: 100: optimal switching behavior (1125 instances) 90: small lag (360 instances) 80: severe lag (360 instances) 73: close to total failure (360 instances)
- Internal pump leakage: 0: no leakage (1221 instances) 1: weak leakage (492 instances) 2: severe leakage (492 instances)
- Hydraulic accumulator / bar: 130: optimal pressure (599 instances) 115: slightly reduced pressure (399 instances) 100: severely reduced pressure (399 instances) 90: close to total failure (808 instances)
- stable flag: 0: conditions were stable (1449 instances) 1: static conditions might not have been reached yet (756 instances)
今回はcooler conditionとstable flagについて異常検知モデルを構築していきます。
cooler conditionとstable flagについて正常及び異常データの数に大きな差はなく、通常の二値分類モデルで正常と異常を分類していけそうです。
準備
まずライブラリをインポートしておきます。
import pandas as pd
import numpy as np
import glob
import matplotlib.pyplot as plt
from sklearn.preprocessing import MinMaxScaler
from sklearn.model_selection import train_test_split
from sklearn.metrics import accuracy_score
from keras.models import Sequential
from keras.layers import LSTM, Dense, Dropout
EDA
センサーデータ及び油圧システムの状態のデータを読み込み、可視化します。
データの読み込み
こちらからデータをダウンロードし、ダウンロードディレクトリで以下を実行します。
file_list = [v for v in glob.glob('*.txt') if len(v) < 8]
data_dict = {}
for file in file_list:
    data = file_read(file)
    file_name = file.split('/')[-1]
    file_ = file_name.split('.')[0]
    print(file_, data.shape)
    data_dict[file_] =  data
ans_df = pd.read_table('profile.txt' , names=TARGET_NAMES)
上記のprint(file_, data.shape)の出力結果は以下のようになり、各センサーデータでデータの形状が異なることがわかります。これはセンサーの周波数によって違いが出ています。
SE (2205, 60)
FS1 (2205, 600)
CP (2205, 60)
PS3 (2205, 6000)
PS6 (2205, 6000)
TS2 (2205, 60)
PS1 (2205, 6000)
PS4 (2205, 6000)
TS1 (2205, 60)
VS1 (2205, 60)
FS2 (2205, 600)
PS2 (2205, 6000)
TS4 (2205, 60)
PS5 (2205, 6000)
CE (2205, 60)
TS3 (2205, 60)
可視化
次にセンサーデータを可視化します。
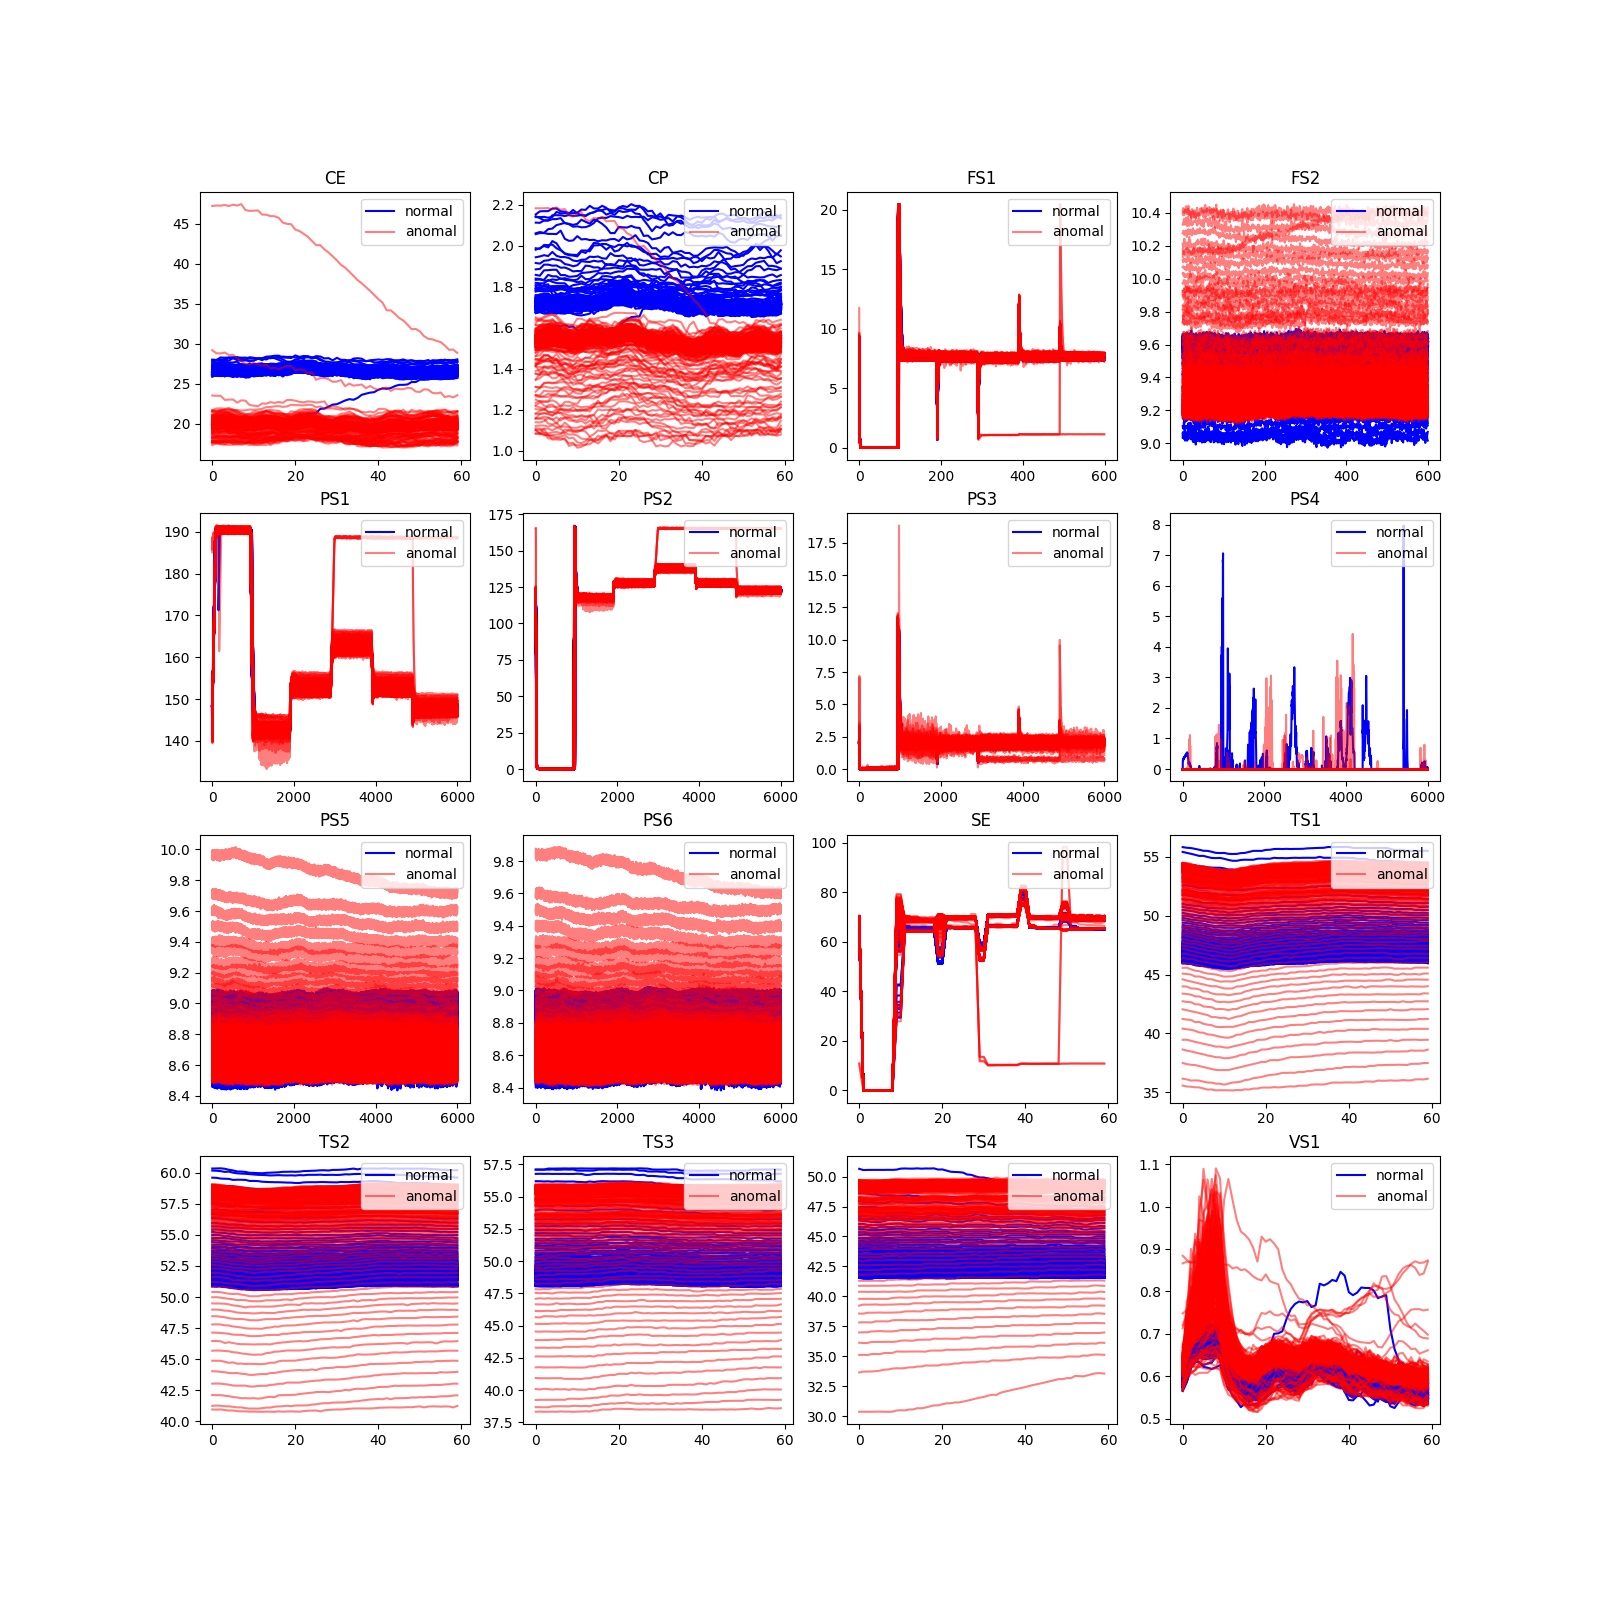
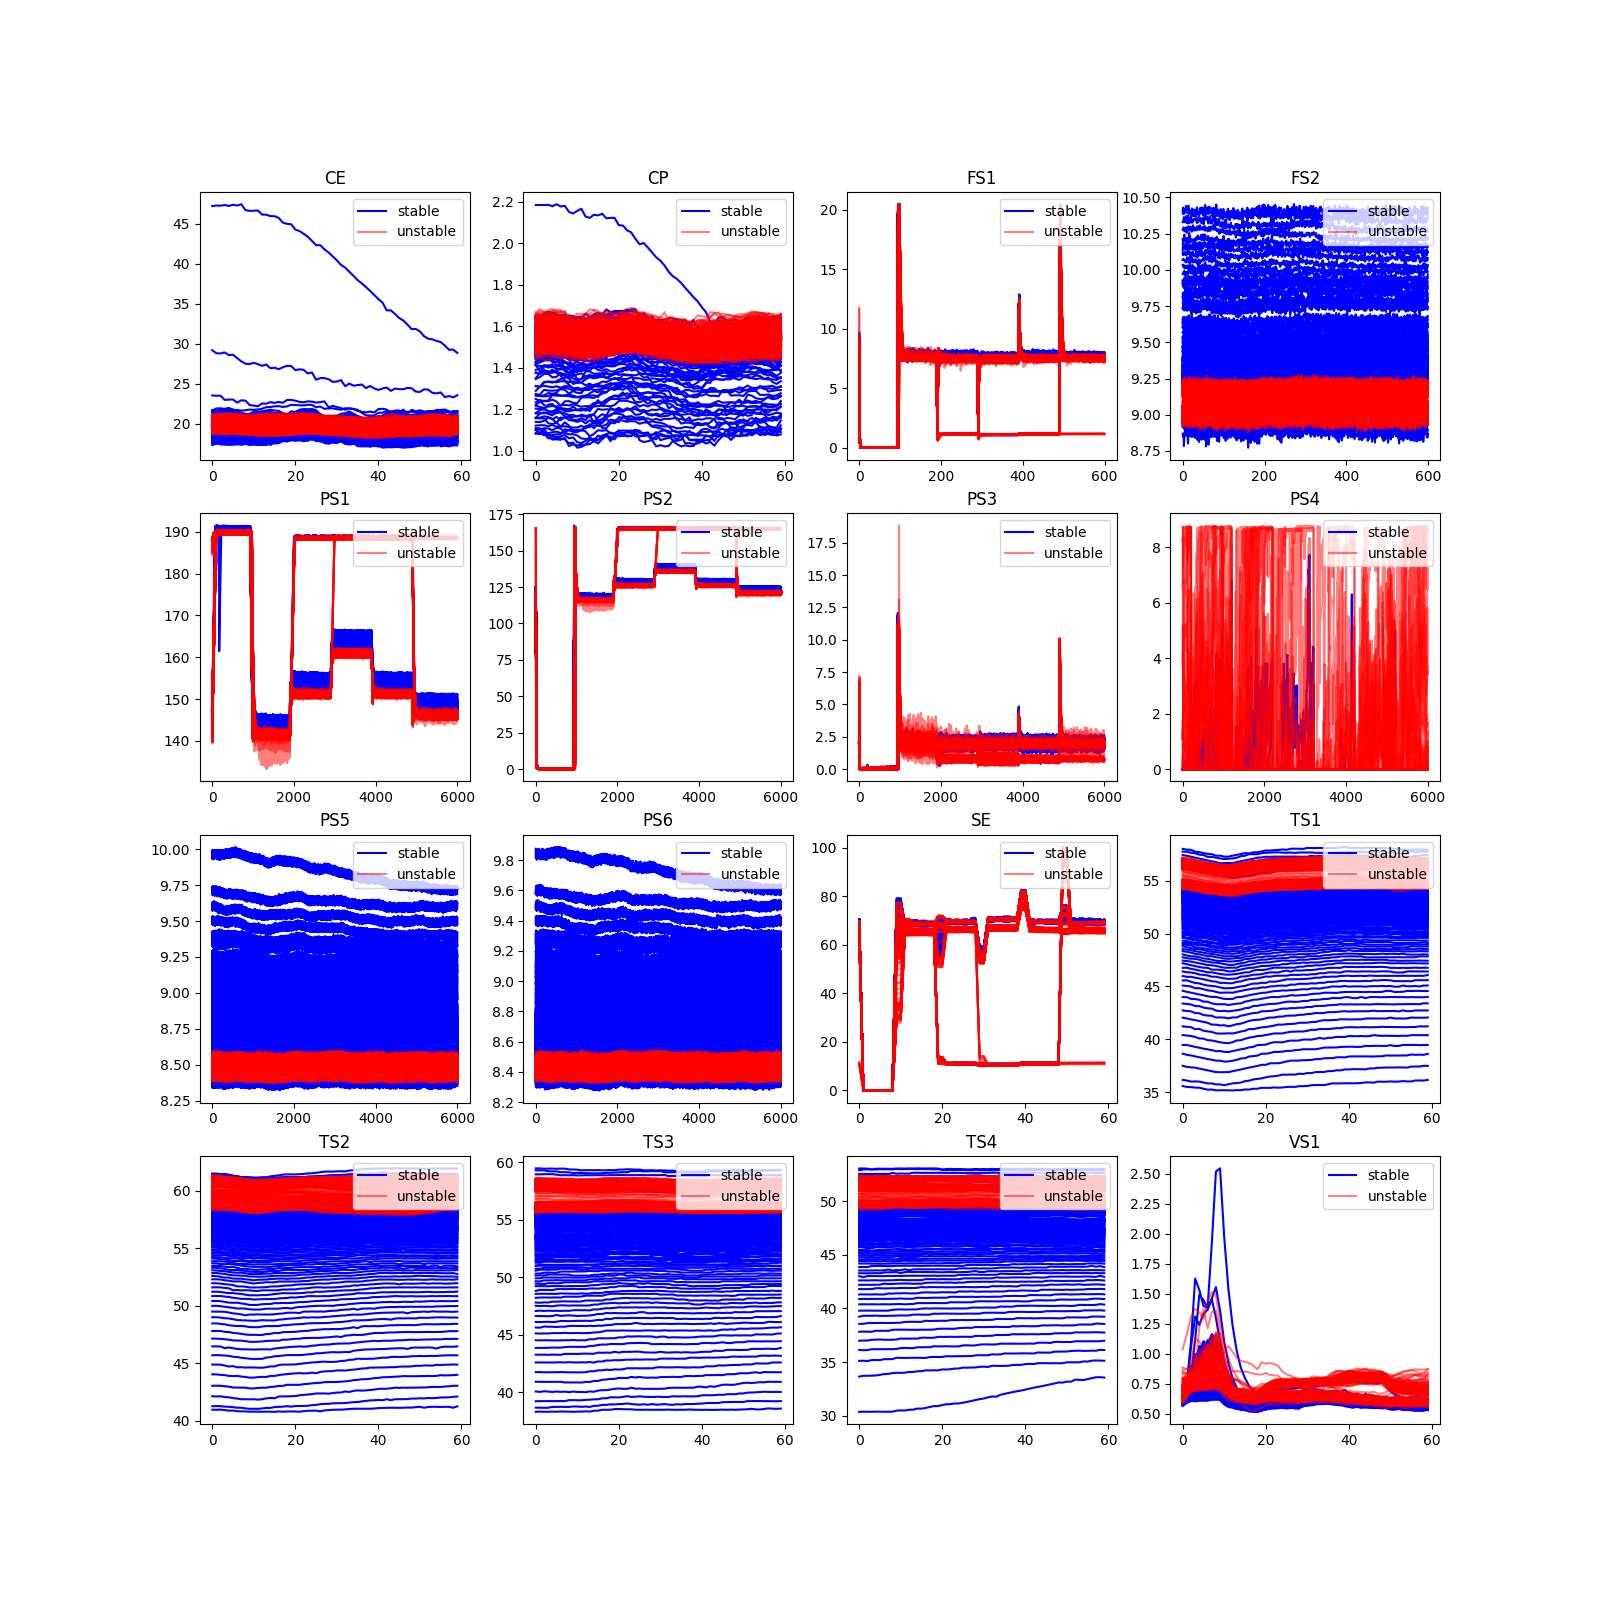
今回はcooler conditionとstable flagに注目しているので、それぞれ分けて可視化します。
- coolerについて
anomal = np.where(ans_df['cooler'].values == 3)[0]
normal = np.where(ans_df['cooler'].values != 3)[0]

num = 250
plt.figure(figsize = (16,16))
for i,key in enumerate(data_dict.keys()):
    plt.subplot(4,4,i+1)
    plt.title(f'{key}')
    for v in normal[:num-1]:
        plt.plot(data_dict[key][v], color='blue')
    plt.plot(data_dict[key][normal[num]], label='normal', color='blue')
    for v in anomal[:num]:
        plt.plot(data_dict[key][v], color = 'red', alpha=0.5)
    plt.plot(data_dict[key][anomal[num]], label='anomal', color ='red', alpha=0.5)
    plt.legend(loc='upper right')
可視化結果は以下です。
- stableについて
unstables = np.where(ans_df['stable'].values == 0)[0]
stables = np.where(ans_df['stable'].values == 1)[0]

num = 250
plt.figure(figsize = (16,16))
for i,key in enumerate(data_dict.keys()):

    plt.subplot(4,4,i+1)
    plt.title(f'{key}')
    for v in stables[:num-1]:
        plt.plot(data_dict[key][v], color='blue')
    plt.plot(data_dict[key][stables[num]], label='stable', color='blue')
    for v in unstables[:num]:
        plt.plot(data_dict[key][v], color = 'red', alpha=0.5)
    plt.plot(data_dict[key][unstables[num]], label='unstable', color ='red', alpha=0.5)
    plt.legend(loc='upper right')
可視化結果は以下です。
可視化結果より、すべてセンサーデータの結果が目的変数と関係していそうです。
またタイムポイント固有のピークが時間固有のタイミングで確認できるので、時系列データをそのまま使いたいです。特徴量を抽出することも可能ですが、記述量が増えるので機械学習モデルによる特徴を抽出を期待します。
今回は以下の異常検知システムを考えます。
入力: 時系列データ(X,60) #もっとも低次元に合わせる
モデル: 時系列データが入力可能な機械学習モデル
出力: 0,1のラベル
具体的な方針は以下です。
- 入力データの整形
入力データを(16,2250,60)に変換
正規化と平滑化(16,2250,61-window_size) - データ分割
- モデル構築
- 学習
- 予測
前処理
入力データの整形とデータの分割を行います。 整形、平滑化、正規化は以下の関数で行います。整形では計算時間削減のため、センサーデータは周波数が小さいものに合わせます。
def create_time_data(data_dict, window_size=1):
    """
    1. 整形
    2. 平滑化
    3. 正規化
    """
    x = None

    for key in data_dict:
        v = data_dict[key]
        if v.shape[1] == 6000:
            v = v[:,::100]
        elif v.shape[1] == 600:
            v = v[:,::10]
        assert v.shape[1] == 60

        # 平滑化
        v = np.apply_along_axis(lambda x: np.convolve(x, np.ones(window_size)/window_size, mode='valid'), axis=1, arr=v)
        scaler = MinMaxScaler()
        # 正規化
        v = scaler.fit_transform(v)

        if x is None:
            x = v.reshape(1, 2205, 61 - window_size)
        else:
            x = np.concatenate((x, v.reshape(1, 2205, 61 - window_size )))
    x = np.transpose(x,(1,2,0))
    return x
今回はまずcooler conditionについて前処理し、データの分割を行います。
正常を0、異常を1としてラベル化します。
x = create_time_data(data_dict, window_size=5) #前処理
y = np.where(ans_df['cooler'].values == 3, 1, 0) #正常異常
x_train, x_test, y_train, y_test = train_test_split(x, y, test_size=0.2)
本当はバリデーションデータも作成し、クロスバリデーションするべきですが、今回は簡単のため省略しています。
異常検知モデルの作成及び異常検知
時系列データを入力できるLSTMモデルを構築します。
model = Sequential()
model.add(LSTM(64, return_sequences=True, input_shape=(x.shape[1], x.shape[2])))
model.add(Dropout(0.5))
model.add(LSTM(64))
model.add(Dropout(0.5))
model.add(Dense(1, activation='sigmoid'))
model.compile(optimizer='adam', loss='binary_crossentropy', metrics=['accuracy'])
次にモデルを学習し、精度を見てみます。
model.fit(x_train, y_train, epochs=50)
_, train_acc= model.evaluate(x_train,y_train)
_, test_acc= model.evaluate(x_test,y_test)

train_acc, test_acc
# train, test
(0.9988662004470825, 0.997732400894165)
ほぼ精度が100%なので、まずまず良いのではないでしょうか。
またstableについても同様に異常検知を行うと精度は以下のようになります。
# train, test
(0.9251700639724731, 0.9160997867584229)
こちらはまだ改善の余地がありますね。
まとめ、今後やるべきこと
stableに関しては9割以上の精度、cooler conditionについては100%に近い精度で正常/異常の予測ができますした。
これからやるべこととしては、以下が考えられます。
-
入力データ系
-
特徴量の生成
- 既存のライブラリ
tsfreshなどで時系列データの特徴量抽出 -> センサーデータが膨大で時間かかりすぎてお話にならない - 特徴量自作(nishikaの睡眠コンペを参考)
- 基本特徴量(平均、標準偏差、四分位範囲、ゼロ交差数、スペクトル重心、バリアンス、歪度、尖度など)
- Hjorth特徴量
- フラクタル次元特徴量
- エントロピー特徴量
- ピーク間隔特徴量
- 周波数領域
- ビンフーリエエントロピー
- バンドパスフィルタ
- 既存のライブラリ
-
データの追加(削除)
- データのアップサンプリング、ダウンサンプリング
- 周波数
今回はデータを下限(1Hz)に合わせたので、データを増やして実施、
特に鋭いピークを逃してしまう可能性がある。
一方で学習時間が10, 100倍になってしまう+入力が冗長になってしまう恐れもあり - DataAugmentaion
- TimeMasking
- FrequencyMasking
-
-
学習方法の改良
- モデルの改良
- 他手法での実施
-
解釈性
- モデルに解釈性の高いものを追加、採用
- 入力データやモデルの勾配を用いて解釈性の議論を行う
-
他指標の予測や組み合わせ
- 特に今回は異常検知なのでRecallを見るとよさそうですね。
-
教師なしとの比較(暇があれば)
ノートブック

