Mac miniをホームサーバーとして使用しながら、外部からMac miniの状態を確認するためのモニタリング環境を構築してみようと思います。できるだけDockerを使用してサービスを立ち上げることが目標です。
Node exporterのインストール
メトリクス収集のためにNode exporterをインストールします。これもDockerで行えば良いのですが、MacOSのファイルシステムとLinuxのファイルシステム構造が異なるため、正しく値が収集されません。そのため、brewを使用してインストールしました。
brew install node_exporter
brew services start node_exporter
http://localhost:9100/metrics このURLにアクセスすると、現在のメトリクスを確認できます。
Prometheus
node-exporterで見られるメトリクスを収集するために、Prometheusを立ち上げてみましょう。まず、docker-compose.ymlファイルを作成します。
# docker-compose.yml

services:
  prometheus:
    image: prom/prometheus:latest
    container_name: prometheus
    volumes:
      - ./prometheus.yml:/etc/prometheus/prometheus.yml
      - prometheus_data:/prometheus
    command:
      - "--config.file=/etc/prometheus/prometheus.yml"
      - "--storage.tsdb.path=/prometheus"
      - "--web.console.libraries=/usr/share/prometheus/console_libraries"
      - "--web.console.templates=/usr/share/prometheus/consoles"
    ports:
      - "9090:9090"

volumes:
  prometheus_data:
そして、Prometheusの設定のためにprometheus.ymlを作成します。
# prometheus.yml

global:
  scrape_interval: 15s

scrape_configs:
  - job_name: "prometheus"
    static_configs:
      - targets: ["localhost:9090"]

  - job_name: "node-exporter"
    static_configs:
      - targets: ["host.docker.internal:9100"]
PrometheusはDockerコンテナ内で実行されているため、localhostではなくhost.docker.internalを通じてMacのlocalhostにアクセスできます。そのため、上記のように記述します。
Grafana
Grafanaを立ち上げるために、先ほど作成したdocker-compose.ymlファイルにGrafanaを追加します。
# docker-compose.yml

services:
  grafana: # 追加
    image: grafana/grafana:latest
    container_name: grafana
    environment:
      - GF_SECURITY_ADMIN_PASSWORD=admin
    ports:
      - "3100:3000"
    volumes:
      - grafana-data:/var/lib/grafana
      - ./grafana.ini:/etc/grafana/grafana.ini

volumes:
  prometheus_data: # 追加
そして、Grafanaの設定ファイルであるgrafana.iniファイルを作成します。私は外部からアクセス可能にするために、次のように記述しました。例として、https://example.com/monitoring/ にアクセスするとGrafanaパネルを見られるように設定しました。
# grafana.ini

[server]
domain = example.com
root_url = %(protocol)s://%(domain)s/monitoring/
serve_from_sub_path = true
Nginx設定
nginx.confファイルを探し、該当するserverブロック内にlocationブロックを追加します。私はNginxとGrafanaが同じDockerネットワーク上で動作しているため、proxy_passのパスをgrafana:3000に設定しましたが、環境に応じてlocalhost:3000やhost.docker.internal:3000などに変更してください。
# nginx.conf

location /monitoring/ {
    proxy_pass http://grafana:3000;
    proxy_set_header X-Real-IP $remote_addr;
    proxy_set_header X-Forwarded-For $proxy_add_x_forwarded_for;
    proxy_set_header Host $host;
}

location /monitoring/api/live/ {
    proxy_pass http://grafana:3000;
    proxy_set_header Host $host;
    proxy_set_header X-Real-IP $remote_addr;
    proxy_set_header X-Forwarded-For $proxy_add_x_forwarded_for;
    proxy_set_header X-Forwarded-Proto $scheme;
    proxy_set_header Upgrade $http_upgrade;
    proxy_set_header Connection "upgrade";
    proxy_http_version 1.1;
}
Grafanaへのアクセス
先ほど作成したdocker-compose.ymlのあるディレクトリでサービスを起動し、Nginxを再起動します。私はNginxが別のコンテナで動作しているため、次のように再起動しました。
docker compose up -d
docker nginx restart
そして、先ほど設定したURLにアクセスしてみます。

最初のIDとパスワードはadmin/adminです。次にログインします。
Grafanaダッシュボードの設定
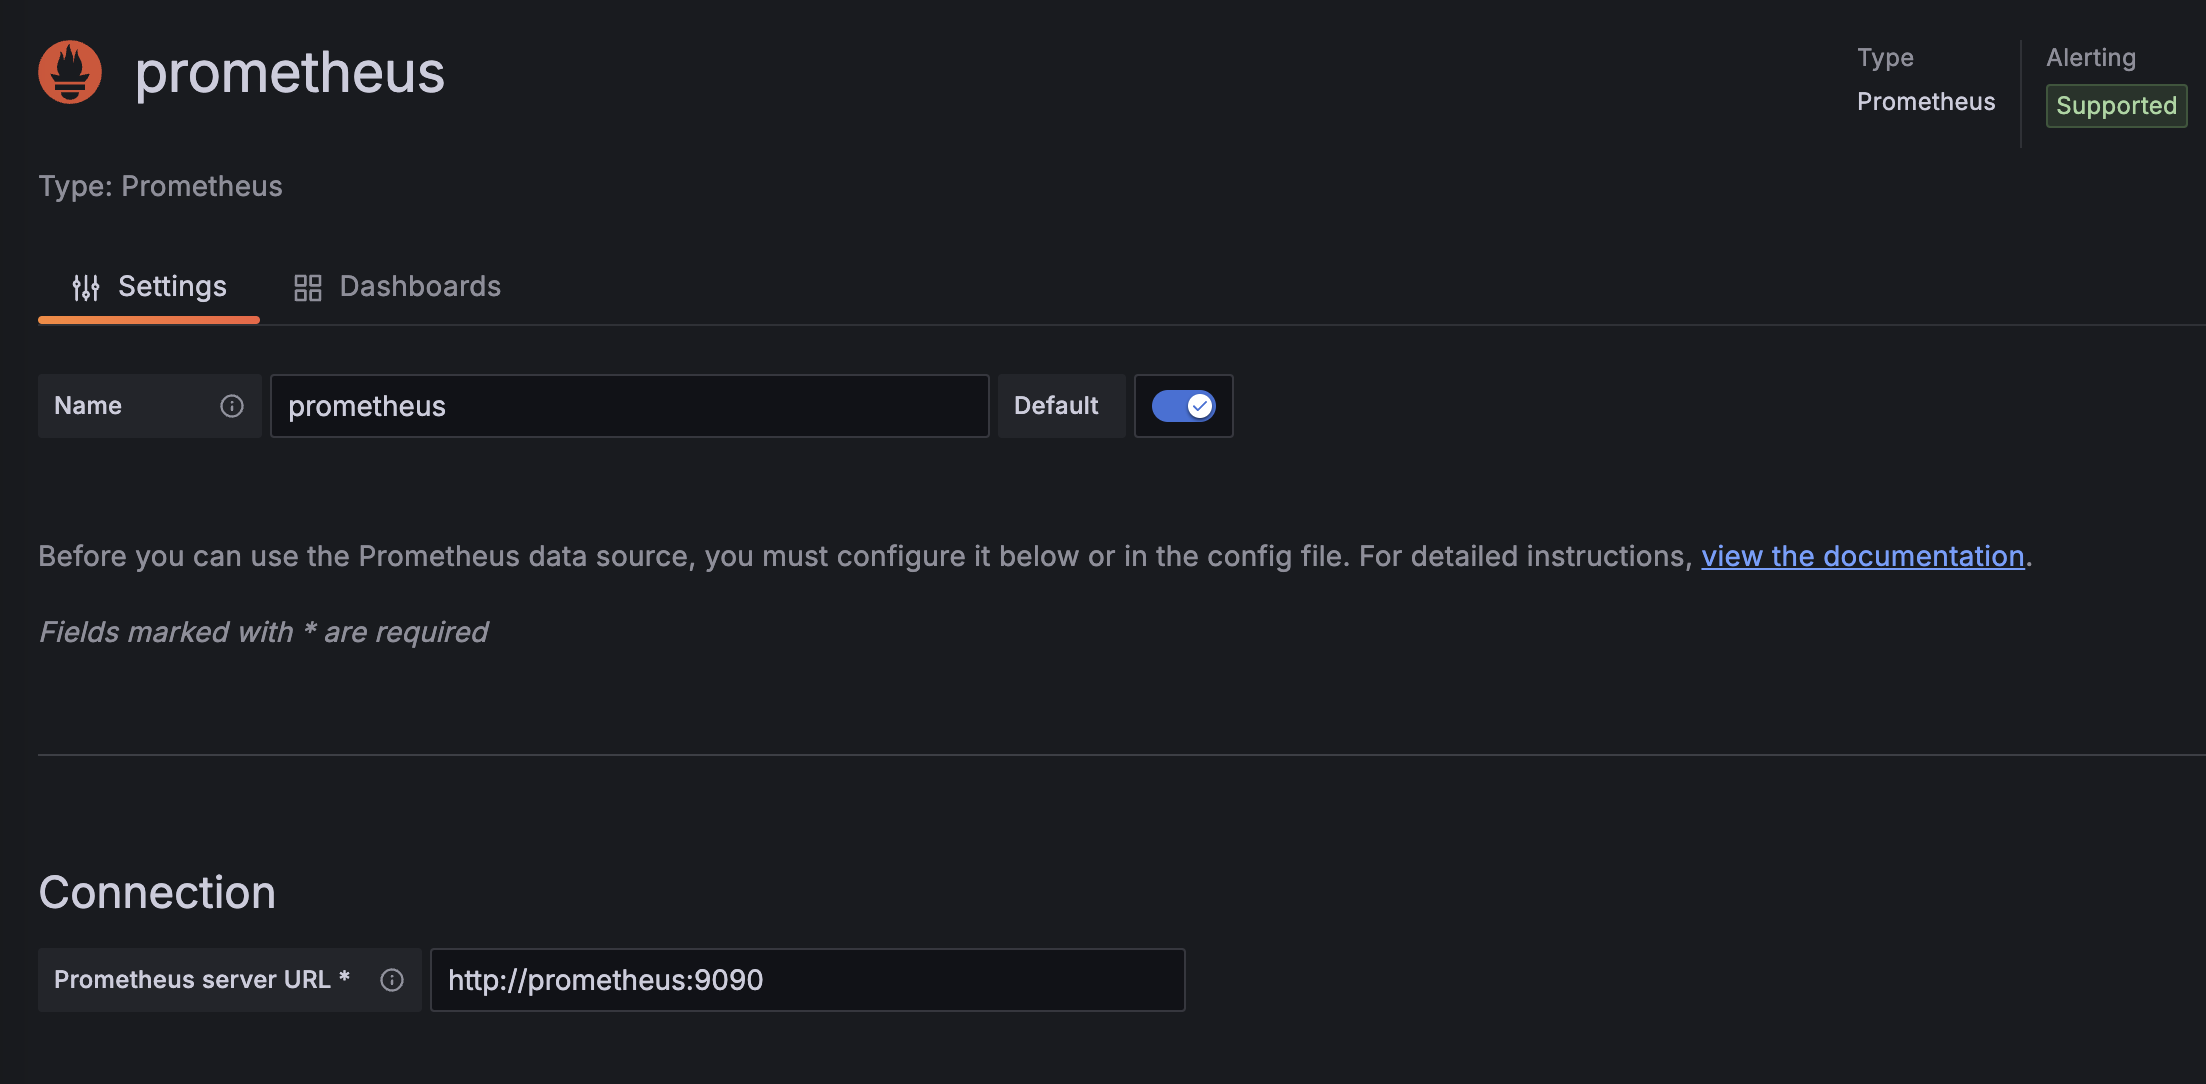
Connection - Data sourceに移動し、Prometheusと連携します。PrometheusとGrafanaは同じDockerネットワーク上にあるため、サービス名でURLを設定します。
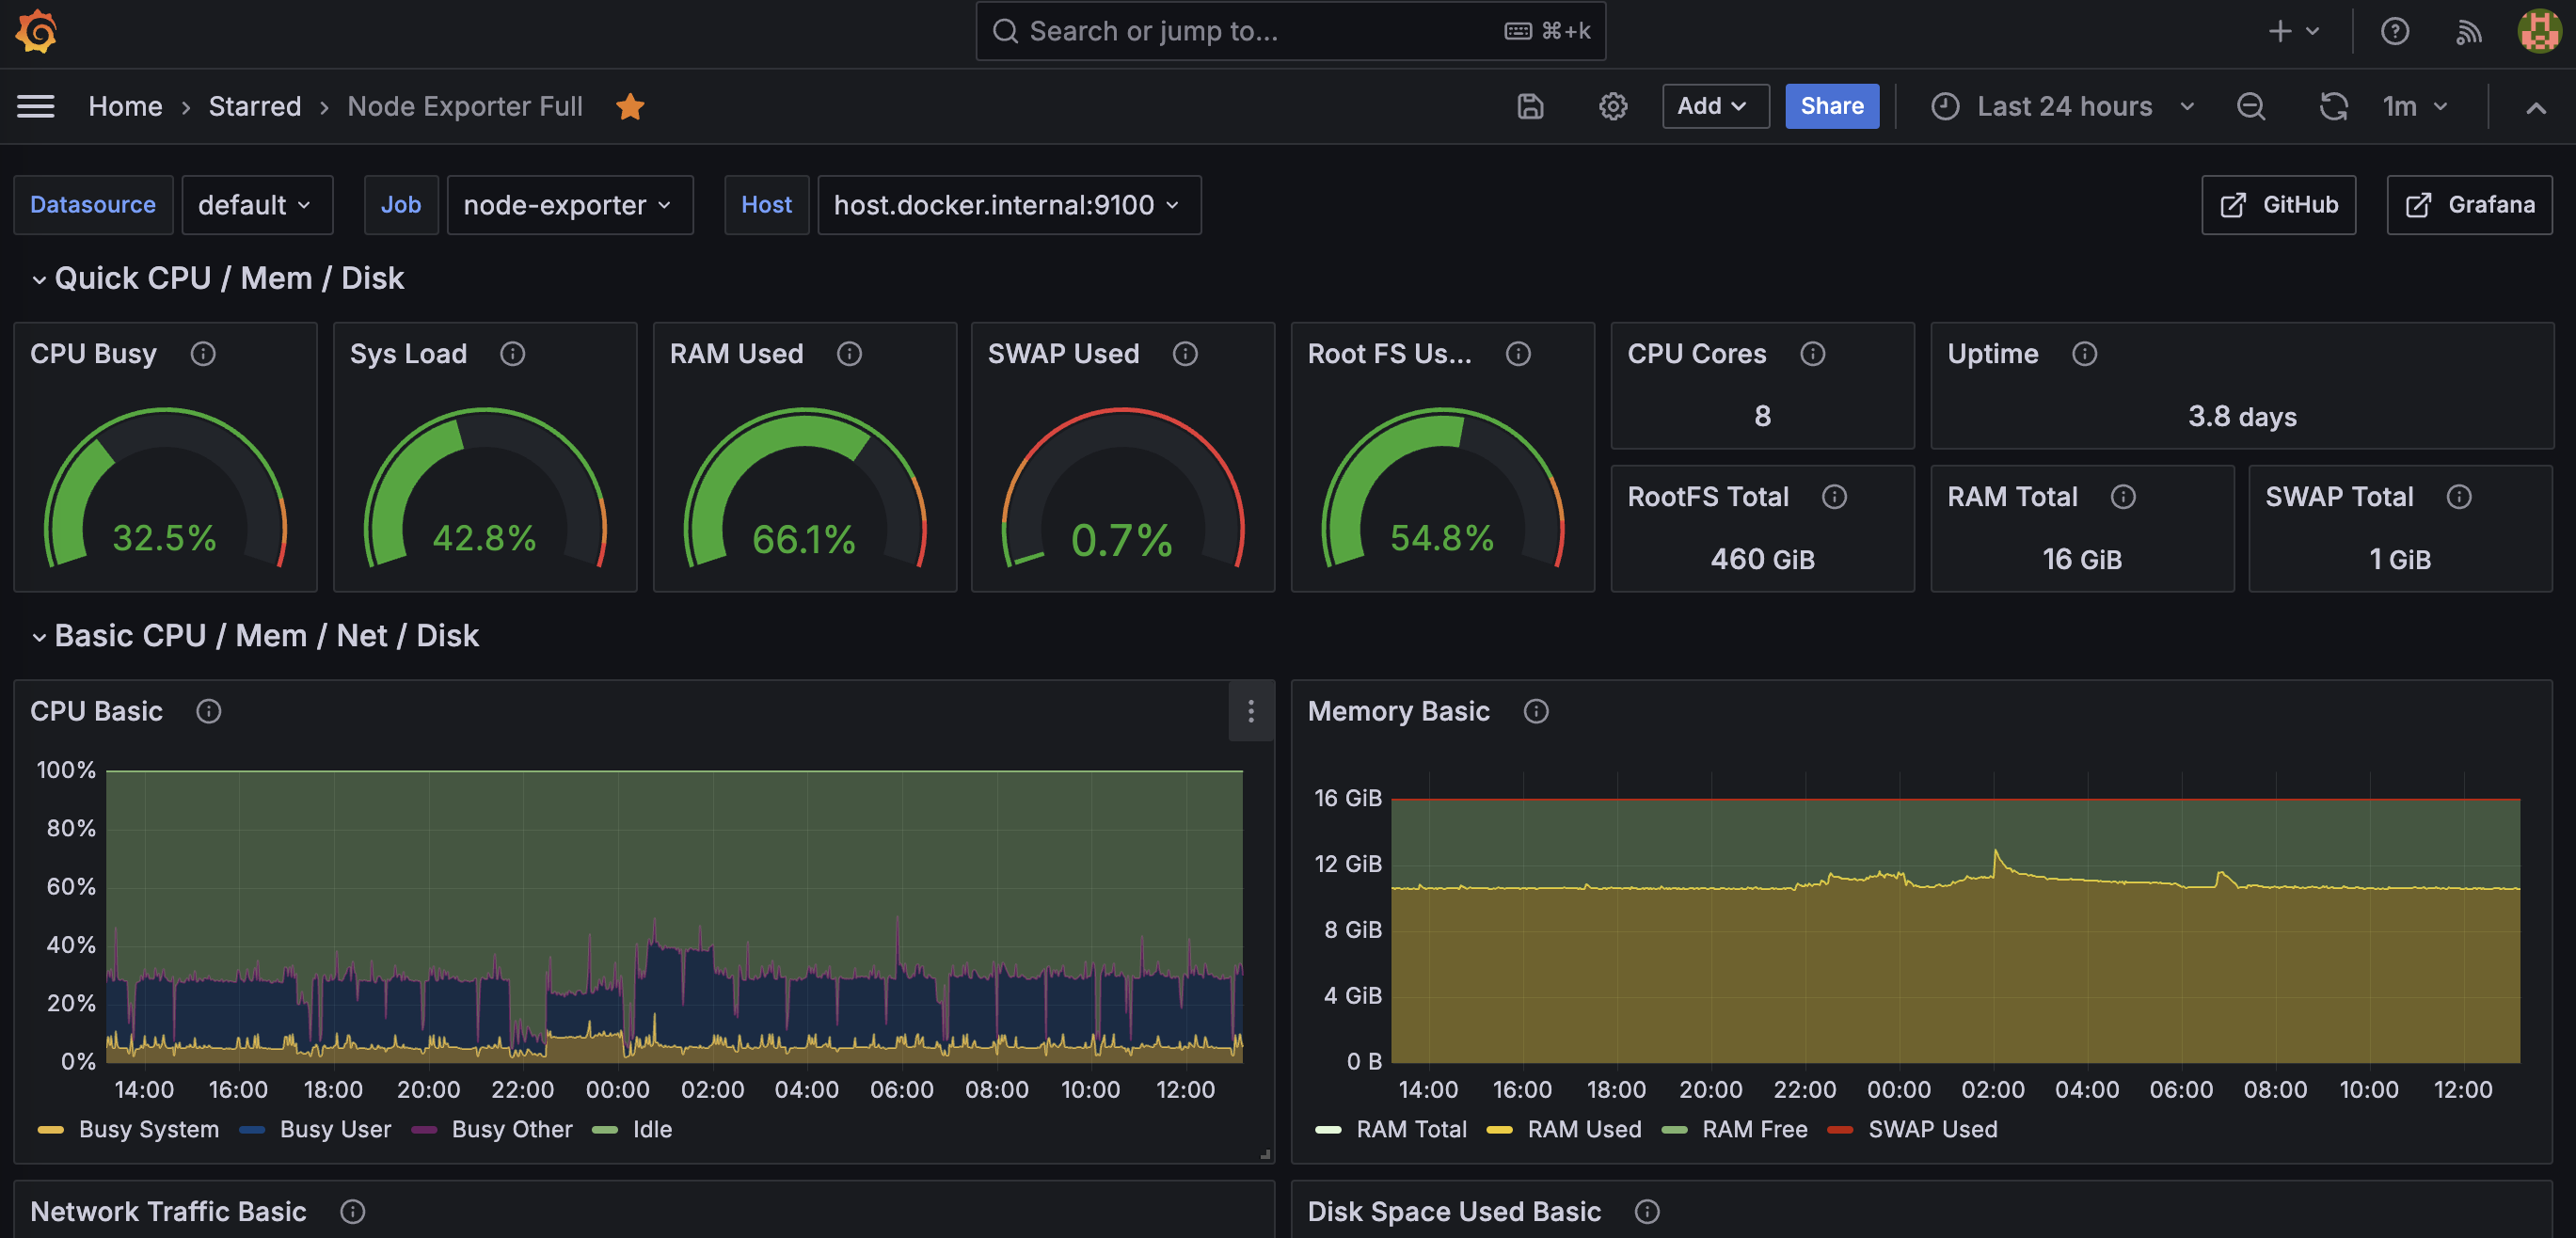
そして、私はGrafanaのホームページで提供されているダッシュボードを使用しました。以下のものを使用しました:
https://grafana.com/grafana/dashboards/1860-node-exporter-full/
これを設定した後、メトリクスの名前が一致しない部分がいくつかあったので、少し修正を加えました。これでMac miniのモニタリング設定を完了しました。