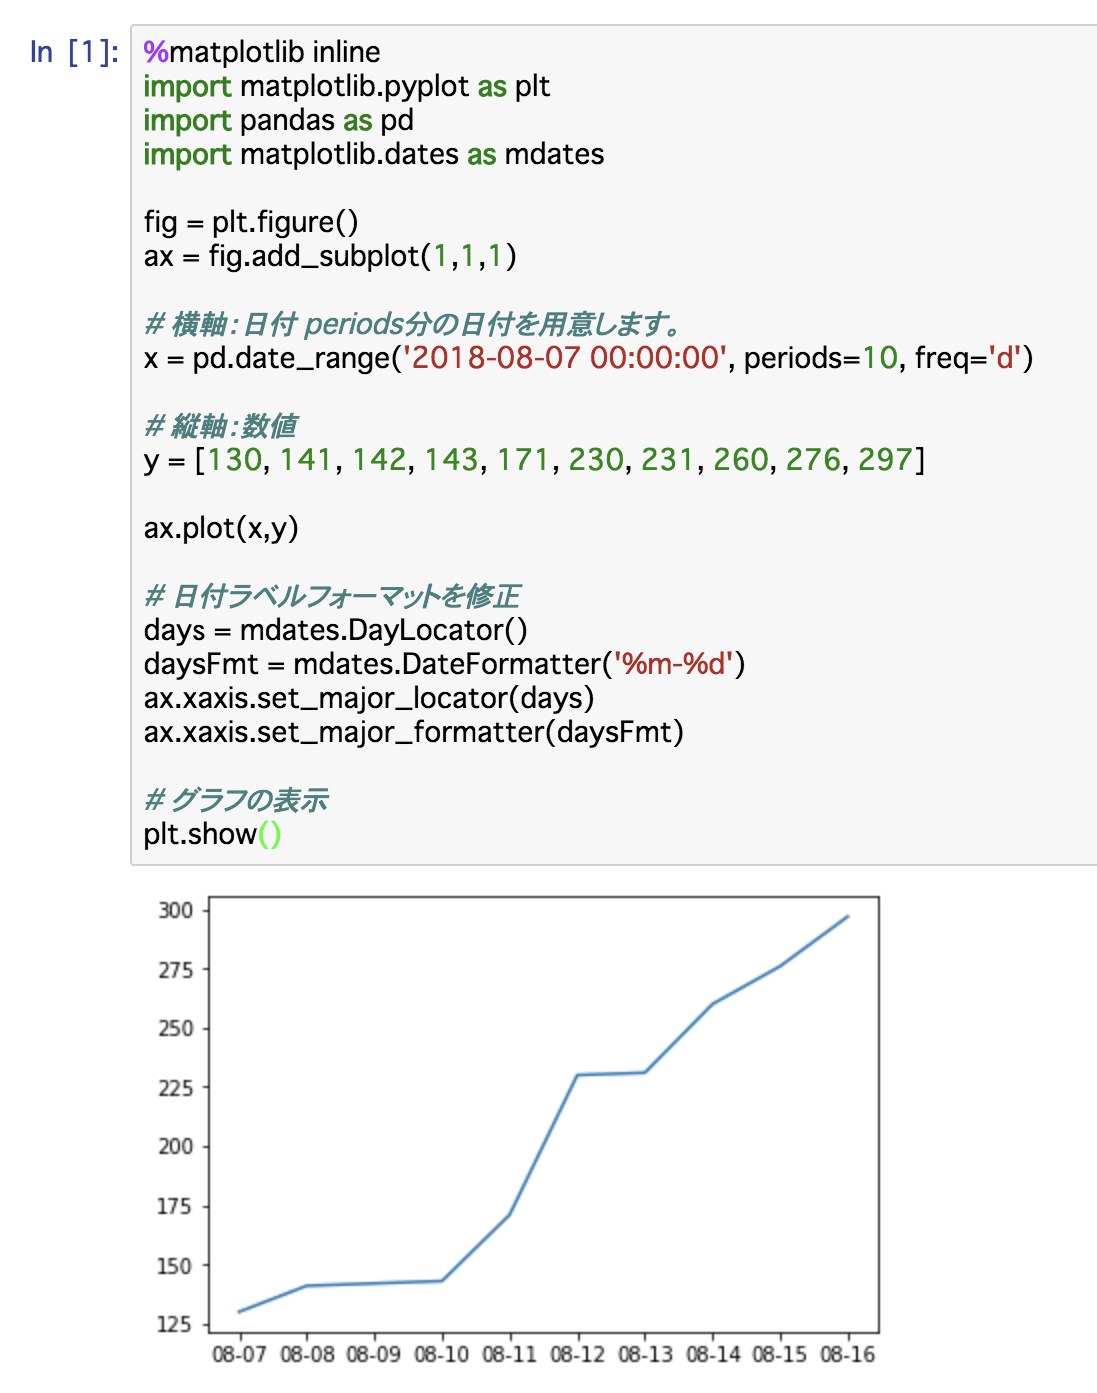
単純な日付データと数値をmatplotlibでplotする方法です。
%matplotlib inline
import matplotlib.pyplot as plt
import pandas as pd
import matplotlib.dates as mdates

fig = plt.figure()
ax = fig.add_subplot(1,1,1)

# 横軸:日付 periods分の日付を用意します。
x = pd.date_range('2018-08-07 00:00:00', periods=10, freq='d')

# 縦軸:数値
y = [130, 141, 142, 143, 171, 230, 231, 260, 276, 297]

ax.plot(x,y)

# 日付ラベルフォーマットを修正
days = mdates.DayLocator()
daysFmt = mdates.DateFormatter('%m-%d')
ax.xaxis.set_major_locator(days)
ax.xaxis.set_major_formatter(daysFmt)

# グラフの表示
plt.show()
グラフを表示することができました。
実装例
参考URL
下記URLを参考にしました。ありがとうございます。
PythonというかMatplotlibでスケールや単位の異なる時系列データを整形して表示する
https://qiita.com/zaburo/items/00f364422ef3fe64f156
[Python][Linux] matplotlib で時系列のグラフを書いてみた!
http://d.hatena.ne.jp/knaka20blue/20101117/1289981182