LoginSignup
1
7

More than 5 years have passed since last update.

[Pythonによる科学・技術計算] 極座標グラフ,可視化,matplotlib

Posted at

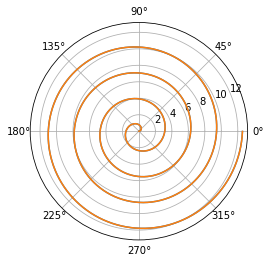
matplotlib.pyplotのpolarメソッドを指定して極座標グラフを描く。
例としてr = 0.5 θ(アルキメデスの渦巻線)を考える。

import numpy as np
import matplotlib.pyplot as plt
"""
極方程式
例:アルキメデスの渦巻線
"""

theta = np.arange(0.0, 4*2*np.pi, 0.01) #θの範囲を 0-8π ラジアン(4周分)とする
r = 0.5*theta   ## 極方程式を指定する。
plt.polar(theta,r) # 極座標グラフのプロット

plt.show()

結果

t.png

1
7
0

Register as a new user and use Qiita more conveniently

  1. You get articles that match your needs
  2. You can efficiently read back useful information
  3. You can use dark theme
What you can do with signing up
1
7