はじめに
matplotlibを用いて3次元曲面で表現できる関数 $z = e^{-(x^2+y^2)}$をプロットする。
plot_surfaceやplot_wireframeを使う。
コード
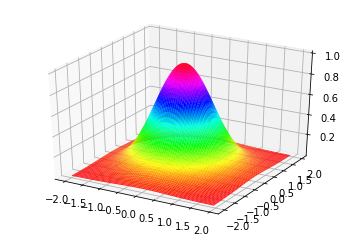
(1) surface plot
"""
3次元曲面のプロット例
z=exp(-(x^2+y^2))
"""
from mpl_toolkits.mplot3d import Axes3D
import matplotlib.pyplot as plt
import numpy as np

fig = plt.figure() #プロット領域の作成
ax = fig.gca(projection='3d') #プロット中の軸の取得。gca は"Get Current Axes" の略。

x = np.arange(-2, 2, 0.05) # x点として[-2, 2]まで0.05刻みでサンプル
y = np.arange(-2, 2, 0.05)  # y点として[-2, 2]まで0.05刻みでサンプル
x, y = np.meshgrid(x, y)  # 上述のサンプリング点(x,y)を使ったメッシュ生成

z = np.exp(-(x**2 + y**2))  #exp(-(x^2+y^2))  を計算してzz座標へ格納する。

ax.plot_surface(x, y, z, rstride=1, cstride=1, cmap='hsv', linewidth=0.3) # 曲面のプロット。rstrideとcstrideはステップサイズ,cmapは彩色,linewidthは曲面のメッシュの線の太さ,をそれぞれ表す。

plt.show() # 絵の出力。
結果(1)
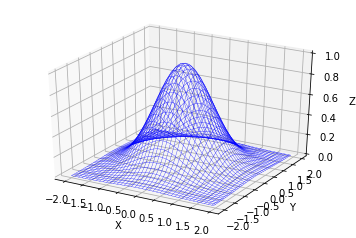
(2) ワイヤーフレーム表示
from mpl_toolkits.mplot3d import Axes3D
import matplotlib.pyplot as plt
import numpy as np

fig = plt.figure() #プロット領域の作成
ax = fig.gca(projection='3d') #プロット中の軸の取得。gca は"Get Current Axes" の略。

x = np.arange(-2, 2, 0.05) # x点として[-2, 2]まで0.05刻みでサンプル
y = np.arange(-2, 2, 0.05)  # y点として[-2, 2]まで0.05刻みでサンプル
x, y = np.meshgrid(x, y)  # 上述のサンプリング点(x,y)を使ったメッシュ生成

z = np.exp(-(x**2 + y**2))  #exp(-(x^2+y^2))  を計算してzz座標へ格納する。
ax.set_zlim(0.0,1.0)
ax.set_xlabel('X')
ax.set_ylabel('Y')
ax.set_zlabel('Z')

ax.plot_wireframe(x, y, z, color='blue',linewidth=0.3) # ワイヤーフレームのプロット。linewidthは曲面のメッシュの線の太さ,をそれぞれ表す。

plt.show() # 絵の出力。
結果(2)