matplotlibのset_xscale とset_yscaleに'log'を指定することで片対数および両対数グラフを描くことができる。
例として $ y = e^{2x+1}$をプロットする。
import numpy as np
import matplotlib.pyplot as plt
"""
対数グラフ
"""
x = np.arange(0.001, 10, 0.1)
y = np.exp(2*x+1) # プロットする関数
plt.plot(x, y)
ax = plt.gca()
ax.spines['top'].set_color('none')
##
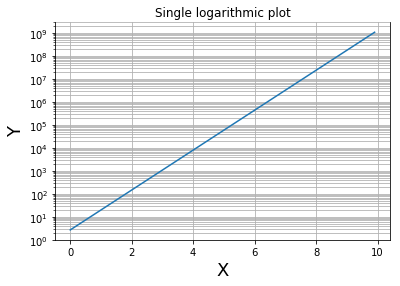
ax.set_yscale('log') # メイン: y軸をlogスケールで描く
# ax.set_xscale('log')
##
plt.title('single logarithmic plot')
plt.xlabel('X',fontsize=18)
plt.ylabel('Y',fontsize=18)
plt.grid(which="both") # グリッド表示。"both"はxy軸両方にグリッドを描く。
plt.show()
結果(1):片対数グラフ
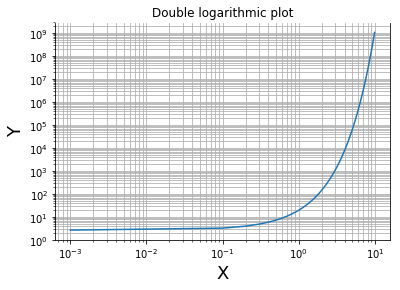
結果(2):両対数グラフ
以下のように,x軸もlogスケールに指定することで両対数グラフを描くことができる。
ax.set_yscale('log')  # y軸をlogスケールで描く
ax.set_xscale('log')  # x軸をlogスケールで描く