はじめに
特許データは、技術進歩のバロメーターとして、また競合調査や市場分析の貴重な情報源として利用されます。本記事では、米国特許商標庁(USPTO)の公開データをPythonを使ってダウンロードし、特許のトレンドを分析する方法をご紹介します。
データの取得
以下のページから特許に関わるデータをダウンロードします。今回はg_patent(特許データ)を使います。
データの前処理
先ほどダウンロードしたg_patent.tsv.zipを任意のディレクトリに移動して以下のコードを実行します。
特許データは大量にあるため、メモリに負荷をかけずに処理するために、Pandasのchunksizeパラメータを使用して、データをチャンクに分割して読み込みます。各チャンクは、データフレームに追加され、最終的にはすべてのデータを含む単一のデータフレームが構築されます。
import os
import zipfile as zip
import pandas as pd
import numpy as np

os.chdir("あなたのディレクトリ")
file_name = "g_patent.tsv.zip"
f_name = "g_patent.tsv"

# 空のデータフレームを初期化
all_data = pd.DataFrame()

with zip.ZipFile(file_name) as zf:
    chunksize = 15*(10 ** 5)
    count = 1
    n_obs = 0
    dtype={'sequence': int}
    try:
        for df in pd.read_csv(zf.open(f_name), delimiter="\t", chunksize=chunksize, low_memory=False):
            print('Processing chunk: ' + str(count))
            n_obs += len(df)
            # 各チャンクをall_dataに追加
            all_data = pd.concat([all_data, df], ignore_index=True)
            count += 1
    except Exception as e:
        print("An error occurred: ", e)

print(n_obs)
print(all_data.dtypes)
print(all_data.describe(exclude=[np.number]))
#日付の前処理
all_data['patent_date'] = all_data['patent_date'].astype(str)
all_data['patent_date'] = pd.to_datetime(all_data['patent_date'], format='%Y-%m-%d')
all_data.head()
以下のようなデータが得られます。
| patent_id | patent_type | patent_date | patent_title | patent_abstract | wipo_kind | num_claims | withdrawn | filename | |
|---|---|---|---|---|---|---|---|---|---|
| 0 | 10000000 | utility | 2018-06-19 | Coherent LADAR using intra-pixel quadrature de... | A frequency modulated (coherent) laser detecti... | B2 | 20 | 0 | ipg180619.xml |
| 1 | 10000001 | utility | 2018-06-19 | Injection molding machine and mold thickness c... | The injection molding machine includes a fixed... | B2 | 12 | 0 | ipg180619.xml |
| 2 | 10000002 | utility | 2018-06-19 | Method for manufacturing polymer film and co-e... | The present invention relates to: a method for... | B2 | 9 | 0 | ipg180619.xml |
| 3 | 10000003 | utility | 2018-06-19 | Method for producing a container from a thermo... | The invention relates to a method for producin... | B2 | 18 | 0 | ipg180619.xml |
| 4 | 10000004 | utility | 2018-06-19 | Process of obtaining a double-oriented film, c... | The present invention relates to provides a do... | B2 | 6 | 0 | ipg180619.xml |
データの可視化
念の為特許データの年ごとの数について可視化します。
import plotly.express as px
#dfの2007年~2019年のデータを可視化
df = all_data.copy()
df['year'] = df['patent_date'].dt.year

# 年ごとの特許件数を集計
yearly_counts = df['year'].value_counts().sort_index()

# DataFrameに変換
df_yearly_counts = pd.DataFrame({'Year': yearly_counts.index, 'Patent Count': yearly_counts.values})

# 折れ線グラフの作成
fig = px.bar(df_yearly_counts, x='Year', y='Patent Count',
             title='Yearly Patent Counts',
             labels={'Year': 'Year', 'Patent Count': 'Number of Patents'},
             color='Patent Count',
             text='Patent Count')

# グラフのカスタマイズ
fig.update_layout(
    xaxis_title='Year',
    yaxis_title='Number of Patents',
    legend_title='Legend',
    template='plotly_dark'
)

# グラフの表示
fig.show()
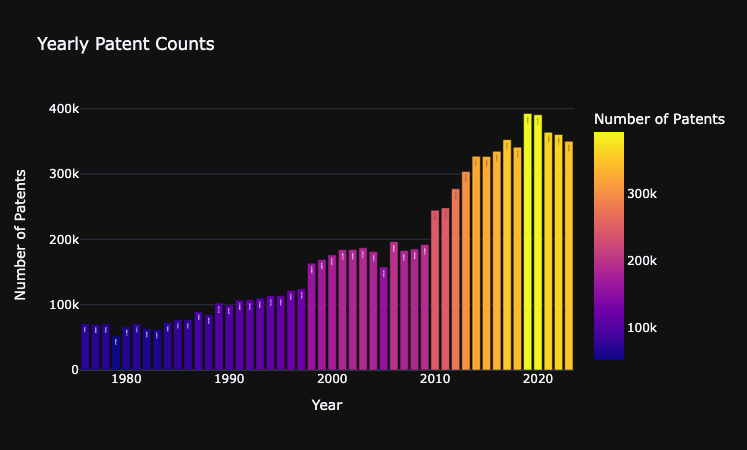
WIPOのデータと比較しても大きな差はないため問題はなさそうです。
分析
あまり深くは立ち入りませんが、考えられるものとしては以下があります
- 時系列分析
特許が出願された日付(patent_date)を用いて、時系列で特許申請のトレンドを分析します。
年次、月次、あるいは四半期ごとの特許申請数の変動をグラフ化します。 - 特許タイプの分布分析
特許タイプ(patent_type)に基づいて、それぞれのタイプの特許申請がどれだけあるかを分析します。
各特許タイプの割合を円グラフや棒グラフで視覚化します。 - クレームの量的分析
特許のクレーム数(num_claims)を分析して、多数のクレームを有する特許がどれだけあるかを調べます。
クレーム数の分布をヒストグラムで表示し、平均的なクレーム数を求めます。 - テキストマイニング
特許のタイトル(patent_title)と抄録(patent_abstract)からテキストデータを抽出し、自然言語処理を行います。
キーワード抽出やトピックモデリングを用いて、特許データの主要なテーマやトレンドを把握します。
感情分析を行って、抄録のテキストのポ
ジティブな表現やネガティブな表現を分析します。 - ネットワーク分析
特許の引用関係を分析することで、特許間の関係性や技術的なつながりを可視化します。
NetworkXやPyvisなどのライブラリを用いて特許のネットワークグラフを作成します。 - 引退特許(withdrawn)の分析
引退した特許(withdrawnフィールドが1)の割合や傾向を分析します。
撤回された特許に共通する特徴を探ります。 - WIPO分類の分析
特許データのWIPO種別(wipo_kind)に基づいて、国際的な特許分類を分析します。
特許の種別ごとの申請数や成長率を評価します。 - 特許の地理的分析
特許ファイル名(filename)から特許申請が行われた国や地域の情報を抽出し、地理的な傾向を分析します。
地理的な特許活動のホットスポットを地図上にプロットします。