2025-07-17:
gbdrawのウェブアプリが出ました。ぜひお試しください。
gbdraw


何をするソフトか
gbdrawは、微生物ゲノムをSVG/PNG/PDFなどで可視化するコマンドラインツール
(ウェブアプリとColab Notebookもあります)。
入力: GenBank/EMBL/DDBJ形式のファイル(.gb, .gbk, .gbff, .embl, .ddbjなど)
出力: SVG, PNG, PDF, EPS, PS
対応: 環状ゲノム / 直鎖状ゲノム(BLAST比較含む)
目指した特徴: コマンド一発で見やすくて編集しやすい図を作る
こんな感じの図をコマンド一発で出せるようにした。
gbdraw circular -i AP027078.gb -f svg --separate_strands --track_type tuckin

なぜわざわざこんなものを作ったのか
ゲノム可視化ツールは数多く存在するものの、日常的な研究利用において以下のような不便さを感じていた。
-
好みに合ったスタイルで描画してくれない
→ 図形の形状、要素の配置、配色設計が (自分にとって) 直感的でない場合が多く、好みに合った「美しい図」を描くのが困難。視認性や一貫性を重視したい場合、出力結果を都度手作業で調整する必要がある -
ライブラリはコマンド一発で描けない
→ PythonやRのゲノム可視化ライブラリは描画までに煩雑なコードが必要。簡単な可視化をするにも細かなスクリプトを書く必要があるため、日常的な利用には向かず、敷居が高い -
論文向けの図として編集がしにくい
→ PNGなどのラスター形式に限定された出力や、SVGであっても中身が過剰に細分化されていたり、階層構造が乱雑なため、InkscapeやIllustratorでの再編集が現実的でない場合が多い -
パッケージがデカすぎる
→ 多くのツールはmatplotlibやggplot2など巨大なライブラリに依存したり、アノテーションなどの抱き合わせ機能を抱えているため、パッケージサイズが膨れ上がっている
→ 自分で作るしかない
インストール方法
conda経由でインストールできます。
conda create -n gbdraw-0.1.0 -y -c conda-forge -c bioconda gbdraw=0.1.0
conda activate gbdraw-0.1.0
使い方
環状ゲノム
細菌や大型DNAウイルスのゲノム、真核生物のミトコンドリアゲノムなど環状DNAを描画するときに使うモード。
ヘルプメッセージはこちら
gbdraw circular -h
usage: gbdraw [-h] -i [INPUT ...] [-o OUTPUT] [-t TABLE] [-d DEFAULT_COLORS] [-n NT] [-w WINDOW] [-s STEP] [--species SPECIES]
              [--strain STRAIN] [-k FEATURES] [--block_stroke_color BLOCK_STROKE_COLOR] [--block_stroke_width BLOCK_STROKE_WIDTH]
              [--line_stroke_color LINE_STROKE_COLOR] [--line_stroke_width LINE_STROKE_WIDTH] [-f FORMAT] [--suppress_gc]
              [--suppress_skew]

Generate genome diagrams in PNG/PDF/SVG/PS/EPS. Diagrams for multiple entries are saved separately (hence the lack of output file
name option).

options:
  -h, --help            show this help message and exit
  -i [INPUT ...], --input [INPUT ...]
                        Genbank/DDBJ flatfile (required)
  -o OUTPUT, --output OUTPUT
                        output file prefix (default: accession number of the sequence)
  -t TABLE, --table TABLE
                        color table (optional)
  -d DEFAULT_COLORS, --default_colors DEFAULT_COLORS
                        TSV file that specifies default color Configurator (optional; default: data/default_colors.tsv)
  -n NT, --nt NT        dinucleotide (default: GC).
  -w WINDOW, --window WINDOW
                        window size (default: 1000)
  -s STEP, --step STEP  step size (default: 100)
  --species SPECIES     Species name (optional; e.g. "<i>Escherichia coli</i>", "<i>Ca.</i> Hepatoplasma crinochetorum")
  --strain STRAIN       Strain/isolate name (optional; e.g. "K-12", "Av")
  -k FEATURES, --features FEATURES
                        Comma-separated list of feature keys to draw (default: CDS,tRNA,rRNA,repeat_region)
  --block_stroke_color BLOCK_STROKE_COLOR
                        Block stroke color (str; default: "black")
  --block_stroke_width BLOCK_STROKE_WIDTH
                        Block stroke width (float; default: 0)
  --line_stroke_color LINE_STROKE_COLOR
                        Line stroke color (str; default: "gray")
  --line_stroke_width LINE_STROKE_WIDTH
                        Line stroke width (float; default: 1.0)
  -f FORMAT, --format FORMAT
                        Comma-separated list of output file formats (default: png)
  --suppress_gc         Suppress GC content track (default: False).
  --suppress_skew       Suppress GC skew track (default: False).
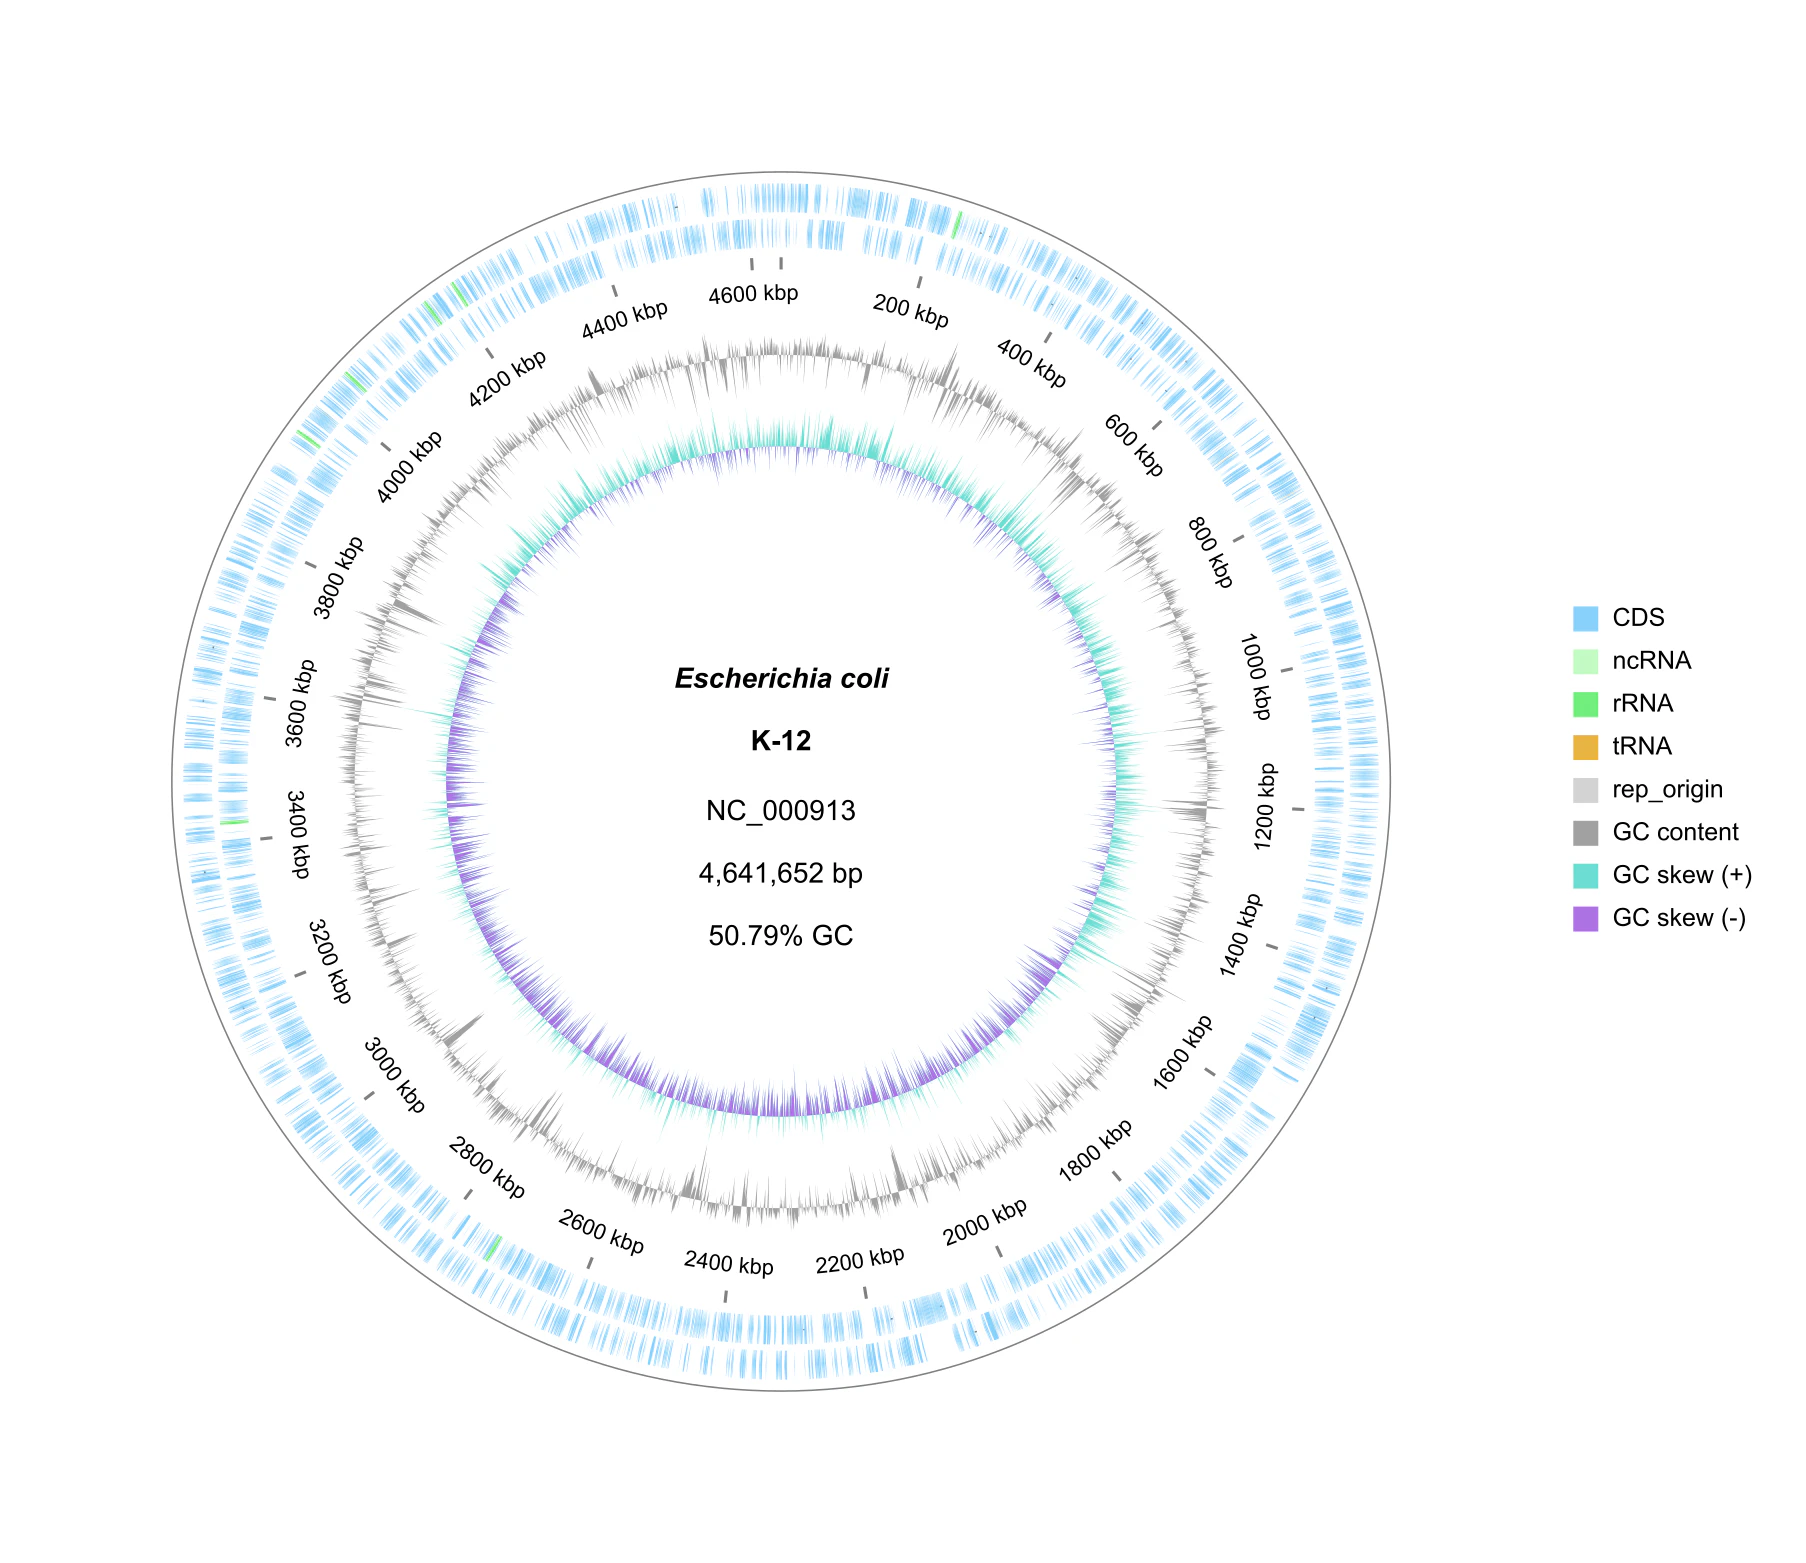
大腸菌 Escherichia coli
gbdraw circular -i NC_000913.gb --species "<i>Escherichia coli</i>" --strain "K-12"
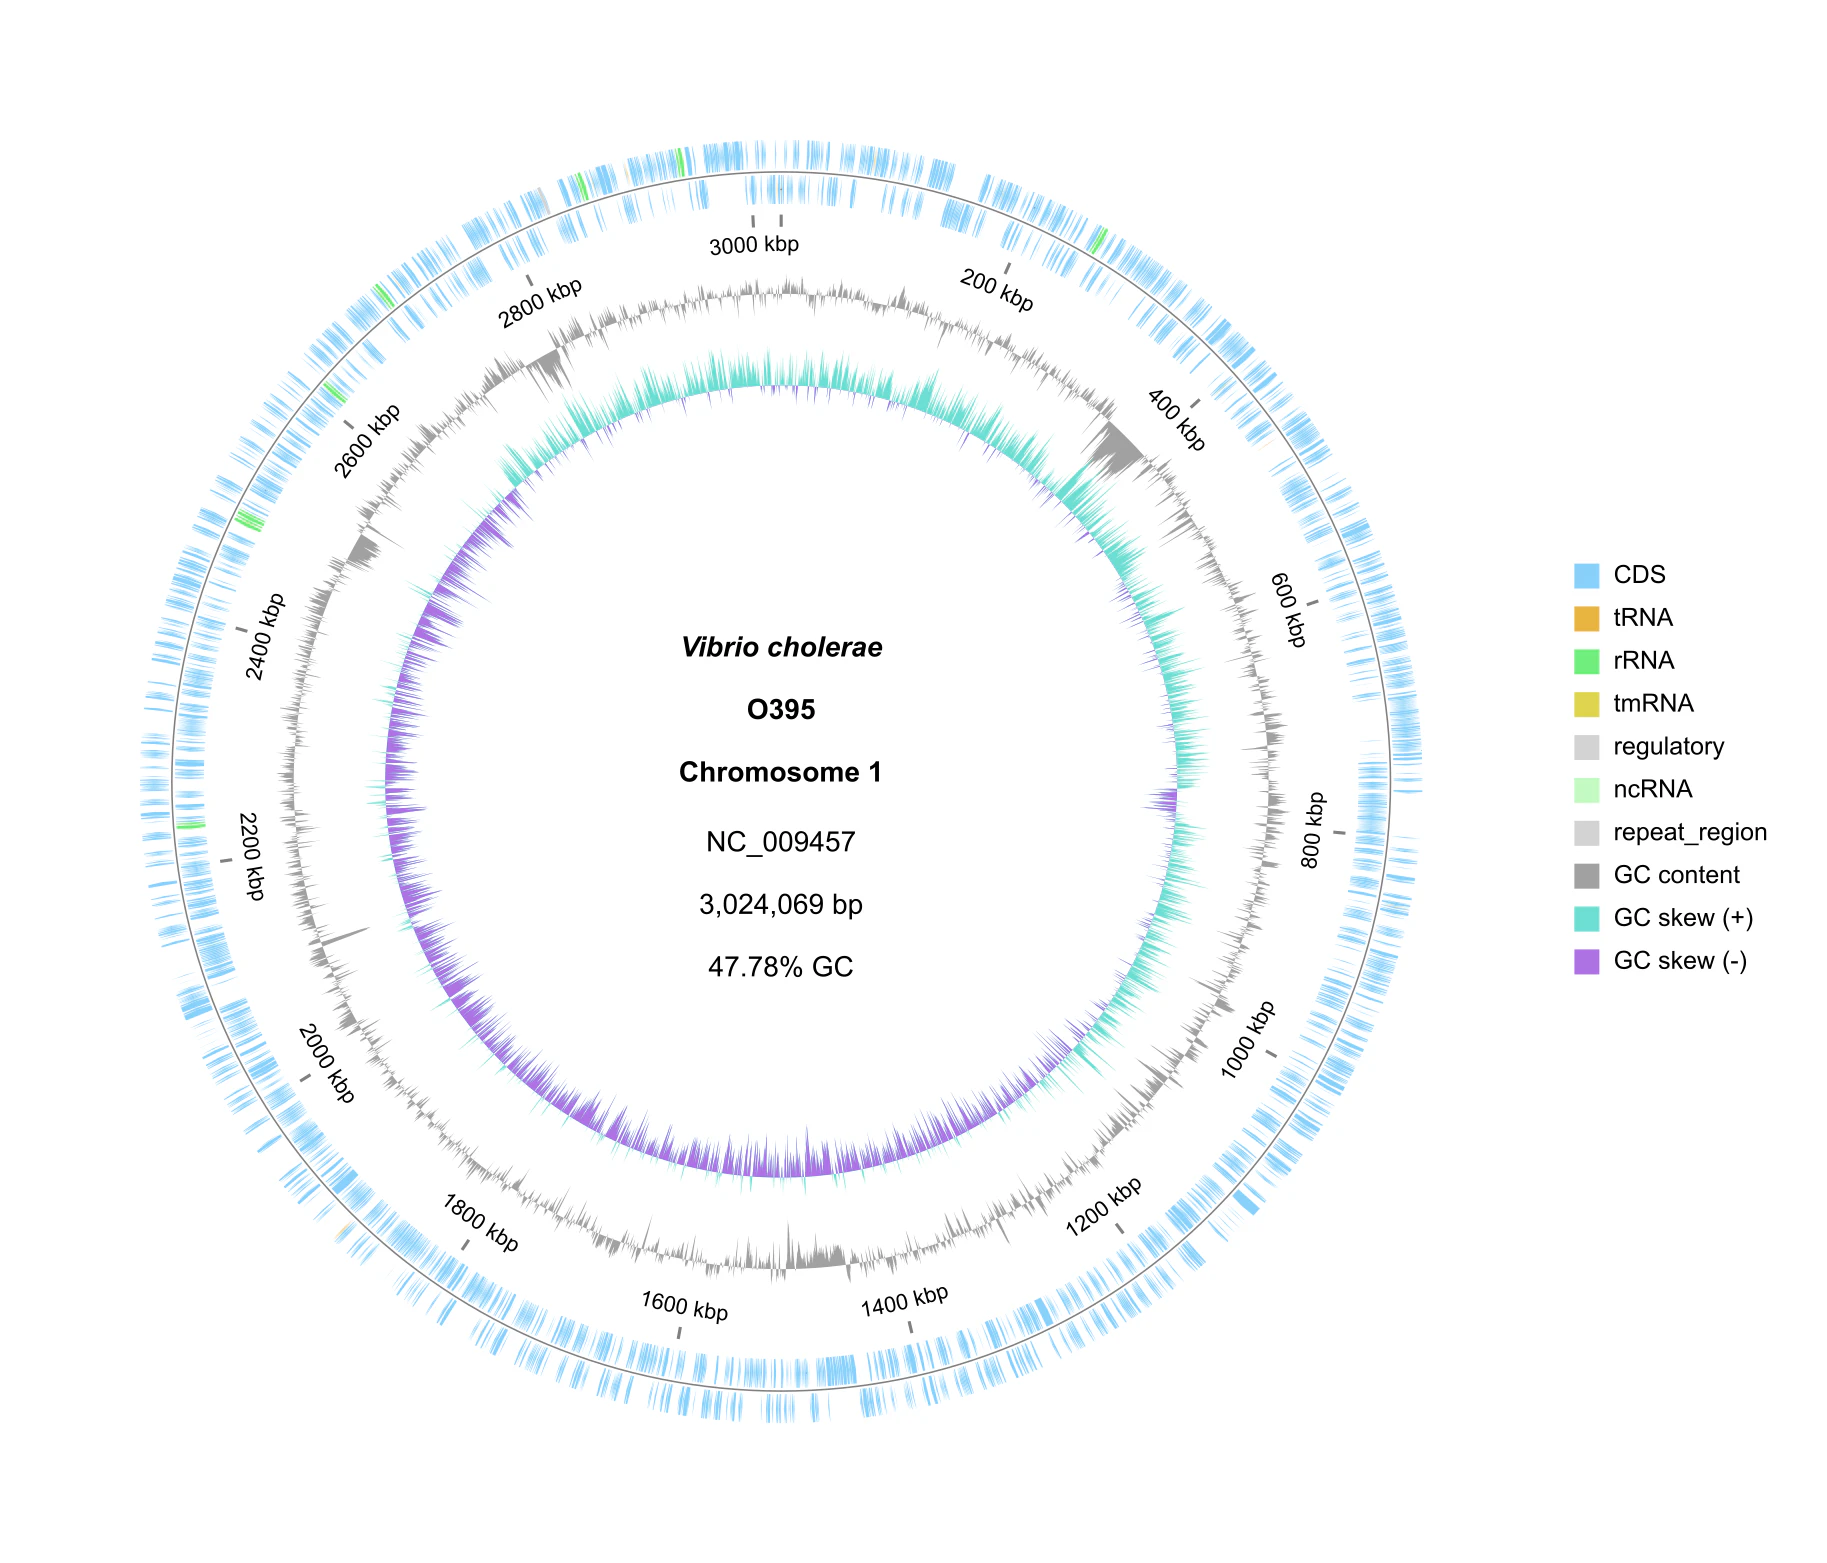
コレラ菌 Vibrio cholerae
1ファイル内に複数本の配列がある場合、別々のファイルとして出力される。
wget https://ftp.ncbi.nlm.nih.gov/genomes/all/GCF/000/016/245/GCF_000016245.1_ASM1624v1/GCF_000016245.1_ASM1624v1_genomic.gbff.gz # download genome
gunzip GCF_000016245.1_ASM1624v1_genomic.gbff.gz # extract file
gbdraw circular -i GCF_000016245.1_ASM1624v1_genomic.gbff --species "<i>Vibrio cholerae</i>" --strain "O395" -f svg # Draw genome; results in "NC_009457.svg" for Chromosome I and "NC_009456.svg" for Chromosome II

ミトコンドリアゲノム (ヒト Homo sapiens)
gbdraw circular -i NC_012920.gb -f svg,png --block_stroke_width 2 --block_stroke_color gray --show_labels -w 100 -s 10
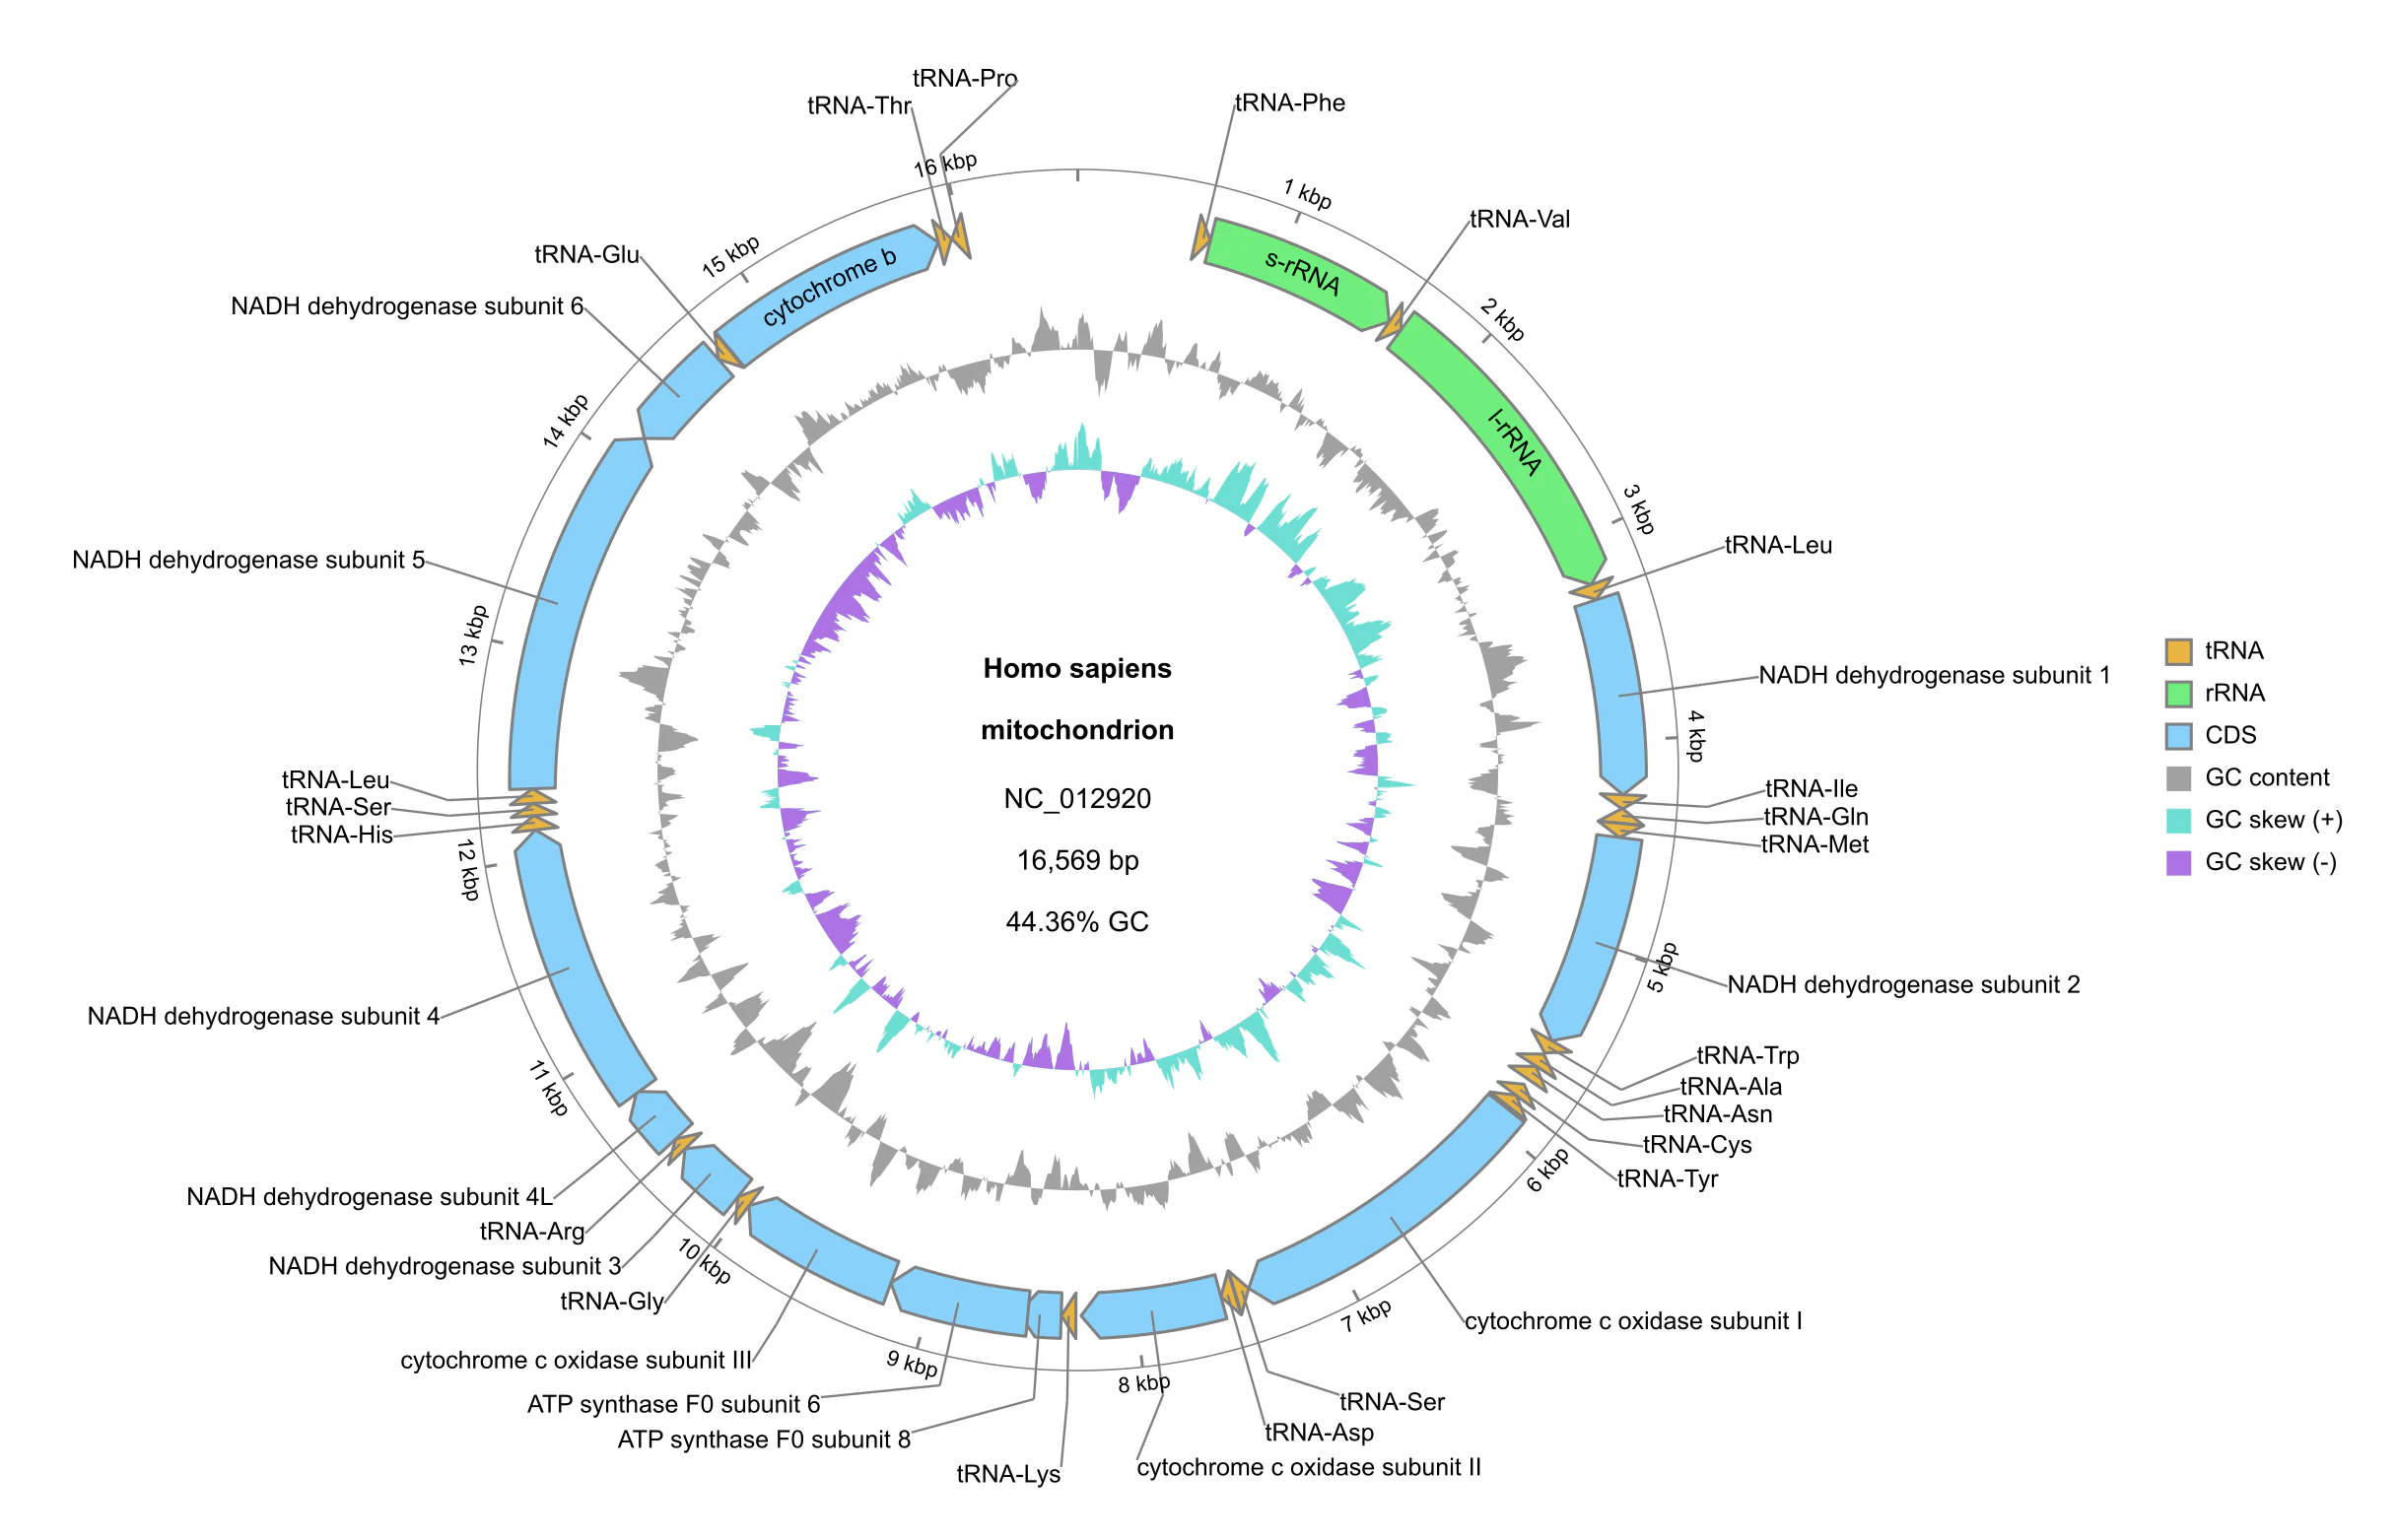
短い(>50kb)配列の場合、描画の太さや目盛りの刻みが変わります。
直鎖状ゲノム
ゲノム間の比較には直鎖状に描画したほうが都合がよいので、linearモードも実装した。BLAST (BLASTN/TBLASTX) の出力ファイルを追加することで、ゲノム間で配列が類似している領域を帯状に可視化できる。BLAST出力ファイル(-b)の順序は、配列ファイル(-i)の順序と一致していなければならない。
ヘルプメッセージはこちら
$ gbdraw linear -h
usage: gbdraw [-h] -i [INPUT ...] [-b [BLAST ...]] [-t TABLE] [-d DEFAULT_COLORS] [-o OUTPUT] [-n NT] [-w WINDOW] [-s STEP]
              [--separate_strands] [--show_gc] [--align_center] [--evalue EVALUE] [--bitscore BITSCORE] [--identity IDENTITY]
              [-k FEATURES] [--block_stroke_color BLOCK_STROKE_COLOR] [--block_stroke_width BLOCK_STROKE_WIDTH]
              [--line_stroke_color LINE_STROKE_COLOR] [--line_stroke_width LINE_STROKE_WIDTH] [-f FORMAT]

Generate plot in PNG/PDF/SVG/PS/EPS.

options:
  -h, --help            show this help message and exit
  -i [INPUT ...], --input [INPUT ...]
                        genbank (required)
  -b [BLAST ...], --blast [BLAST ...]
                        input BLAST result file in tab-separated format (-outfmt 6 or 7) (optional)
  -t TABLE, --table TABLE
                        color table (optional)
  -d DEFAULT_COLORS, --default_colors DEFAULT_COLORS
                        TSV file that specifies default color Configurator (optional; default: data/default_colors.tsv)
  -o OUTPUT, --output OUTPUT
                        output file prefix (default: out)
  -n NT, --nt NT        dinucleotide skew (default: GC).
  -w WINDOW, --window WINDOW
                        window size (default: 1000)
  -s STEP, --step STEP  step size (default: 100)
  --separate_strands    separate forward and reverse strands (default: False). Features of undefined strands are shown on the
                        forward strand.
  --show_gc             plot GC content below genome (default: False).
  --align_center        Align genomes to the center (default: False).
  --evalue EVALUE       evalue threshold (default=1e-2)
  --bitscore BITSCORE   bitscore threshold (default=50)
  --identity IDENTITY   identity threshold (default=0)
  -k FEATURES, --features FEATURES
                        Comma-separated list of feature keys to draw (default: CDS,tRNA,rRNA,repeat_region)
  --block_stroke_color BLOCK_STROKE_COLOR
                        Block stroke color (str; default: "black")
  --block_stroke_width BLOCK_STROKE_WIDTH
                        Block stroke width (float; default: 0)
  --line_stroke_color LINE_STROKE_COLOR
                        Line stroke color (str; default: "gray")
  --line_stroke_width LINE_STROKE_WIDTH
                        Line stroke width (float; default: 1.0)
  -f FORMAT, --format FORMAT
                        Comma-separated list of output file formats (default: png)
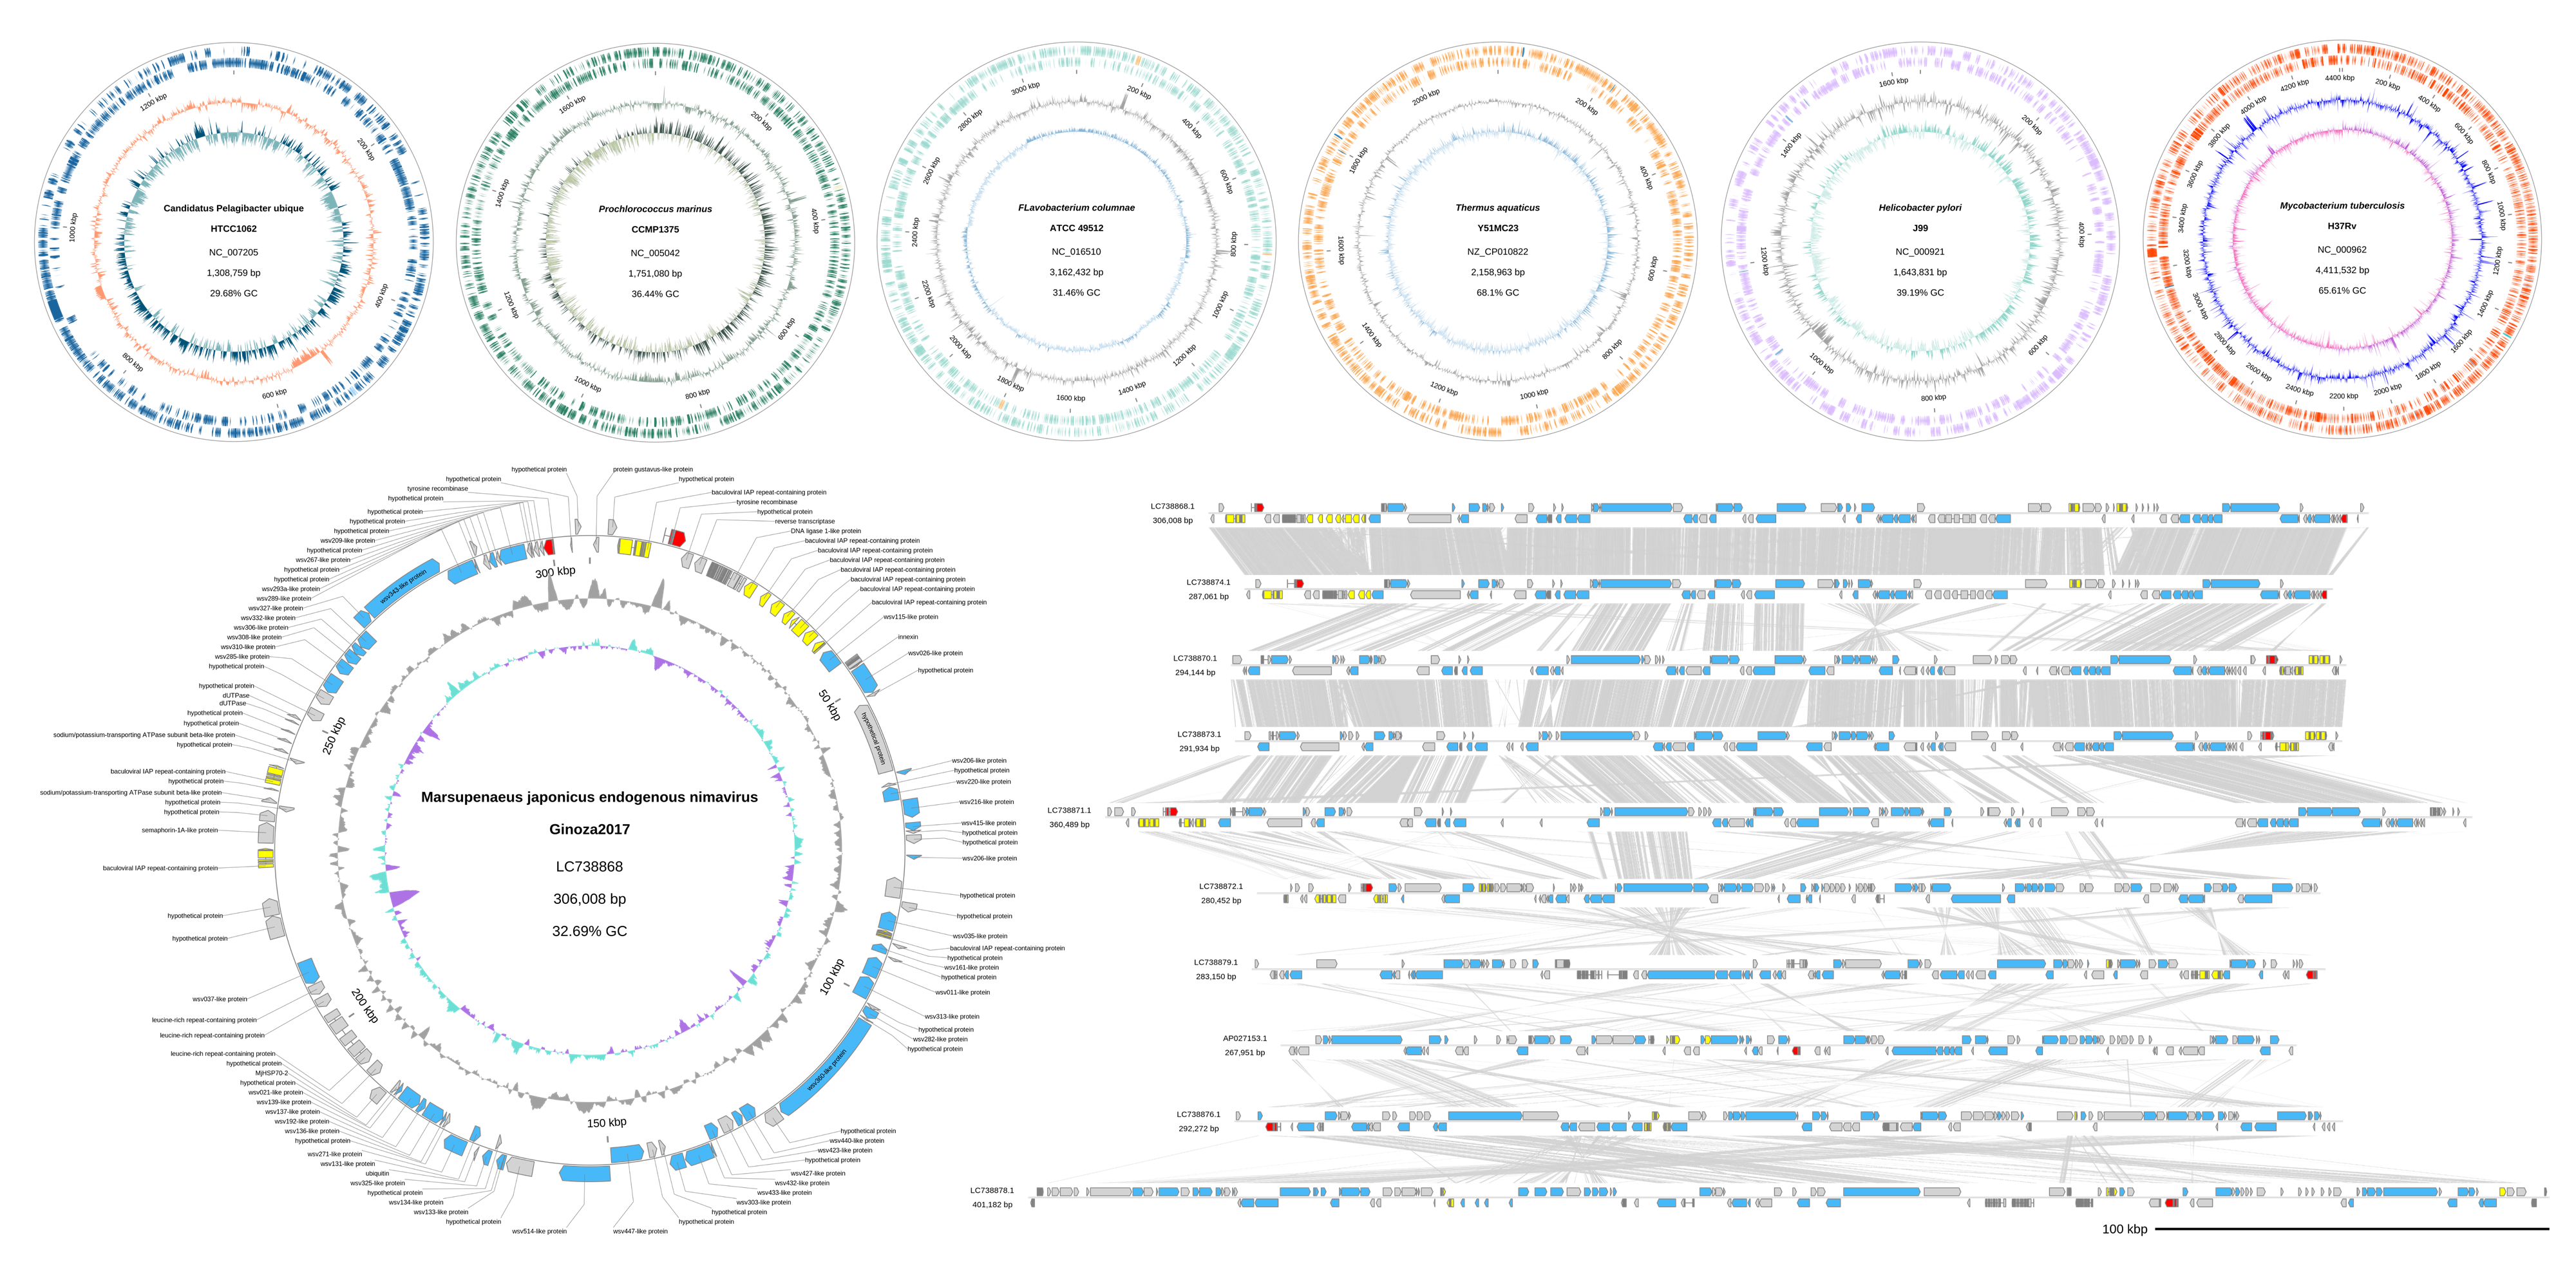
大型DNAウイルス (ニマウイルス)
# Pairwise TBLASTX search
tblastx -query MjeNMV.fasta -subject MelaMJNV.fasta -outfmt 7 -out MjeNMV.MelaMJNV.tblastx.out
tblastx -query MelaMJNV.fasta -subject PemoMJNVA.fasta -outfmt 7 -out MelaMJNV.PemoMJNVA.tblastx.out
tblastx -query PemoMJNVA.fasta -subject PeseMJNV.fasta -outfmt 7 -out PemoMJNVA.PeseMJNV.tblastx.out
tblastx -query PeseMJNV.fasta -subject PemoMJNVB.fasta -outfmt 7 -out PeseMJNV.PemoMJNVB.tblastx.out
tblastx -query PemoMJNVB.fasta -subject LvMJNV.fasta -outfmt 7 -out PemoMJNVB.LvMJNV.tblastx.out
tblastx -query LvMJNV.fasta -subject TrcuMJNV.fasta -outfmt 7 -out LvMJNV.TrcuMJNV.tblastx.out
tblastx -query TrcuMJNV.fasta -subject MellatMJNV.fasta -outfmt 7 -out TrcuMJNV.MellatMJNV.tblastx.out
tblastx -query MellatMJNV.fasta -subject MeenMJNV.fasta -outfmt 7 -out MellatMJNV.MeenMJNV.tblastx.out
tblastx -query MeenMJNV.fasta -subject MejoMJNV.fasta -outfmt 7 -out MeenMJNV.MejoMJNV.tblastx.out
# gbdraw

# gbdraw
gbdraw linear \
-i \
MjeNMV.gb \
MelaMJNV.gb \
PemoMJNVA.gb \
PeseMJNV.gb \
PemoMJNVB.gb \
LvMJNV.gb \
TrcuMJNV.gb \
MellatMJNV.gb \
MeenMJNV.gb \
MejoMJNV.gb \
-b \
MjeNMV.MelaMJNV.tblastx.out \
MelaMJNV.PemoMJNVA.tblastx.out \
PemoMJNVA.PeseMJNV.tblastx.out \
PeseMJNV.PemoMJNVB.tblastx.out \
PemoMJNVB.LvMJNV.tblastx.out \
LvMJNV.TrcuMJNV.tblastx.out \
TrcuMJNV.MellatMJNV.tblastx.out \
MellatMJNV.MeenMJNV.tblastx.out \
MeenMJNV.MejoMJNV.tblastx.out \
-t color_table.txt \
-d modified_default_colors.tsv \
--block_stroke_width 1 \
--block_stroke_color gray \
--show_labels \
--align_center \
--separate_strands \
-o majani -f svg

Colab Notebook版もあります
ローカル環境にインストールすることなく、Google Colab上でgbdrawを使うことができます。ぜひお試し下さい。
Try gbdraw on Colab Notebook! ![]()
動くのはgithub上の開発版です。
バグ等を発見したらGitHubまでお願いします。