概要
ある物体の昇温データのCSVをExcelに変換し、昇温時間の入力や任意の温度でのセルの色付け、チャートの作成までを自動で行うGUIツールを作成しました。
・GUI

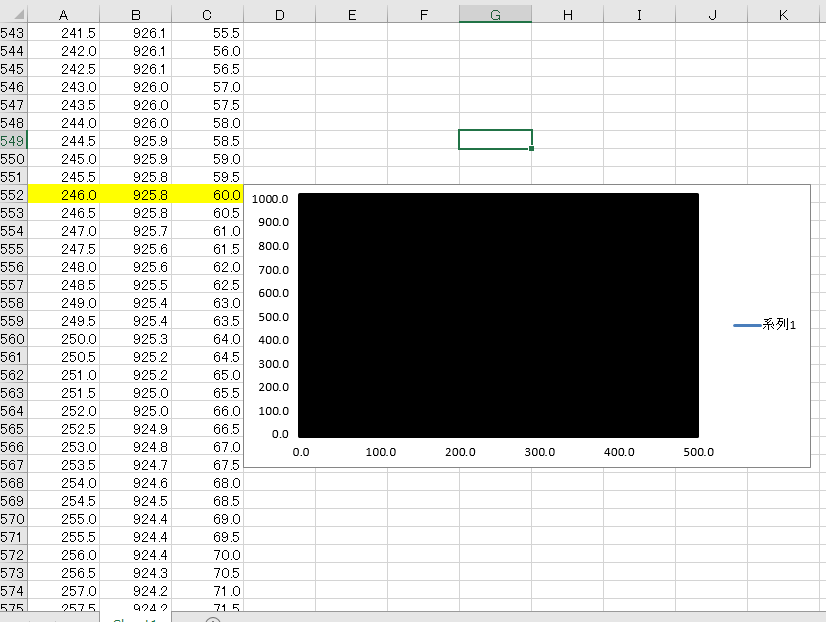
・自動作成したExcelファイル(※グラフは塗りつぶしてあります)
環境
- Windows10
- Python3.8
- Tkinter
全文
ExcelMaker
import os, sys
import pandas as pd
import openpyxl as px
import tkinter as tk
import tkinter.filedialog as fl
import tkinter.messagebox as mb
from openpyxl.chart import ScatterChart, Reference, Series
from openpyxl.styles import PatternFill

# ファイル選択関数
def select_file():
    global file_path
    filetype = [("all file", "*.csv")] #CSVファイルを表示
    iDir = os.path.abspath(r"<ディレクトリのパス>") #最初に表示したいディレクトリのパス
    file_path = fl.askopenfilename(initialdir=iDir, filetypes=filetype) #パスの指定
    file1.set(file_path) #選択したパスを表示

# エクセル作成関数
def make_excel():
    excel_name = str(os.path.splitext(file_path)[0]) + "-1.xlsx" #Excelの名前
    df = pd.read_csv(file_path, skiprows=57, usecols=[2], encoding="cp932") #CSVの読み込み
    df.drop(df.tail(3).index, inplace=True) #末尾3行を消去しファイルを置き換え
    df_float = df.astype("float").round(1) #小数点第一で丸める

    #同名ファイルがある場合、上書き保存するか確認
    if os.path.isfile(excel_name):
        res = mb.askquestion("", "同名ファイルがあります。上書きしますか?")
        #ファイルを上書き
        if res == "yes":
            df_float.to_excel(excel_name, header=False, index=False)
        #プログラムを終了
        elif res == "no":
            mb.showinfo("", "もう一度ファイル名を確認してください")
            sys.exit()
    #ファイルを新規作成
    else:
        df_float.to_excel(excel_name, header=False, index=False)

    #Excelの操作関係
    wb = px.load_workbook(excel_name)
    ws = wb.active
    sheet = wb["Sheet1"]
    sc = sheet.cell
    wc = ws.cell

    sheet.insert_cols(0, 1) #先頭に1列挿入

    temp_var = int(entry_temp.get()) - 10 #狙い温度-10℃
    start = 1 #昇温開始時間
    cell_diff1 = 0 #上下セルの差

    #上下のセルを比べ、3回連続で3以上上昇した場合昇温開始とする
    while cell_diff1 <= 3:
        start += 1
        cell_diff3 = float(sc(row=start+1, column=2).value) - float(sc(row=start, column=2).value)
        if cell_diff3 >= 3:
            cell_diff2 = float(sc(row=start+2, column=2).value) - float(sc(row=start+1, column=2).value)
            if cell_diff2 >= 3:
                cell_diff1 = float(sc(row=start+3, column=2).value) - float(sc(row=start+2, column=2).value)

    end = start #データの最終行
    v1 = 0 #昇温時間

    #昇温時間を0.5ずつ入力
    while sc(row=end, column=2).value is not None:
        wc(row=end, column=1, value=v1)
        end += 1
        v1 += 0.5

    keep = start #保定開始時間
    fill = PatternFill(fill_type="solid", fgColor="FFFF00") #セルを黄色で塗りつぶし
    temp_var = int(entry_temp.get()) - 10 #狙い温度-10℃

    #狙い温度-10℃の行
    while sc(row=keep, column=2).value <= temp_var:
        keep += 1

    #小数点第一位が5の場合、1行下げる
    if str(sc(row=keep, column=1).value)[-1] == str(5):
        keep = keep + 1

    #保定開始時間のセルに色を付ける
    wc(row=keep, column=1).fill = fill
    wc(row=keep, column=2).fill = fill

    v2 = 0 #昇温時間

    #狙い温度-10℃から、保定時間を0.5ずつ入力
    while keep != end:
        wc(row=keep, column=3, value=v2)
        keep += 1
        v2 += 0.5
        #該当の保定時間のセルに色を付ける
        if int(entry_time1.get()) == v2 or int(entry_time2.get()) == v2 or int(entry_time3.get()) == v2:
            wc(row=keep, column=1).fill = fill
            wc(row=keep, column=2).fill = fill
            wc(row=keep, column=3).fill = fill

            max_entry_time = keep #保定時間の最大値

    #セルの書式を小数第一位で揃える
    for row in sheet:
        for cell in row:
            cell.number_format = "0.0"

    #グラフの作成
    chart = ScatterChart()

    x_values = Reference(ws, min_row=start, min_col=1, max_row=end, max_col=1) #x軸(昇温時間)
    y_values = Reference(ws, min_row=start, min_col=2, max_row=end, max_col=2) #y軸(温度)

    graph = Series(y_values, x_values)
    chart.series.append(graph)

    ws.add_chart(chart, "D"+str(max_entry_time)) #チャートを保定終了時の行に表示

    wb.save(excel_name) #Excelファイルを保存
    mb.showinfo("", "Excelファイルを作成しました")

# GUIの作成
if __name__ == "__main__":
    root = tk.Tk()
    root.title("CSVをExcelに変換")

    #frame1
    frame1 = tk.LabelFrame(root, text="ファイルを選択")
    frame1.grid(row=0, columnspan=2, sticky="we", padx=5)

    #選択ボタン
    select_button = tk.Button(frame1, text="選択", command=select_file, width=10)
    select_button.grid(row=0, column=3)

    #ファイルパスの表示
    file1 = tk.StringVar()
    file1_entry = tk.Entry(frame1, textvariable=file1, width=35)
    file1_entry.grid(row=0, column=2, padx=5)

    #frame2
    frame2 = tk.LabelFrame(root, text="条件")
    frame2.grid(row=1, sticky="we")

    #狙い温度のテキスト
    text_temp = tk.Label(frame2, text="狙い温度(℃)", width=20)
    text_temp.grid(row=0, column=0, padx=5)

    #保定時間のテキスト
    text_time = tk.Label(frame2, text="保定時間(秒):複数指定可", width=25)
    text_time.grid(row=0, column=1)

    #実行ボタン
    action_button = tk.Button(frame2, text="実行", command=make_excel, width=15)
    action_button.grid(row=3, column=0)

    #狙い温度の入力欄
    entry_temp = tk.Entry(frame2, width=15)
    entry_temp.grid(row=1, column=0, padx=5)

    #保定時間の入力欄
    entry_time1 = tk.Entry(frame2, width=15)
    entry_time1.grid(row=1, column=1, padx=5, pady=5)
    entry_time1.insert(tk.END, 0)

    entry_time2 = tk.Entry(frame2, width=15)
    entry_time2.grid(row=2, column=1, padx=5, pady=5)
    entry_time2.insert(tk.END, 0)

    entry_time3 = tk.Entry(frame2, width=15)
    entry_time3.grid(row=3, column=1, padx=5, pady=5)
    entry_time3.insert(tk.END, 0)

root.mainloop()
解説
準備
import os, sys
import pandas as pd
import openpyxl as px
import tkinter as tk
import tkinter.filedialog as fl
import tkinter.messagebox as mb
from openpyxl.chart import ScatterChart, Reference, Series
from openpyxl.styles import PatternFill
必要なモジュールをインポートします。
tkinterでGUIの作成、pandasでCSVの読み込み、openpyxlでExcel操作を行います。
ファイル選択時の関数
# ファイル選択関数
def select_file():
    global file_path
    filetype = [("all file", "*.csv")] #CSVファイルを表示
    iDir = os.path.abspath(r"<ディレクトリのパス>") #最初に表示したいディレクトリのパス
    file_path = fl.askopenfilename(initialdir=iDir, filetypes=filetype) #パスの指定
    file1.set(file_path) #選択したパスを表示
選択ボタンを押したときの処理を作成します。
filetypeでCSVだけ表示するようにし、iDirに選択ボタンを押したときに最初に開くディレクトリを指定します。
今回、開発環境に使っているIDLEでは、クォーテーションで文字列を囲む場合先頭にrを付けなければエラーが出ることがあるので記入しています。
filedialog.askopenfilenameで選択したファイル名を取得し、他の関数でも使いたいのでglobalにします。
file1.set(file_path)でファイルパスを選択ボタン左のフレームに表示します。
Excel作成の関数
CSVを読み込み、同名のExcelファイルがないか確認
# エクセル作成関数
def make_excel():
    excel_name = str(os.path.splitext(file_path)[0]) + "-1.xlsx" #Excelの名前
    df = pd.read_csv(file_path, skiprows=57, usecols=[2], encoding="cp932") #CSVの読み込み
    df.drop(df.tail(3).index, inplace=True) #末尾3行を消去しファイルを置き換え
    df_float = df.astype("float").round(1) #小数点第一で丸める

    #同名ファイルがある場合、上書き保存するか確認
    if os.path.isfile(excel_name):
        res = mb.askquestion("", "同名ファイルがあります。上書きしますか?")
        #ファイルを上書き
        if res == "yes":
            df_float.to_excel(excel_name, header=False, index=False)
        #プログラムを終了
        elif res == "no":
            mb.showinfo("", "もう一度ファイル名を確認してください")
            sys.exit()
    #ファイルを新規作成
    else:
        df_float.to_excel(excel_name, header=False, index=False)

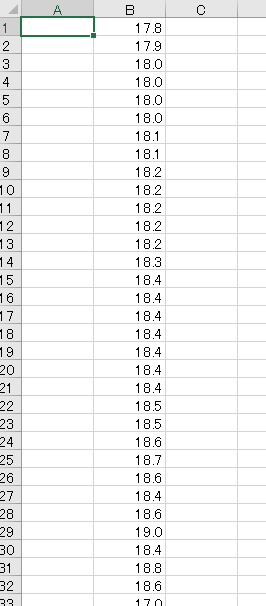
先ずは、上のようなCSVから必要な部分を抜き出しExcelファイルにします。
CSVをExcel名に変換するためにstr(os.path.splitext(file_path)[0]) + "-1.xlsx"で先ほどのファイルパスの末尾のドット以下(.csv)を消し、-1.xlsxを付け足します。
pd.read_csvでCSVを読み込みます。
必要なデータは2列目の58行目以降だったので、引数にskiprows=57, usecols=[2]を指定します。
また、そのままだと型の関係でエラーが出流ので、encoding="cp932"を指定します。
読み込んだCSVの末尾3行に不要なデータがあったので、df.drop(df.tail(3).index)で削除しinplace=Trueで再びCSVファイルを置き換えます。
df.astype("float").round(1)で小数点第一位で丸めた浮動小数点型にしています。
同名ファイルがあった場合の処理のために、if os.path.isfile(excel_name):で作成しようとしているExcelファイルを検索します。
この時の条件式は、Trueの場合次のif文に進み(== Trueは省略可)、それ以外の場合は新規でExcelファイルを作成します。
同名ファイルがあった場合、messagebox.askquestionで「はい」と「いいえ」を選択するウィンドウを表示します。
詳細はまだ理解できていませんが、この時res = messagebox.askquestioと変数を定義しているだけですが、実際は処理が働いてウィンドウが表示されます。
その為、事前に定義しておこうとすると予期せぬところで表示されてしまうので、表示させたいタイミングで記述するようにしましょう。
messagebox.askquestioの戻り値は「はい=yes」「いいえ=no」なので、yesの場合はそのままExcelファイルを上書きし、noの場合はメッセージ表示後sys.exit()でプログラムを終了します。
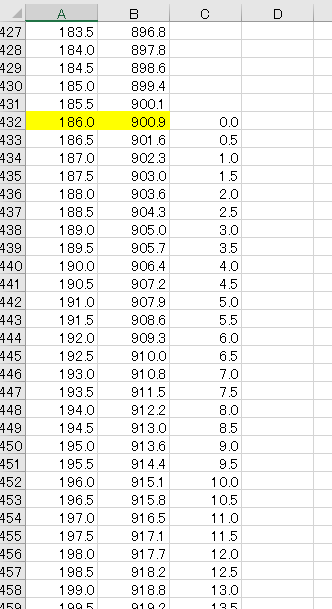
ここまでで、下のような2列目に温度変化のデータが入ったExcelファイルになります。
昇温時間の入力
    #Excelの操作関係
    wb = px.load_workbook(excel_name)
    ws = wb.active
    sheet = wb["Sheet1"]
    sc = sheet.cell
    wc = ws.cell

    sheet.insert_cols(0, 1) #先頭に1列挿入

    temp_var = int(entry_temp.get()) - 10 #狙い温度-10℃
    start = 1 #昇温開始時間
    cell_diff1 = 0 #上下セルの差

    #上下のセルを比べ、3回連続で3以上上昇した場合昇温開始とする
    while cell_diff1 <= 3:
        start += 1
        cell_diff3 = float(sc(row=start+1, column=2).value) - float(sc(row=start, column=2).value)
        if cell_diff3 >= 3:
            cell_diff2 = float(sc(row=start+2, column=2).value) - float(sc(row=start+1, column=2).value)
            if cell_diff2 >= 3:
                cell_diff1 = float(sc(row=start+3, column=2).value) - float(sc(row=start+2, column=2).value)

    end = start #データの最終行
    v1 = 0 #昇温時間

    #昇温時間を0.5ずつ入力
    while sc(row=end, column=2).value is not None:
        wc(row=end, column=1, value=v1)
        end += 1
        v1 += 0.5
while cell_diff1 <= 3:で上下のセルを比べ、3回連続で3以上上昇した場合昇温開始とします。
まず、cell_diff3 = float(sc(row=start+1, column=2).value) - float(sc(row=start, column=2).value)でstart行と1行下を比べ、3以上の場合同じようにcell_diff2で1行下を比べ、最終的にdell_diff1が3以上になった場合while文を終了します。
昇温開始の行が分かったら、while sc(row=end, column=2).value is not None:で温度変化の列の値が空欄になるまで1列目に昇温時間を入力していきます。

保定時間の入力
    keep = start #保定開始時間
    fill = PatternFill(fill_type="solid", fgColor="FFFF00") #セルを黄色で塗りつぶし
    temp_var = int(entry_temp.get()) - 10 #狙い温度-10℃

    #狙い温度-10℃の行
    while sc(row=keep, column=2).value <= temp_var:
        keep += 1

    #小数点第一位が5の場合、1行下げる
    if str(sc(row=keep, column=1).value)[-1] == str(5):
        keep = keep + 1

    #保定開始時間のセルに色を付ける
    wc(row=keep, column=1).fill = fill
    wc(row=keep, column=2).fill = fill

    v2 = 0 #昇温時間

    #狙い温度-10℃から、保定時間を0.5ずつ入力
    while keep != end:
        wc(row=keep, column=3, value=v2)
        keep += 1
        v2 += 0.5
        #該当の保定時間のセルに色を付ける
        if int(entry_time1.get()) == v2 or int(entry_time2.get()) == v2 or int(entry_time3.get()) == v2:
            wc(row=keep, column=1).fill = fill
            wc(row=keep, column=2).fill = fill
            wc(row=keep, column=3).fill = fill

            max_entry_time = keep #保定時間の最大値

    #セルの書式を小数第一位で揃える
    for row in sheet:
        for cell in row:
            cell.number_format = "0.0"
temp_var = int(entry_temp.get()) - 10で狙い温度-10℃の値を取得し、while sc(row=keep, column=2).value <= temp_var:で取得した値の行を調べます。
その時に、昇温時間の小数点第一が5の場合、if str(sc(row=keep, column=1).value)[-1] == str(5):で1行下げます。
保定開始の行が分かったら、while keep != end:で最終行まで保定時間を入力します。
その時、if int(entry_time1.get()) == v2 or int(entry_time2.get()) == v2 or int(entry_time3.get()) == v2:で、指定の保定時間と同じ行を塗りつぶし、グラフを置く位置を決めるため、max_entry_time = keepで保定時間の一番長い行を取得しておきます。
for row in sheet:でシートの行全体、for cell in row:で列全体を指定し、cell.number_format = "0.0"でセルの書式を小数点第一で揃えます。
グラフ作成
    #グラフの作成
    chart = ScatterChart()

    x_values = Reference(ws, min_row=start, min_col=1, max_row=end, max_col=1) #x軸(昇温時間)
    y_values = Reference(ws, min_row=start, min_col=2, max_row=end, max_col=2) #y軸(温度)

    graph = Series(y_values, x_values)
    chart.series.append(graph)

    ws.add_chart(chart, "D"+str(max_entry_time)) #チャートを保定終了時の行に表示

    wb.save(excel_name) #Excelファイルを保存
    mb.showinfo("", "Excelファイルを作成しました")
chart = ScatterChart()で散布図を、x_values = Reference(ws, min_row=start, min_col=1, max_row=end, max_col=1)でX軸に1列目を、y_values = Reference(ws, min_row=start, min_col=2, max_row=end, max_col=2)でY軸に2列目を指定します。
graph = Series(y_values, x_values)でX軸とY軸を指定し、chart.series.append(graph)で追加します。
最後にws.add_chart(chart, "D"+str(max_entry_time))で、D列(4列目)の保定終了時の行にグラフを配置し、ファイルを保存して終了です。
GUIの作成
# GUIの作成
if __name__ == "__main__":
    root = tk.Tk()
    root.title("CSVをExcelに変換")

    #frame1
    frame1 = tk.LabelFrame(root, text="ファイルを選択")
    frame1.grid(row=0, columnspan=2, sticky="we", padx=5)

    #選択ボタン
    select_button = tk.Button(frame1, text="選択", command=select_file, width=10)
    select_button.grid(row=0, column=3)

    #ファイルパスの表示
    file1 = tk.StringVar()
    file1_entry = tk.Entry(frame1, textvariable=file1, width=35)
    file1_entry.grid(row=0, column=2, padx=5)

    #frame2
    frame2 = tk.LabelFrame(root, text="条件")
    frame2.grid(row=1, sticky="we")

    #狙い温度のテキスト
    text_temp = tk.Label(frame2, text="狙い温度(℃)", width=20)
    text_temp.grid(row=0, column=0, padx=5)

    #保定時間のテキスト
    text_time = tk.Label(frame2, text="保定時間(秒):複数指定可", width=25)
    text_time.grid(row=0, column=1)

    #実行ボタン
    action_button = tk.Button(frame2, text="実行", command=make_excel, width=15)
    action_button.grid(row=3, column=0)

    #狙い温度の入力欄
    entry_temp = tk.Entry(frame2, width=15)
    entry_temp.grid(row=1, column=0, padx=5)

    #保定時間の入力欄
    entry_time1 = tk.Entry(frame2, width=15)
    entry_time1.grid(row=1, column=1, padx=5, pady=5)
    entry_time1.insert(tk.END, 0)

    entry_time2 = tk.Entry(frame2, width=15)
    entry_time2.grid(row=2, column=1, padx=5, pady=5)
    entry_time2.insert(tk.END, 0)

    entry_time3 = tk.Entry(frame2, width=15)
    entry_time3.grid(row=3, column=1, padx=5, pady=5)
    entry_time3.insert(tk.END, 0)

root.mainloop()
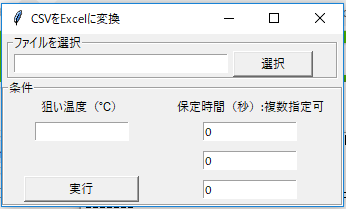
この画面を作成します。
構造としては、frame1の中に選択したファイルのパスを表示する欄と選択ボタン、frame2の中に狙い温度、保定時間を入力する欄と実行ボタンが配置してあります。
基本的には文章の場合はtk.Label、ボタンの場合はtk.Button、入力欄の場合はtk.Entryを指定し、gridで任意の場所に配置します。
ボタンを押した時の処理を追加する場合は引数comandに関数を指定し、入力欄に初期値を入れておきたい場合は.insertで値を指定します。
余談ですが、拡張子を.pywとすることでプログラムを起動したときの背景の黒い画面が表示されなくなります。
まとめ
今回は勉強も兼ねて普段の業務で自動化できそうなものを作成しましたが、業務自体を理解していることもありプログラム自体は比較的簡単に作ることができました。(2H/日×10日)
今後の進路を考える上で、こういったプログラムを企業に導入して業務を効率化するようなエンジニア(RPAエンジニア?)なども面白そうなので選択肢に入れてみようと思います。