この記事はGoogle Analytics 4ではなく、Universal Analyticsを対象としています。
Google Analyticsではクライアント側のNavigation Timing APIの値を1%程度にサンプリングした上で集計していて、8つの速度指標としてAnalyticsのレポートやBigQuery側で利用することができます。
この記事ではそれら指標がどのような形で設定されているのか、仕様を整理していきます。
Measurement Protocolのパラメータを確認
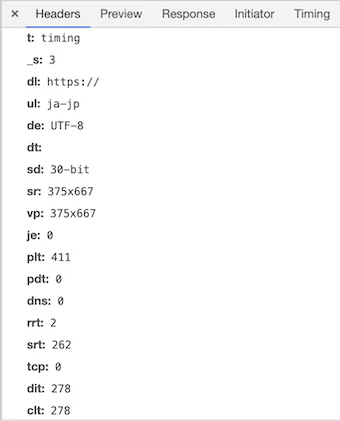
実際にどういったパラメータ名で送信しているのかログを確認してみます。
速度指標はtimingヒットとしてデフォルトでは1%程度の確率で送信されることになります。サンプリングされたままではパラメータの確認が困難ですので、フィールド設定で{'siteSpeedSampleRate': 100}とし、100%の確率で送信されるように変更してみます。
ga('create', 'UA-XXXX-Y', {'siteSpeedSampleRate': 100});
tパラメータをtiming、そしてpltやpdtなどの普段見慣れないパラメータが含まれていることが確認できました。
なお、パラメータリファレンスからもパラメータ名を確認することができます。
Measurement Protocol のパラメータ リファレンス | アナリティクス Measurement Protocol
値の算出方法を確認
次にそれぞれの値がどのように算出されているか確認します。
速度指標はクライアント側の値を利用していますので、https://www.google-analytics.com/analytics.js のコードにてNavigation Timing API関連の記述を参照してみます。
難読化されてはいますが以下のようなコード行が確認できました。
var c = b.navigationStart;
if (0 == c) return !1;
a[Eb] = b.loadEventStart - c;
a[Gb] = b.domainLookupEnd - b.domainLookupStart;
a[Jb] = b.connectEnd - b.connectStart;
a[Ib] = b.responseStart - b.requestStart;
a[Fb] = b.responseEnd - b.responseStart;
a[Hb] = b.fetchStart - c;
a[Kb] = b.domInteractive - c;
a[Lb] = b.domContentLoadedEventStart - c;
Eb = S("l1", "plt"),
Fb = S("l2", "pdt"),
Gb = S("l3", "dns"),
Hb = S("l4", "rrt"),
Ib = S("l5", "srt"),
Jb = S("l6", "tcp"),
Kb = S("l7", "dit"),
Lb = S("l8", "clt"),
この内容から以下のような対応関係になると推測できます。
| パラメータ | 意味 | 計算式 |
|---|---|---|
| plt | page load time | loadEventStart - navigationStart |
| pdt | page download time | domainLookupEnd - domainLookupStart |
| dns | dns lookup time | connectEnd - connectStart |
| rrt | redirection time | responseStart - requestStart |
| srt | server response time | responseEnd - responseStart |
| tcp | tcp connection time | fetchStart - navigationStart |
| dit | dom interactive time | domInteractive - navigationStart |
| clt | content load time | domContentLoadedEventStart - navigationStart |
なお、windowオブジェクトのperformance.timingに入っている各項目は時系列に沿って以下のようにセットされています。
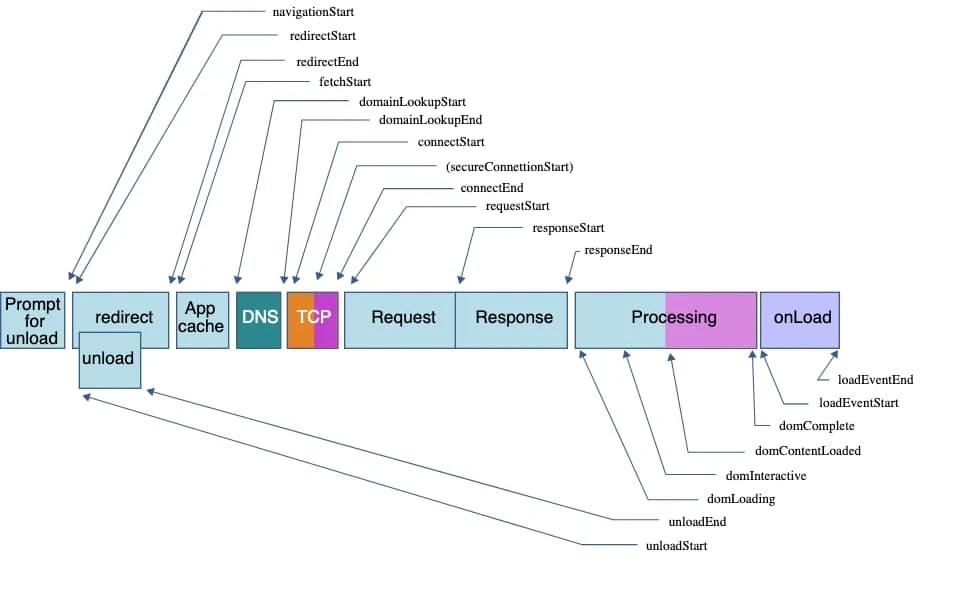
Measuring performance - Learn web development | MDN
各メトリクスを整理
以上の内容からパラメータ名と役割、そして指標の計算方法が把握ができましたので、8つの指標を改めて整理してみます。
Page Load Time (ms)
Total time (in milliseconds), from pageview initiation (e.g., a click on a page link) to page load completion in the browser, the pages in the sample set take to load.
- 日本語表記:
ページ読み込み時間 (ミリ秒) - Reporting API:
ga:pageLoadTime - Measurement Protocol Parameter:
plt - BigQueryフィールド:
hits.latencyTracking.pageLoadTime - analytics.js:
performance.timing.loadEventStart - performance.timing.navigationStart
Page Download Time (ms)
The total time (in milliseconds) to download this page among all samples.
- 日本語表記:
ページ ダウンロード時間 (ミリ秒) - Reporting API:
ga:pageDownloadTime - Measurement Protocol Parameter:
pdt - BigQueryフィールド:
hits.latencyTracking.pageDownloadTime - analytics.js:
performance.timing.domainLookupEnd - performance.timing.domainLookupStart
Domain Lookup Time (ms)
The total time (in milliseconds) all samples spent in DNS lookup for this page.
- 日本語表記:
ドメイン ルックアップ時間 (ミリ秒) - Reporting API:
ga:domainLookupTime - Measurement Protocol Parameter:
dns - BigQueryフィールド:
hits.latencyTracking.domainLookupTime - analytics.js:
performance.timing.connectEnd - performance.timing.connectStart
Redirection Time (ms)
The total time (in milliseconds) all samples spent in redirects before fetching this page. If there are no redirects, this is 0.
- 日本語表記:
リダイレクト時間 (ミリ秒) - Reporting API:
ga:redirectionTime - Measurement Protocol Parameter:
rrt - BigQueryフィールド:
hits.latencyTracking.redirectionTime - analytics.js:
performance.timing.responseStart - performance.timing.requestStart
Server Response Time (ms)
The total time (in milliseconds) the site's server takes to respond to users' requests among all samples; this includes the network time from users' locations to the server.
- 日本語表記:
サーバー応答時間 (ミリ秒) - Reporting API:
ga:serverResponseTime - Measurement Protocol Parameter:
srt - BigQueryフィールド:
hits.latencyTracking.serverResponseTime - analytics.js:
performance.timing.responseEnd - performance.timing.responseStart
Server Connection Time (ms)
Total time (in milliseconds) all samples spent in establishing a TCP connection to this page.
- 日本語表記:
サーバー接続時間 (ミリ秒) - Reporting API:
ga:serverConnectionTime - Measurement Protocol Parameter:
tcp - BigQueryフィールド:
hits.latencyTracking.serverConnectionTime - analytics.js:
performance.timing.fetchStart - performance.timing.navigationStart
Document Interactive Time (ms)
The time (in milliseconds), including the network time from users' locations to the site's server, the browser takes to parse the document (DOMInteractive). At this time, users can interact with the Document Object Model even though it is not fully loaded.
- 日本語表記:
サーバー接続時間 (ミリ秒) - Reporting API:
ga:domInteractiveTime - Measurement Protocol Parameter:
dit - BigQueryフィールド:
hits.latencyTracking.domInteractiveTime - analytics.js:
performance.timing.domInteractive - performance.timing.navigationStart
Document Content Loaded Time (ms)
The time (in milliseconds), including the network time from users' locations to the site's server, the browser takes to parse the document and execute deferred and parser-inserted scripts (DOMContentLoaded). When parsing of the document is finished, the Document Object Model (DOM) is ready, but the referenced style sheets, images, and subframes may not be finished loading. This is often the starting point of Javascript framework execution, e.g., JQuery's onready() callback.
- 日本語表記:
ドキュメント コンテンツ読み込み時間 (ミリ秒) - Reporting API:
ga:domContentLoadedTime - Measurement Protocol Parameter:
clt - BigQueryフィールド:
hits.latencyTracking.domContentLoadedTime - analytics.js:
performance.timing.domContentLoadedEventStart - performance.timing.navigationStart
可視化の方法
Google Analytics
各パフォーマンス指標には平均値のディメンションが用意されているので、この値を使えばカスタムレポートでもCoreReportingAPI経由でも平均値で可視化することができます。
例えば カスタムレポートで任意のページのサーバーレスポンスを可視化する場合には以下のような形になります。


BigQuery/データポータル
平均値だけでなく50パーセンタイル(中央値)や90パーセンタイル、あるいは分散といった統計量で可視化したい場合には BigQuery(データ抽出・データ加工)やデータポータル(データ加工・可視化)を利用することもできます。
SELECT
  date,
  latencyTracking.serverResponseTime
FROM
  `project_name.dataset_name.ga_sessions_*`,
  UNNEST(hits) AS hits
WHERE
  REGEXP_CONTAINS(hits.page.pagePath, "example.com/dir/")
  AND latencyTracking.serverResponseTime IS NOT NULL
  AND _table_suffix BETWEEN "YYYYMMDD"
  AND "YYYYMMDD"
BigQueryのクエリ結果の画面からデータを探索を押せば、そのままデータポータル側で可視化することができます。
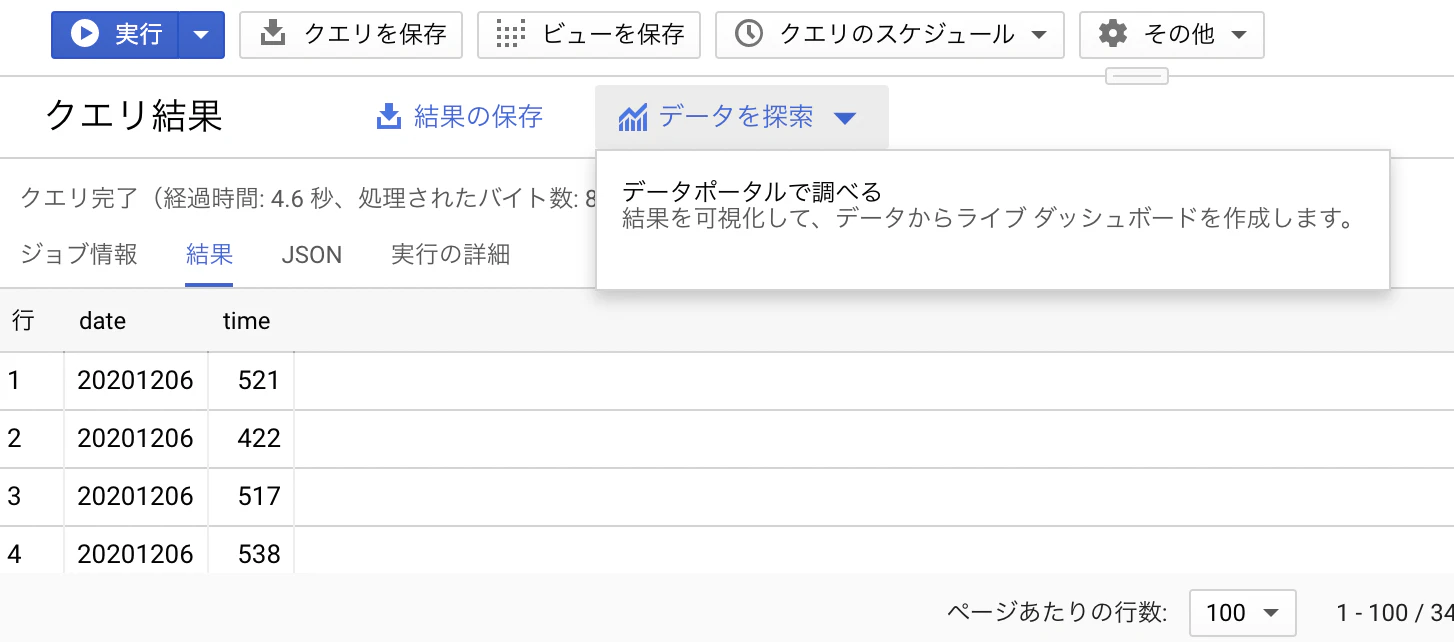
以下の例では日毎のサーバ応答時間の中央値を可視化しています。

アドホックな分析ではBigQuery + データポータルの組み合わせがストレスなくて快適です。
速度指標をどう活用するか
RUM(Real User Measurement)としてのパフォーマンス指標は、例えば以下のような形で私自身も実際の業務に役立てています。
障害モニタリング
障害発生時にクライアント起点での検知が可能になりますので、クライアント側の影響範囲が実際にどの程度のものだったか把握することができます。
問い合わせの対応
お客様から「ページの表示が遅い」といった問い合わせをいただいた場合に、カスタムディメンションにセットしているuidと速度指標を突合することで「原因がサーバサイド/インフラ(サーバー応答時間)にあったのか」など、問題の切り分けや状況把握できるようになります。
※デフォルトでは1%程度のサンプリング値となっていますので、そのままでは突合が困難です。割合を100%に切り替えたいところですがサイトの規模が大きい場合にはどうしてもサンプリングが発生しますので、自前で window.peformance.timingの値をカスタム指標にセットする必要があります。
timing タイプのヒットには、gtag.js、ga.js、analytics.js によって自動的に送信されるサイトの速度のヒットを含めて、追加の制限が課されます。1 日に処理される timing タイプの最大ヒット数は、プロパティあたり 10,000 件またはプロパティでその日に処理されるページビュー合計数の 1% のいずれか大きい方です。これより少ないヒット数には追加の制限が適用されます。
Google アナリティクスのデータ収集上限 | ウェブ向けアナリティクス(analytics.js)
Google Analyticsでの速度指標の算出方法は analytics.jsの内容から判明していますので、同じ内容で実装すればサンプリング無しでの計測が可能になります。
例えばServer Response TimeをTag Managerを経由して計測するとしたら、以下のようなカスタムJavaScriptを設定してGoogle Analytics側にカスタム指標として渡すことになります。
function(){
    var ret = "(not_set)"
    var perfData = window.performance.timing;
    if(perfData.responseEnd && perfData.requestStart){
         ret = perfData.responseEnd - perfData.requestStart;
    }
    return ret;
}
※ここではカスタムJavaScriptの中で計算していますが、計算せずに値をそのままGoogleAnalytics側に送り、「計算指標」として処理することも可能です。
計算指標 [ベータ版] について - アナリティクス ヘルプ
おわりに
サンプリングされているとはいえ重要な指標がデフォルト設定で収集されているため、気軽に実測値(RUM)の各統計量を可視化することができます。Core Web Vitalまでの値にはなりませんが、これだけでも十分UX改善に役立ちそうですね。