今更ながら,Kmeansを簡単に試してみます.
ライブラリ
importしたのはこれ
from random import randint

from sklearn.cluster import KMeans
from sklearn.decomposition import PCA
import numpy as np

import matplotlib.pyplot as plt
データセットの生成に乱数が欲しかったので,randint
データをプロットするのに,3次元特徴を2次元にしたかったのでPCAを使ってます.
データの用意
今回はデータセットとして,RGB値を乱数で生成するようにした.
def create_data(num):
    data = np.empty((0,3), int)
    for i in range(num):
        red = randint(0,256)
        blue = randint(0,256)
        green = randint(0,256)

        data = np.append(data, np.array([[red,blue,green]]), axis=0)

    return data

data = create_data(100)
create_data(<生成するデータ数>)で任意のサイズのデータセットを作成する関数を用いている.このコードではデータセットとして3次元の特徴が100個できる.
クラスタリング
生成したデータをKmeansモデルで分類する.
# kmeans clustering
CLUSTERS = 3
N_JOBS = 2

model = KMeans(n_clusters=CLUSTERS, n_jobs=N_JOBS).fit(data)

print(model.labels_)
今回は,クラスタ数3でクラスタリングする.N_JOBSは用いるCPUのコア数を示している.model.labels_で各データのクラスタ番号をリストにしている.
結果出力
今回2次元画像として出力したいので,主成分分析によって3次元特徴を2次元に削減する
ことができる.
次元削減
# 3次元特徴を2次元にする
pca = PCA(n_components=2)
pca.fit(data)
pca_data = pca.fit_transform(data)
n_componentsで何次元に削減するかを指定することができる.削減後のデータはpca_dataに格納されている.
実際にプロット
color = ["red", "blue", "green"]

# クラスタリング結果のプロット
plt.figure()
for i in range(pca_data.shape[0]):
    plt.scatter(pca_data[i,0], pca_data[i,1], c=color[int(model.labels_[i])])

# 生データのプロット
plt.figure()
for j in range(pca_data.shape[0]):
    color = tuple((round(data[j][0]/256, 3), round(data[j][1]/256, 3), round(data[j][2]/256, 3)))

    plt.scatter(pca_data[j,0], pca_data[j,1], c=color)

plt.show()
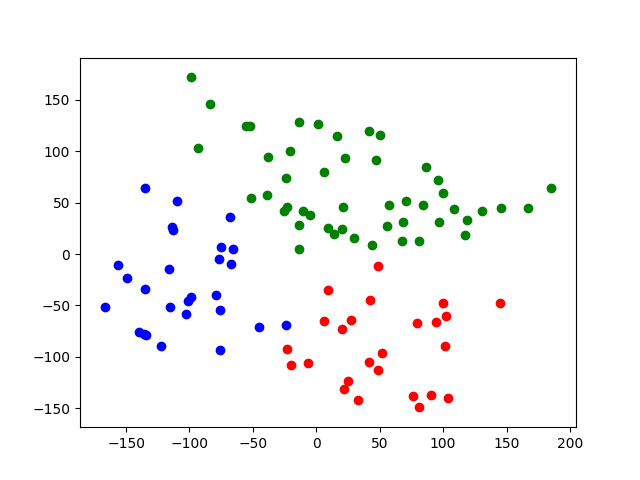
最初にクラスタリング結果をプロットしている.次元削減後のデータの1次元目をxに2次元目のデータをyにして,model.label_には0~2のクラスになっているのでリストcolorがクラス番号に対応している.
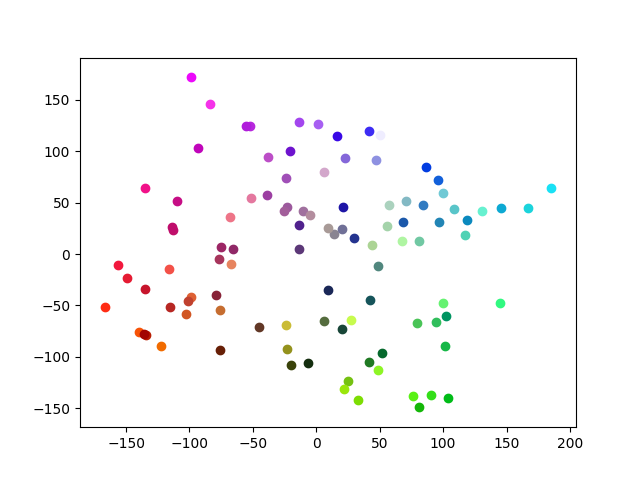
2個目のplt.figure()では,生データをそのままの色でプロットしている.ただ問題は,pltのプロットでは,RGB値が0~1である必要があるため,元のRGB値を256で割っている.後は,小数第3位で丸め込んでいる.
今回は,比較的綺麗にクラスタリングすることができた.
まとめ
今回は,分かりやすいように色を用いてKmeansを試してみた.
単純なデータだったので,綺麗にクラスタリングできた.
Source Code

