表示しているテーブルデータをDownloadしたい
dash communityのdownload csvに関する話題のなかで、以下のようなアナウンスがありました.
A recent version of the dash_table.DataTable has a built-in export table feature as well, so if you display your modified data as a DataTable component, you could get the export functionality “for free”.
dash_tableにExport機能が追加されたみたいなので、試してみます.
目標
- 表示しているテーブルのデータをDownloadできるアプリケーションを作ります.
- まずシンプルなアプリを作って、最終的に少し見た目を整えたものを作ってみます.
成果物イメージ

環境
- OS : macOS Mojave Version 10.14.6
- Python : Python 3.6.1
- dash == 1.3.1
- dash-core-components == 1.2.1
- dash-html-components == 1.0.1
- dash-table == 4.3.0
方法
-
dash_tableの引数にexportを追加します. -
最終的にフォルダ構成は↓のようになります.
dash_export_table/.
├── app.py
└── data
    └── iris.csv
データ準備
何でも良いですが、irisデータセットを用意します.
mkdir data
curl https://gist.githubusercontent.com/curran/a08a1080b88344b0c8a7/raw/639388c2cbc2120a14dcf466e85730eb8be498bb/iris.csv > data/iris.csv
tableを表示するアプリを用意
- まずは簡単な、dropdownで表示するテーブルの行を制限するアプリを用意します.
app.py
import dash
import dash_table
import pandas as pd
import dash_html_components as html
import dash_core_components as dcc
from dash.dependencies import Input, Output

df = pd.read_csv('data/iris.csv')

app = dash.Dash(__name__)

app.layout = html.Div(
    children=[
        html.H1("Dash app with export dataset"),
        dcc.Dropdown(
            id='my-dropdown',
            options=[
                {'label': 'setosa',
                 'value': 'setosa'},
                {'label': 'versicolor',
                 'value': 'versicolor'},
                {'label': 'virginica',
                 'value': 'virginica'}
            ], value='setosa'
        ),
        html.Div(id='output-container', style={"margin": "5%"})
    ]
)


@app.callback(
    Output('output-container', 'children'),
    [Input('my-dropdown', 'value')])
def input_triggers_spinner(value):
    df_filtered = df[df["species"] == value]
    output_table = dash_table.DataTable(
        id='table',
        columns=[{"name": i, "id": i} for i in df.columns],
        data=df_filtered.to_dict('records'),
    )
    return output_table


if __name__ == '__main__':
    app.run_server(debug=True)
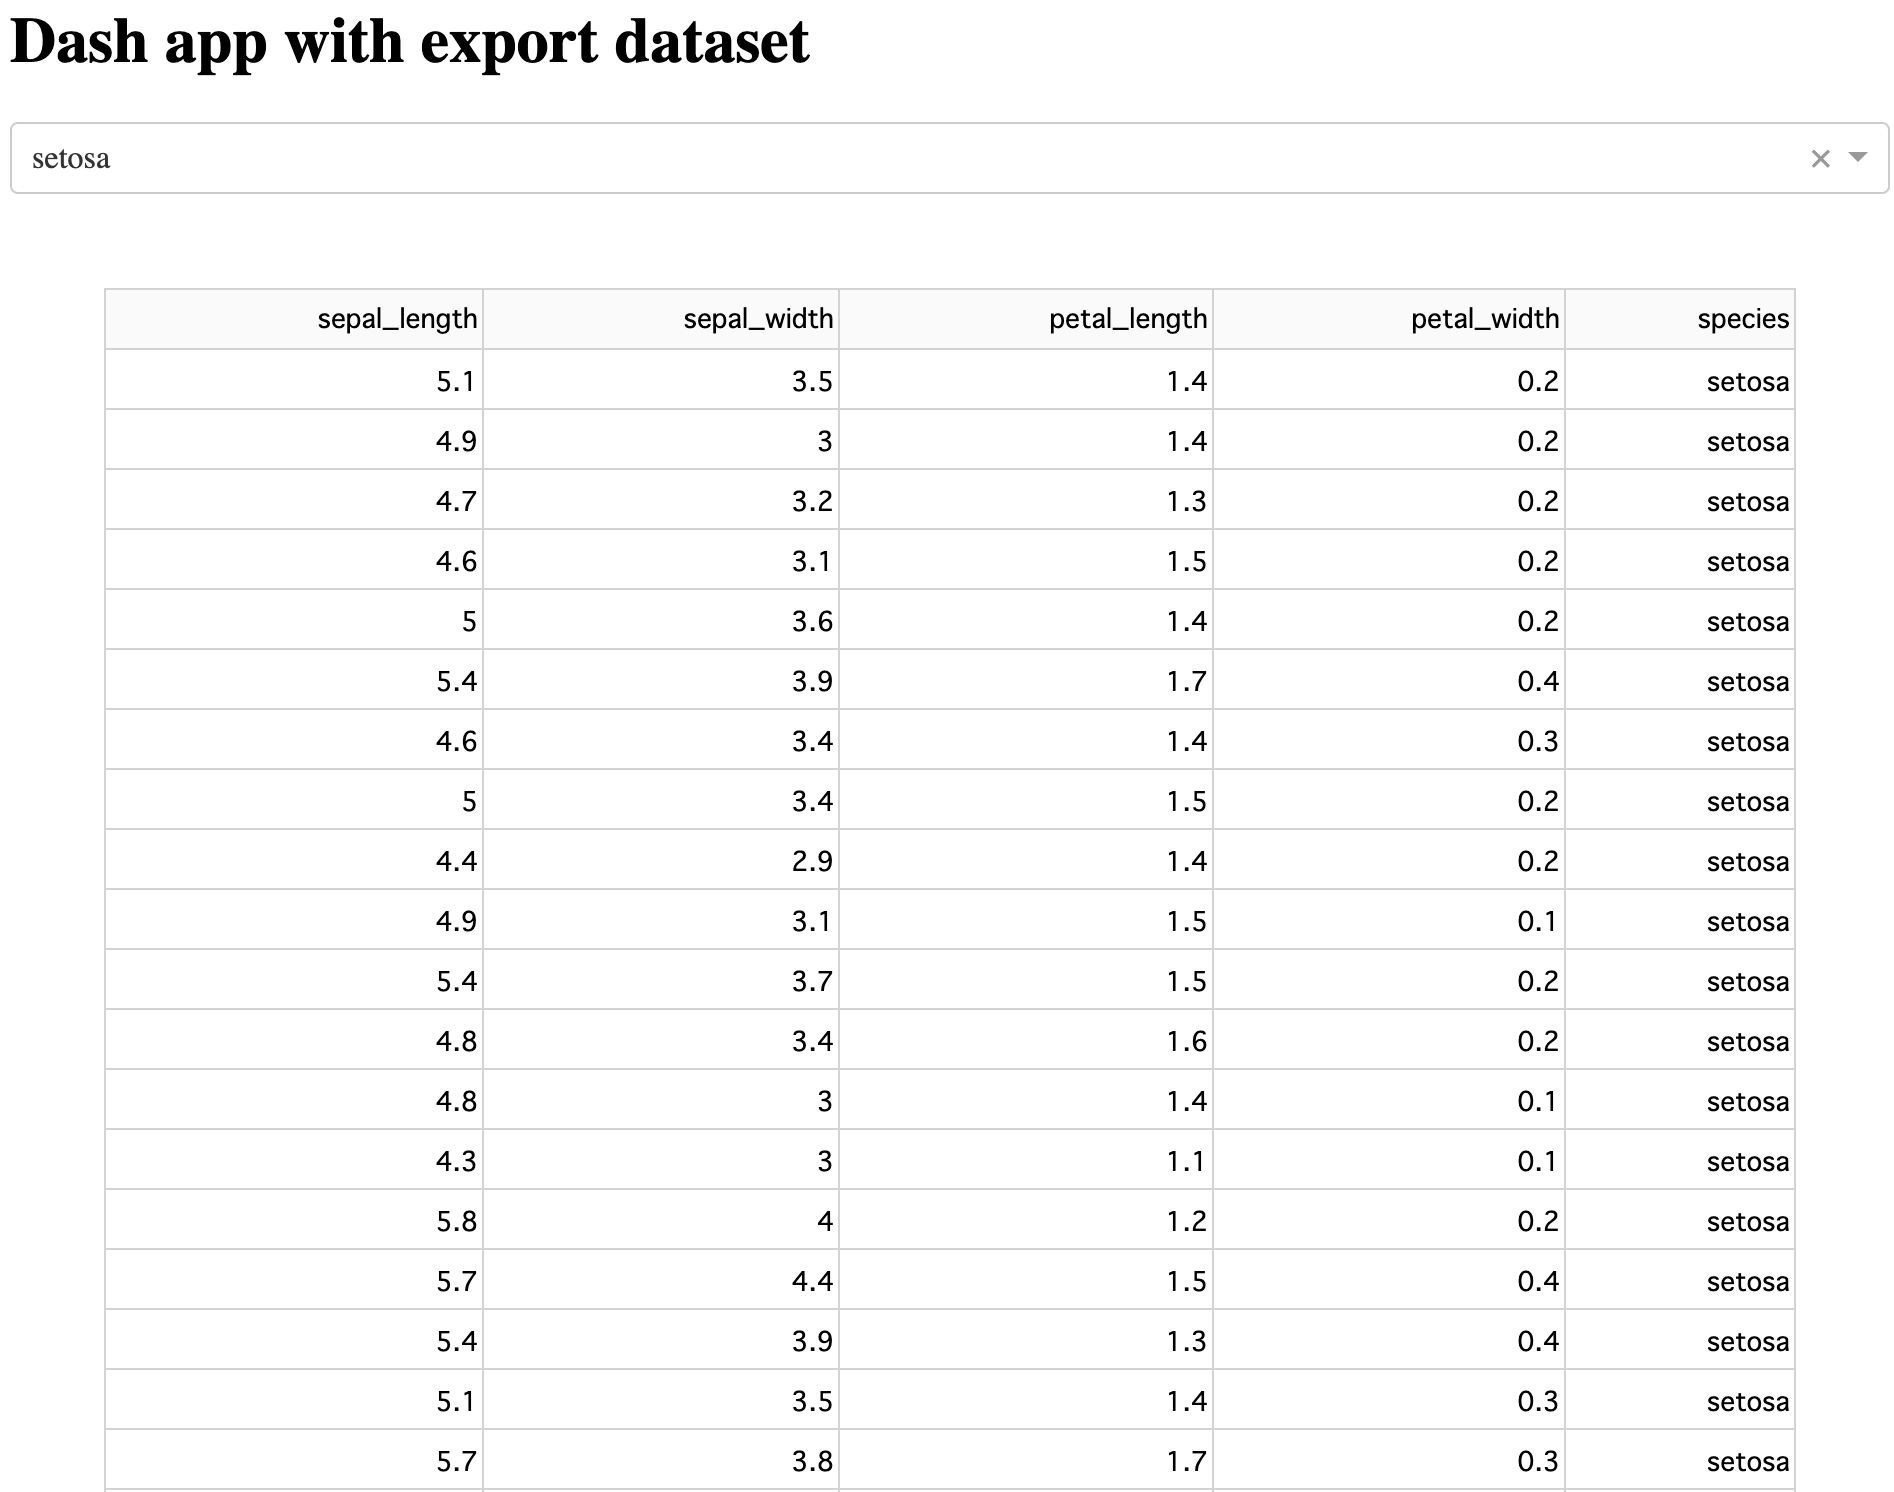
現時点では↓のようなシンプルなアプリです.
export_format='csv',を追加する
-
DataTable()の引数に追加します.
app.py
import dash
import dash_table
import pandas as pd
import dash_html_components as html
import dash_core_components as dcc
from dash.dependencies import Input, Output

df = pd.read_csv('data/iris.csv')

app = dash.Dash(__name__)

app.layout = html.Div(
    children=[
        html.H1("Dash app with export dataset"),
        dcc.Dropdown(
            id='my-dropdown',
            options=[
                {'label': 'setosa',
                 'value': 'setosa'},
                {'label': 'versicolor',
                 'value': 'versicolor'},
                {'label': 'virginica',
                 'value': 'virginica'}
            ], value='setosa'
        ),
        html.Div(id='output-container', style={"margin": "5%"})
    ]
)


@app.callback(
    Output('output-container', 'children'),
    [Input('my-dropdown', 'value')])
def input_triggers_spinner(value):
    df_filtered = df[df["species"] == value]
    output_table = dash_table.DataTable(
        id='table',
        columns=[{"name": i, "id": i} for i in df.columns],
        data=df_filtered.to_dict('records'),
        export_format='csv',
    )
    return output_table


if __name__ == '__main__':
    app.run_server(debug=True)
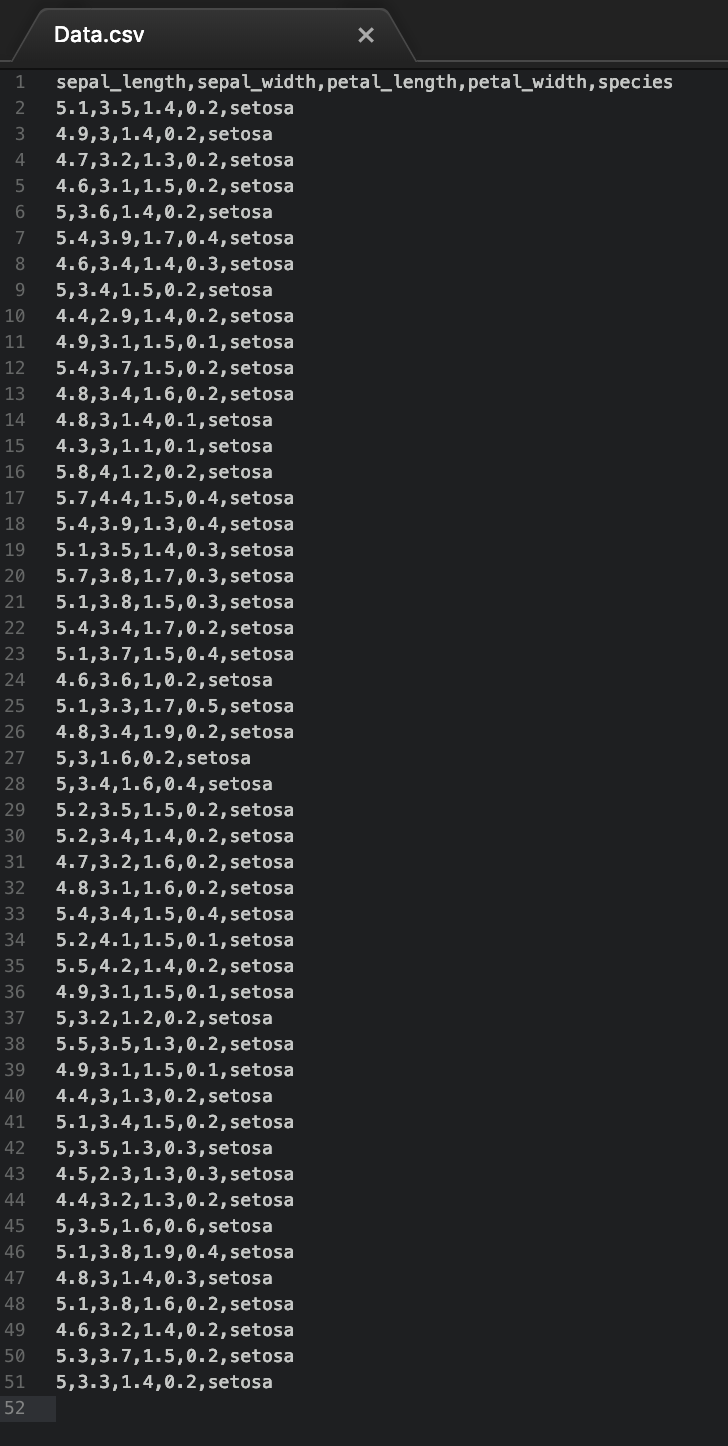
- Exportボタンが登場します. ボタンをクリックすると、現在表示されているテーブルのデータをDownloadすることができます.
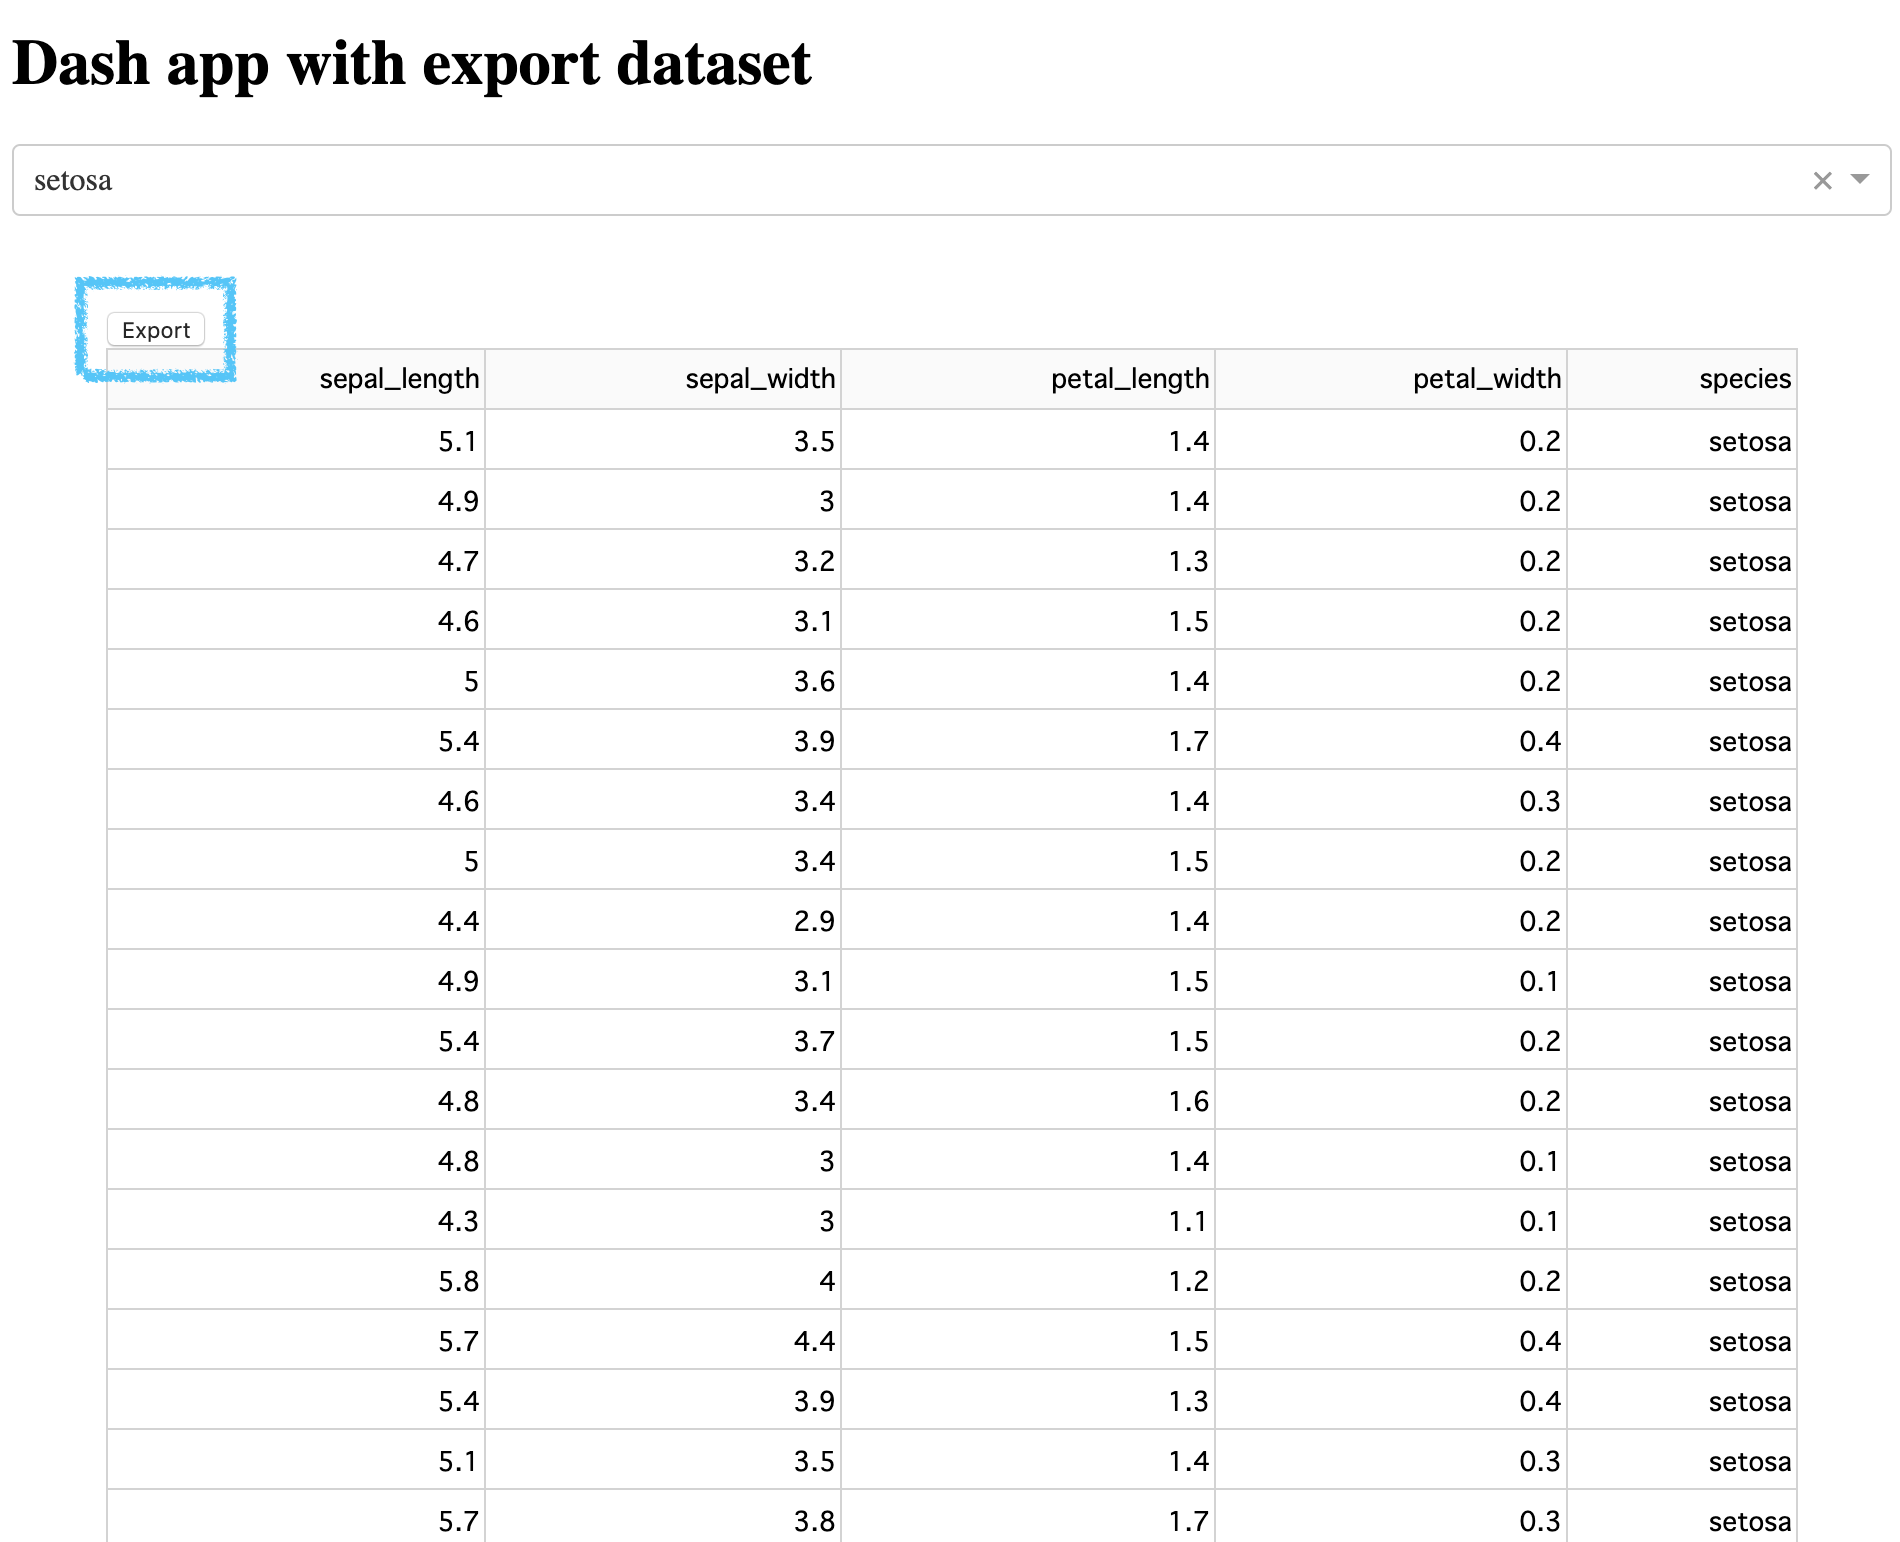
- species = "setosa"の行のデータがDLされます
少し整える
-
少しだけ見た目整えてみます.
- テーブルをリスト表示に変更
style_as_list_view=True,Styling the DataTable - headerを固定
fixed_rows={ 'headers': True, 'data': 0 },DataTable Sizing - loadingアニメーションを追加 outputをLoading Componentで囲む
- テーブルをリスト表示に変更
-
見た目ではないですが、Exportの形式をxlsxに変えてみます.
app.py
import dash
import dash_table
import pandas as pd
import dash_html_components as html
import dash_core_components as dcc
from dash.dependencies import Input, Output

df = pd.read_csv('data/iris.csv')

app = dash.Dash(__name__)
common_style = {'position': 'relative', 'width': '100%',
                'font-family': 'Dosis', 'text-align': 'center'}

app.layout = html.Div(
    children=[
        html.H1("Dash app with export csv", style={'margin-bottom': '3%'}),
        dcc.Dropdown(
            id='my-dropdown',
            options=[
                {'label': 'setosa',
                 'value': 'setosa'},
                {'label': 'versicolor',
                 'value': 'versicolor'},
                {'label': 'virginica',
                 'value': 'virginica'}
            ],
            value='setosa',
            style={'margin-bottom': '8%'}
        ),
        dcc.Loading(id="loading-1",
                    children=[
                        html.Div(id='output-container',
                                 )
                    ],
                    style={"margin": "10%"},
                    type="default"),
    ],
    style=common_style
)

@app.callback(
    Output('output-container', 'children'),
    [Input('my-dropdown', 'value')])
def input_triggers_spinner(value):
    df_filtered = df[df["species"]==value]
    output_table = dash_table.DataTable(
            id='table',
            columns=[{"name": i, "id": i} for i in df.columns],
            data=df_filtered.to_dict('records'),
            # リスト表示にします
            style_as_list_view=True,
            # headerを固定してスクロールできるようにします
            fixed_rows={ 'headers': True, 'data': 0 },
            # exportするフォーマットを指定(csv or xlsx)
            export_format='xlsx',
        )
    return output_table

if __name__ == '__main__':
    app.run_server(debug=False)
これで最初のgifが再現できます.
おわりに
以前からデータExport機能についてはCommunityで議論されていましたが、ついに公式でサポートしてくれたみたいです.
Dash communityに感謝しつつ、ご紹介させていただきました.
皆さんも是非お試しください.
参考
Is it possible to upload, edit then download csv files with dash? (python)