動作イメージとサンプルページ
下図のように、マップアプリケーションの画面中央部分にレーダーのようなアイコンを表示し、そのアイコンの場所にある地物情報を左下のリストに自動表示する機能を実装します。
この例では非地理情報を使っていますが、地理情報に基づくウェブマップでも同様です。
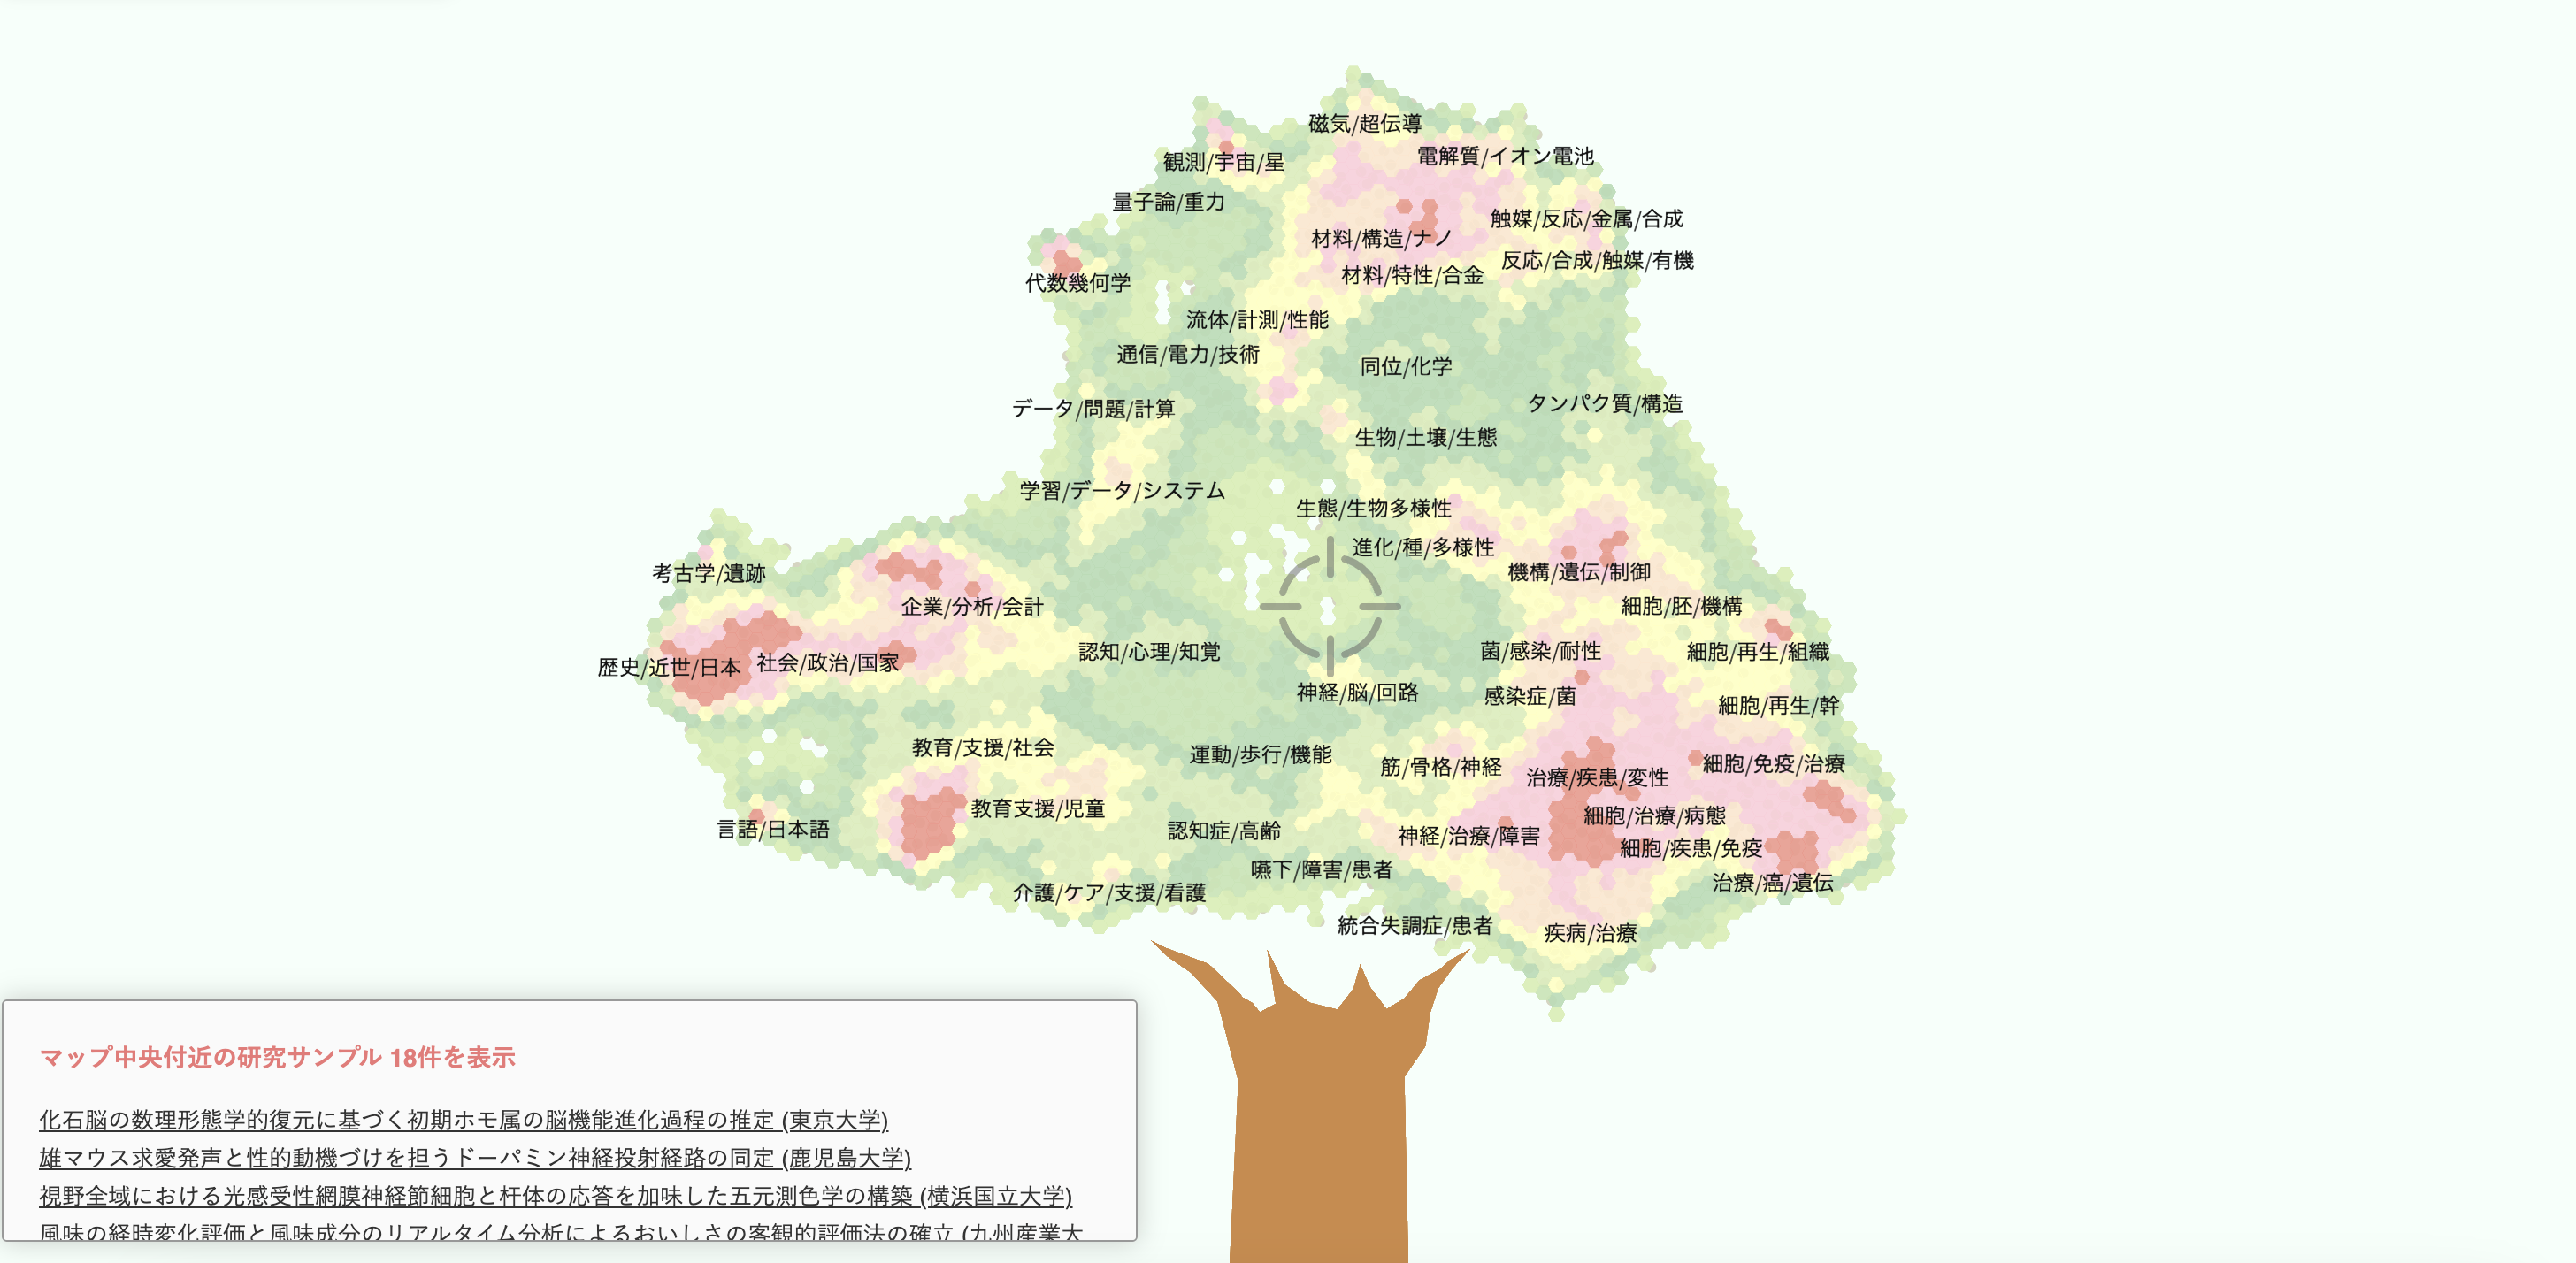
サンプルページはこちらのリンクから動作確認ができます。
(日本の科研費情報5万件を分散表現により可視化した非地理情報のマップになります。)
コード実装
HTML、CSS、JavaScriptの各部分についてコード例を示します。
前提として、ウェブマップを機能させるためのJavaScriptライブラリはMapLibre GL JSを使っています。
HTML
<html lang="ja">
    <head>
        <!--ヘッダー-->
    </head>
    <body>
        <div id="map"></div><!--マップ要素-->
        <div id="feature-list" class="list-overlay"></div><!--リスト表示要素-->
        <div id="icon-center" class="crosshair"><!--画面中央部のアイコンをSVGで描画-->
            <svg focusable="false" width="100px" height="100px" viewBox="-0.5 0 25 25" fill="none" xmlns="http://www.w3.org/2000/svg">
                <path d="M21.5001 12.5H16.5601" stroke="rgba(100,100,100,0.5)" stroke-miterlimit="10" stroke-linecap="round" stroke-linejoin="round"/>
                <path d="M7.44 12.5H2.5" stroke="rgba(100,100,100,0.5)" stroke-miterlimit="10" stroke-linecap="round" stroke-linejoin="round"/>
                <path d="M12 22V17.06" stroke="rgba(100,100,100,0.5)" stroke-miterlimit="10" stroke-linecap="round" stroke-linejoin="round"/>
                <path d="M12 7.94V3" stroke="rgba(100,100,100,0.5)" stroke-miterlimit="10" stroke-linecap="round" stroke-linejoin="round"/>
                <path d="M5.26001 10.5C5.93001 8.22 7.73001 6.41999 10.01 5.75999" stroke="rgba(100,100,100,0.5)" stroke-miterlimit="10" stroke-linecap="round" stroke-linejoin="round"/>
                <path d="M14.01 19.24C16.29 18.58 18.09 16.78 18.76 14.5" stroke="rgba(100,100,100,0.5)" stroke-miterlimit="10" stroke-linecap="round" stroke-linejoin="round"/>
                <path d="M5.26001 14.5C5.93001 16.78 7.73001 18.58 10.01 19.24" stroke="rgba(100,100,100,0.5)" stroke-miterlimit="10" stroke-linecap="round" stroke-linejoin="round"/>
                <path d="M14.01 5.75999C16.29 6.41999 18.09 8.22 18.76 10.5" stroke="rgba(100,100,100,0.5)" stroke-miterlimit="10" stroke-linecap="round" stroke-linejoin="round"/>
            </svg>
        </div>
        <script src="app/main.js"></script><!--MapLibreベースのJSファイル-->
    </body>
</html>
SVGのアイコン画像はSVG Repoから拝借しています。
見せ方によっては、このアイコンはHTMLではなくスクリプト側で地図上の画像アイコンとして表示しても良いかもしれません。
CSS
続いてスタイルシートの設定です。関連する部分のみ載せています。
#map {
    position: fixed;
    width: 100%;
    height: 100%
}

.list-overlay {
    position: absolute;
    overflow-y: scroll;
    max-height: 15%;
    width: 80%;
    max-width: 600px;
    bottom: 40px;
    left: 5px;
    padding: 8px 20px;
    background: rgba(250,250,250,0.9);
    box-shadow: 0 0 15px rgba(0,0,0,0.2);
    border-radius: 3px;
    border:1px solid #999;
    line-height: 20px;
}

.crosshair {
    position: absolute;
    top: 50%;
    left: 50%;
    transform: translate(-50%, -50%);
    pointer-events: none;
    z-index: 1;
}
マップを全画面に表示し、リストは左下に固定してスクロール可能にしておきます。中央部分のアイコンは画面中央に配置されるように設定します。
JavaScript (MapLibre)
そしてJSの記述部分です。これも関連する部分のみ説明します。
import * as maplibregl from "maplibre-gl";
import 'maplibre-gl/dist/maplibre-gl.css';
import './style.css';

//リストの内容を生成する
const listingPOl = document.getElementById('feature-list');
function renderListings(features) {
    const listingBox = document.createElement('p');
    listingPOl.innerHTML = '';

    if (features.length) {
        listingBox.textContent = 'マップ中央付近の地物 '+features.length+'件を表示';
        listingPOl.appendChild(listingBox);
        for (const feature of features) {
            //リストに載せる情報は適宜アレンジ。この例では各フィーチャのタイトルにリンクを貼って表示する。
            const itemLink = document.createElement('a');
            const label = `${feature.properties.title}`;
            itemLink.href = feature.properties.link;
            itemLink.target = '_blank';
            itemLink.textContent = label;
            listingPOl.appendChild(itemLink);
            listingPOl.append(document.createElement("br"));
        }
    } else {
        listingBox.textContent = 'マップ中央付近に地物がありません。';
        listingPOl.appendChild(listingBox);
    }
}

const map = new maplibregl.Map({
    //マップの呼び出し設定を記述
});

map.on('load', function () {
    //マップ情報の読み込み設定を記述

    //リスト生成
    function generateList () {
        const center = map.getCenter(); //まず画面中央の座標値を取得
        const point = map.project(center); //取得した座標値をピクセル座標値に変換
        //変換した座標値から一定範囲内をbbox指定(中央アイコンの大きさ等に応じて幅は調整)
        const bbox = [
            [point.x - 20, point.y - 20],
            [point.x + 20, point.y + 20]
        ];
        //MapLibreのqueryRenderedFeaturesを使ってbbox範囲内の地物情報を取得
        const extentPOI = map.queryRenderedFeatures(bbox, { layers: ['doc_point'] });
        renderListings(extentPOI); //bbox範囲内の地物情報をもとにリストを生成
    }

    map.on('moveend', generateList); //マップを動かすたびにリストを更新する
    map.zoomIn({duration: 1000}); //初期表示の時点でリスト生成を実施するための動作
});
リスト生成の部分は、Mapboxドキュメントの「マップビュー内のフィーチャをフィルター処理」を参考にアレンジしています。
ポイントは、MapLibreのqueryRenderedFeaturesにbboxを設定する際に、地図の座標値をそのまま使うのではなく、map.project()でピクセル座標値に変換してから範囲を指定していることです。
また、最初に表示された時点ではリスト生成の機能が作動せずリストが空の状態になるので、マップの各種データが読み込まれた時点でmap.zoomIn()を行い強制的にマップを動かします。これはマップ起動時の演出も兼ねています。
この機能のメリット
一般的なウェブ地図では、各地点の地物情報を表示する方法はマウスオーバーやクリック・タップによるポップアップ表示だと思います。
中央部の地物をリスト表示する機能を付けることで、いちいち場所をクリックする必要なく、マップを動かすだけで情報を見ることができるため、ユーザー側の快適さが向上します。
「地物の基本情報はリストで自動的に表示されるようにして、クリックするとポップアップで詳細な情報が見れる」という二段構えにすることがおすすめです。
留意点
MapLibreのqueryRenderedFeaturesはとても便利ですが、マップで描画されていない地物は対象に入りません。これは、ベクトルタイルで読み込んだ際にズームレベルに応じて間引きされた点についても同様なので、ベクトルタイルでポイントデータを描画している場合は留意する必要があります。
以上です。
コードは改善点があるかもしれませんが、参考になれば幸いです。