[Characteristic]
- Visualization tools are needed to understand ASCII data in the form of ASCII, and this program is software designed to accomplish this purpose.
[Function]
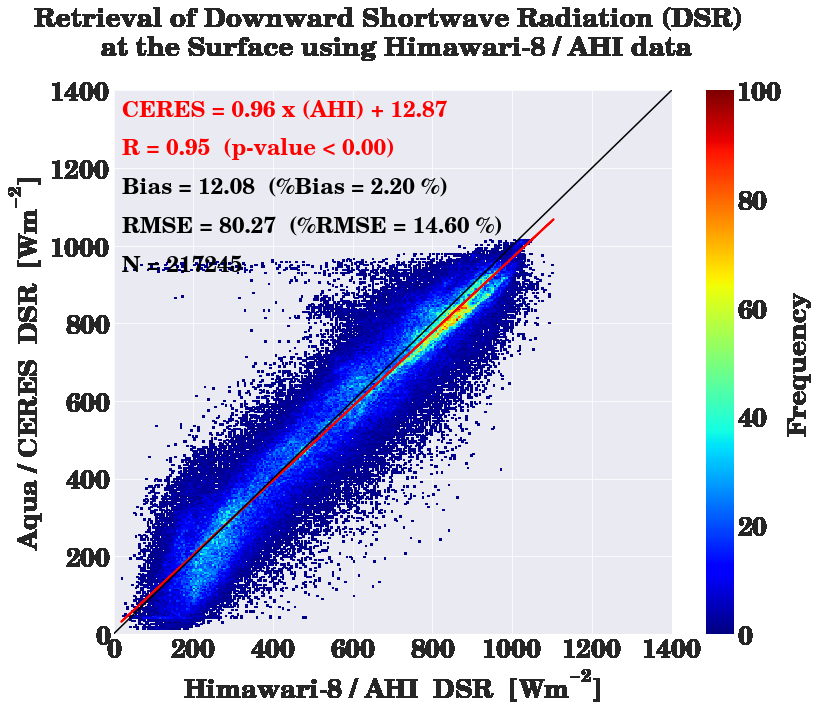
- Scatter plots using Himawari-8/AHI and Aqua/CERES data
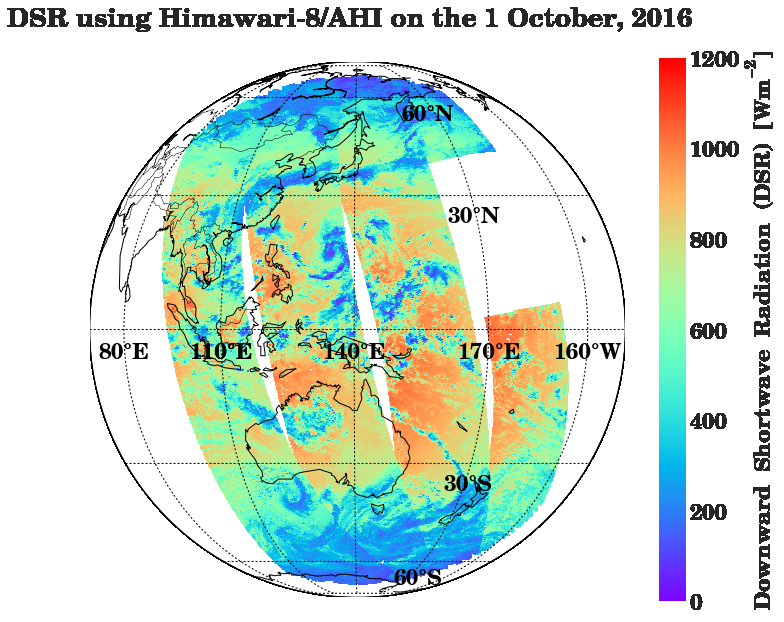
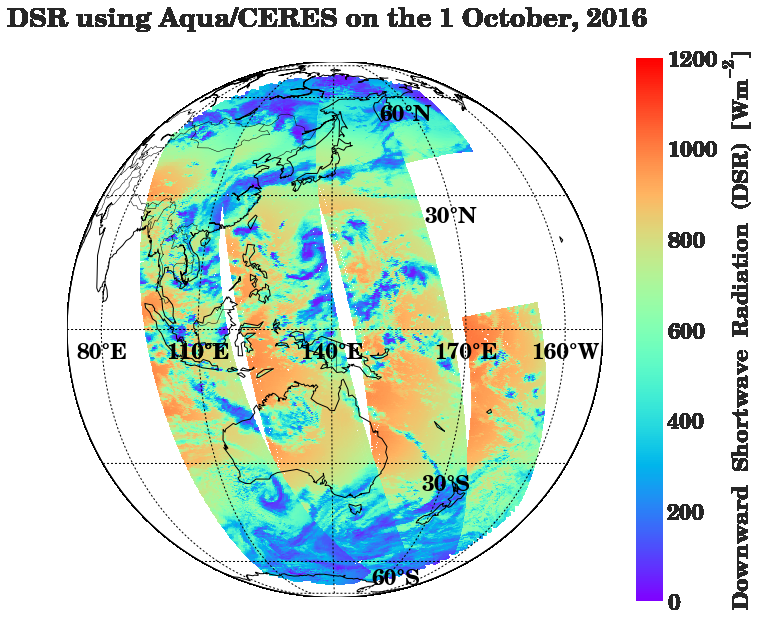
- Mapping with Himawari-8/AHI and Aqua/CERES Data
[Materials]
- Data : Spatio-temporal agreement with Himawari-8/AHI and Aqua/CERES
- Period : October 01, 2016
- Resolution : 2 km
[Method]
- None
[How to]
- Input Directory Same Directory Location
- Run the source code (run Jupyter notebook)
- Check the visualization result
[OS]
- Window 10
[Language]
- Python 2.7
[Source Code]
- Visualization Using ASCII Format of Himawari-8/AHI and Aqua/CERES Weather Satellite Data
- Visualization Using Binary Format of COMS/MI Weather Satellite Data
- MOHID Ocean circulation model mapping (file reading and function setting)
- Visualization of flow rate vectors, SST, and salinity using MOHID ocean circulation model results files.
- Visualization of flow rate vectors, SST, and salinity using MOHID ocean circulation model results files.
- Time series graph using radiometer brightness temperature data
- Visualization of Temperature and Humidity Contours by Elevation Using Radiometer and Radiosonde Observations
[Result]
- Downward Shortwave Radiation at the top of the Atmosphere Using Himawari-8/AHI Data
- Downward Shortwave Radiation (DSR) at ths Surface Using Aqua/CERES Data
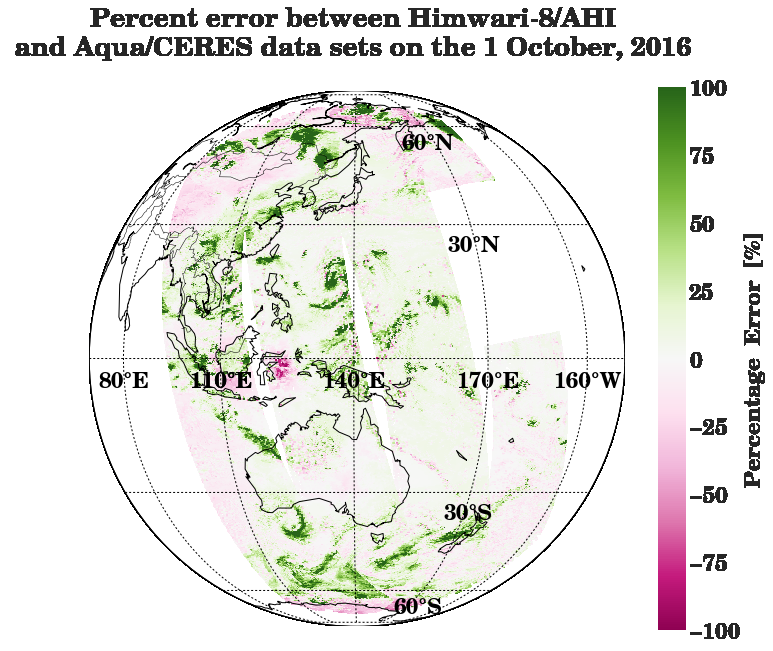
- Percent Error of Downward Shortwave Radiation (DSR) at ths Surface Using Himawari-8/AHI Data and Aqua/CERES Data
- Downward Shortwave Radiation (DSR) at the Surface Using Himawari-8/AHI and Aqua/CERES Data