もう少し詳細な記事をアップしました。 ===> Elm Svg と elm-visualization - Qiita
Elmでd3.jsを使うのにはどうするのだろう? 私はフロントエンドでは繊細なグラフを描きたいのです。長い期間にわたってd3.jsを習得中ですが、ちょっと独特なので忘れやすいです。などと調べていると、elm-visualizationというものを見つけました。公式サイトは以下にあり、exampleもそこにあります。
gampleman/elm-visualization(github) - A visualization package for Elm (D3-like)
このライブラリは強くD3 libraryに触発されたものだが、Elmが既にDOM抽象化を行っているので、セレクタを提供してはいない、とあります。またこのライブラリは開発中のものです。
今回はこのライブラリを動作させてみたので、その備忘録となります。それでは動かしてみましょう。
まずディレクトリを作成します。
mkdir elm-visualization
cd elm-visualization/
elm-package install gampleman/elm-visualization
githubのexampleを見ると、elm-package.jsonにもっとdependenciesが必要なようです。コピーして以下のようにします。
{
    "version": "1.0.0",
    "summary": "helpful summary of your project, less than 80 characters",
    "repository": "https://github.com/user/project.git",
    "license": "BSD3",
    "source-directories": [
        "."
    ],
    "exposed-modules": [],
    "dependencies": {
        "elm-lang/core": "5.1.1 <= v < 6.0.0",
        "elm-lang/html": "2.0.0 <= v < 3.0.0",
        "gampleman/elm-visualization": "1.6.1 <= v < 2.0.0",
        "elm-community/graph": "2.0.0 <= v < 3.0.0",
        "elm-community/intdict": "2.0.0 <= v < 3.0.0",
        "elm-community/list-extra": "6.1.0 <= v < 8.0.0",
        "elm-lang/animation-frame": "1.0.1 <= v < 2.0.0",
        "elm-lang/http": "1.0.0 <= v < 2.0.0",
        "elm-lang/mouse": "1.0.1 <= v < 2.0.0",
        "elm-lang/navigation": "2.1.0 <= v < 3.0.0",
        "elm-lang/svg": "2.0.0 <= v < 3.0.0",
        "eskimoblood/elm-color-extra": "5.0.0 <= v < 6.0.0",
        "justinmimbs/elm-date-extra": "2.0.1 <= v < 3.0.0",
        "mgold/elm-random-pcg": "5.0.0 <= v < 6.0.0",
        "folkertdev/one-true-path-experiment": "3.0.2 <= v < 4.0.0",
        "Zinggi/elm-webgl-math": "1.0.5 <= v < 2.0.0",
        "opensolid/geometry": "2.0.1 <= v < 3.0.0"
    },
    "elm-version": "0.18.0 <= v < 0.19.0"
}
一気にインストールします。
elm-package install
githubから2つのソースコードをダウンロードします。LineChart.elm と SampleData.elmです。SampleData.elmは大きいので掲載しませんが、LineChart.elmを以下に示します。(lineとareaがありましたが、areaは削除しました)
module LineChart exposing (main)

import Date exposing (Date)
import Svg exposing (..)
import Svg.Attributes exposing (..)
import Visualization.Axis as Axis exposing (defaultOptions)
import Visualization.List as List
import Visualization.Scale as Scale exposing (ContinuousScale, ContinuousTimeScale)
import Visualization.Shape as Shape
import SampleData exposing (timeSeries)


w : Float
w =
    900


h : Float
h =
    450


padding : Float
padding =
    30


xScale : ContinuousTimeScale
xScale =
    Scale.time ( Date.fromTime 1448928000000, Date.fromTime 1456790400000 ) ( 0, w - 2 * padding )


yScale : ContinuousScale
yScale =
    Scale.linear ( 0, 5 ) ( h - 2 * padding, 0 )


xAxis : List ( Date, Float ) -> Svg msg
xAxis model =
    Axis.axis { defaultOptions | orientation = Axis.Bottom, tickCount = List.length model } xScale


yAxis : Svg msg
yAxis =
    Axis.axis { defaultOptions | orientation = Axis.Left, tickCount = 5 } yScale


transformToLineData : ( Date, Float ) -> Maybe ( Float, Float )
transformToLineData ( x, y ) =
    Just ( Scale.convert xScale x, Scale.convert yScale y )


line : List ( Date, Float ) -> Attribute msg
line model =
    List.map transformToLineData model
        |> Shape.line Shape.monotoneInXCurve
        |> d


view : List ( Date, Float ) -> Svg msg
view model =
    svg [ width (toString w ++ "px"), height (toString h ++ "px") ]
        [ g [ transform ("translate(" ++ toString (padding - 1) ++ ", " ++ toString (h - padding) ++ ")") ]
            [ xAxis model ]
        , g [ transform ("translate(" ++ toString (padding - 1) ++ ", " ++ toString padding ++ ")") ]
            [ yAxis ]
        , g [ transform ("translate(" ++ toString padding ++ ", " ++ toString padding ++ ")"), class "series" ]
            [ Svg.path [ line model, stroke "red", strokeWidth "3px", fill "none" ] []
            ]
        ]

main =
    view timeSeries
ざっくり見ると、scaleを定義し、Axisを定義し、scaleで(x,y)を投射する関数を定義し、line関数を定義し、view関数を定義し、最後にviewにサンプルデータを与えて描画しています。多分ほとんどわかっていませんね。しかしd3.jsと違って、宣言的なコーディングになっていることは、はっきり感じられます。
index.htmlを書きます。
<!doctype html>
<html>
    <head>
    </head>
    <body>
        <div id="elm-area"></div>
        <script src="elm.js"></script>
        <script>
            Elm.LineChart.embed(document.getElementById("elm-area"));
        </script>
    </body>
</html>
コンパイルして、サーバを起動します。
elm-make LineChart.elm --output elm.js
elm-reactor -a=www.mypress.jp -p=3030
ブラウザで見ると以下のようなグラフを確認できます。
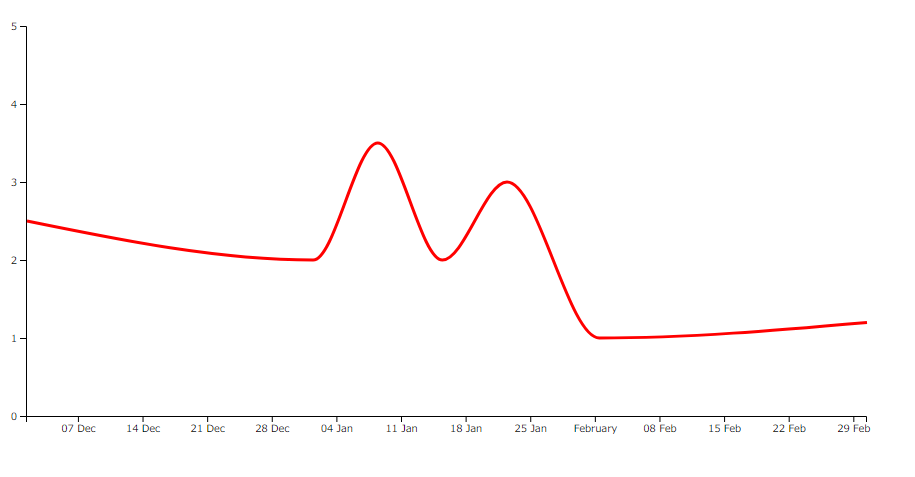
今回は、以上で終わります。elm-visualizationは現在開発中のものです。もっと他のものも調べてみたいのでハッキリわかりませんが、また取り上げるかもしれません。