この記事はAmazon EKS Advent Calendar 2019の23日目の記事になります。
OPENREC.tvの中の人でSREチームに所属しています。プロジェクトでkube-prometheusを使ってEKSでモニタリング環境を構築しましたので、その構築方法をまとめてみました。
kube-promethusとは
kube-prometheusはCoreOSによって開発されているプロジェクトであり、Prometheusを使ったKubernetesクラスターのモニタリングに必要となるコンポーネント用のマニフェストファイル一式を少ない手間で用意することができます。
kube-prometheusによって下記のコンポーネントのマニフェストファイルを作成することができます。
- Prometheus Operator
- 冗長構成のPrometheus
- 冗長構成のAleertmanager
- node-exporter
- Prometheus Adaptor
- kube-state-metrics
- Grafana
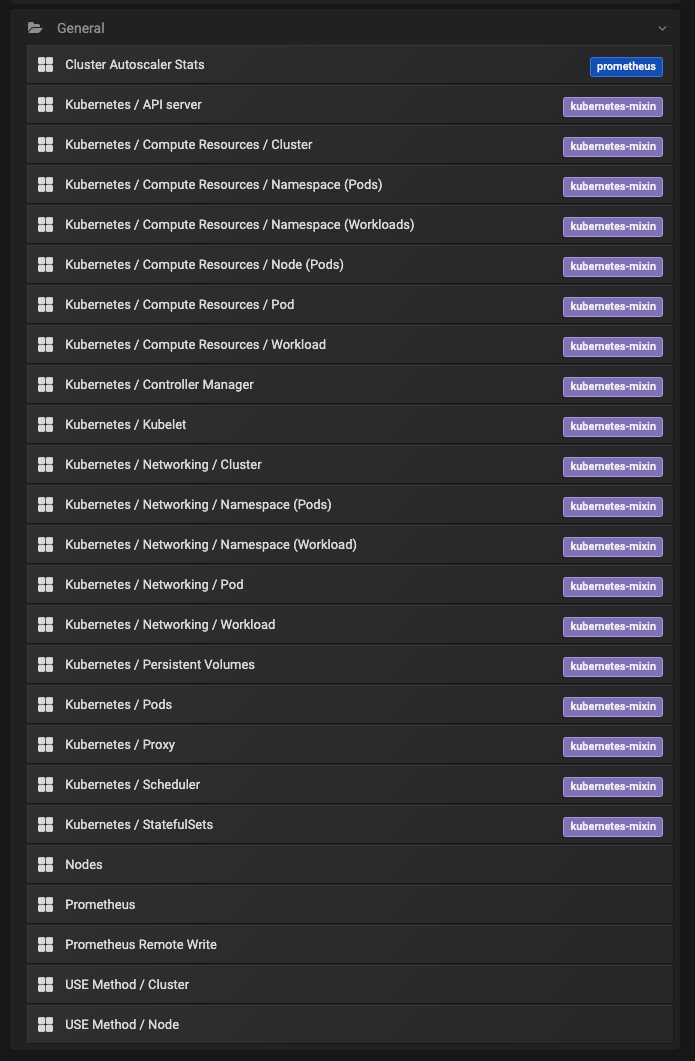
上記に加え、さらにKubernetesクラスターのモニタリングに必要となるGrafanaのダッシュボードとPrometheusのアラートのセットを提供しています。これらのGrafanaダッシュボードとPrometheusのアラートの多くはkubernetes-mixinのプロジェクトにあるものを使用して構成されています。
Grafanaのダッシュボードだと下記のように相当数組み込まれています(下記スクショの中でCluster Autoscaler Statsだけは独自に組み込んだものです)。
下記はPrometheusのkube-prometheusによって組み込まれたアラートルールの一部です。
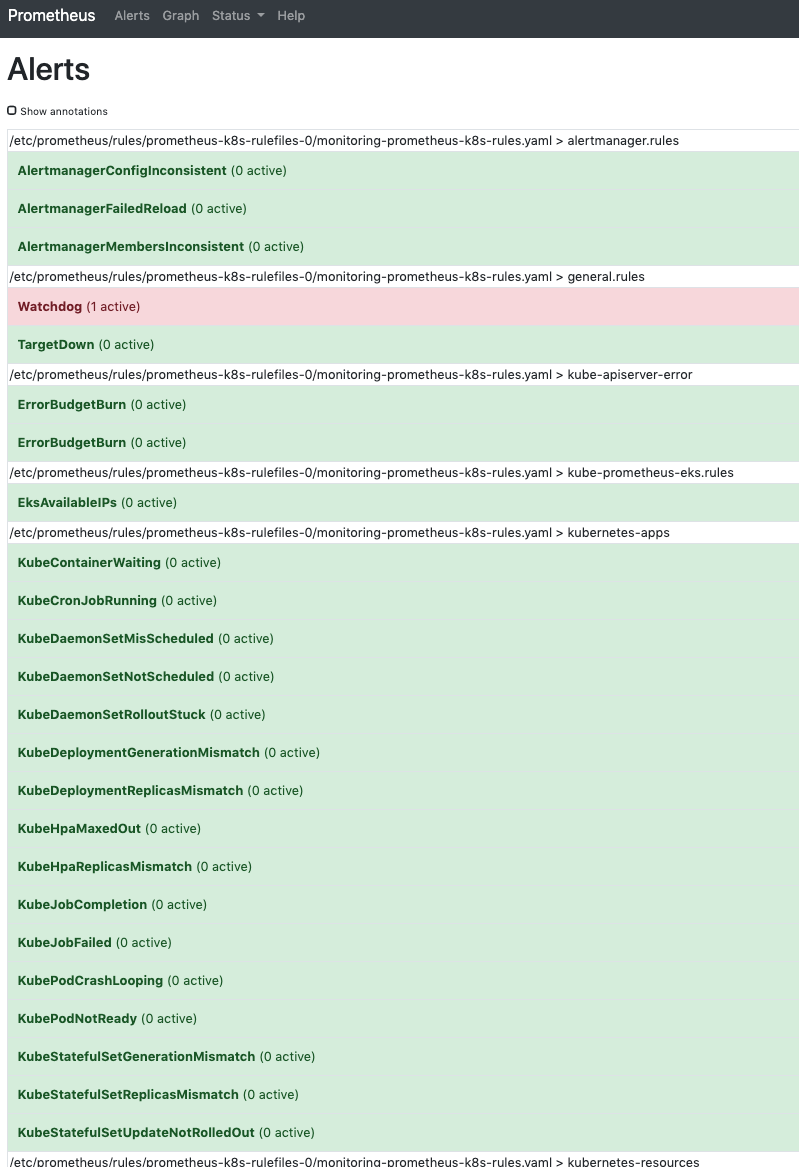
kube-prometheusを使うことでKubernetesクラスターを運用する際に必要となるGrafanaのダッシュボードやPrometheusのアラートルールを作成する手間を省けるのもkube-prometheusの魅力の一つです。
EKS用のkube-prometheusのカスタムプロジェクトの構成
カスタムプロジェクトを作成してkube-prometheusのjsonnetを拡張することで、EKSで稼働させるために必要なKubernetesリソースの追加などを行なっています。
このカスタムプロジェクトによって作成されるモニタリング環境のざっくり構成は下記となります。
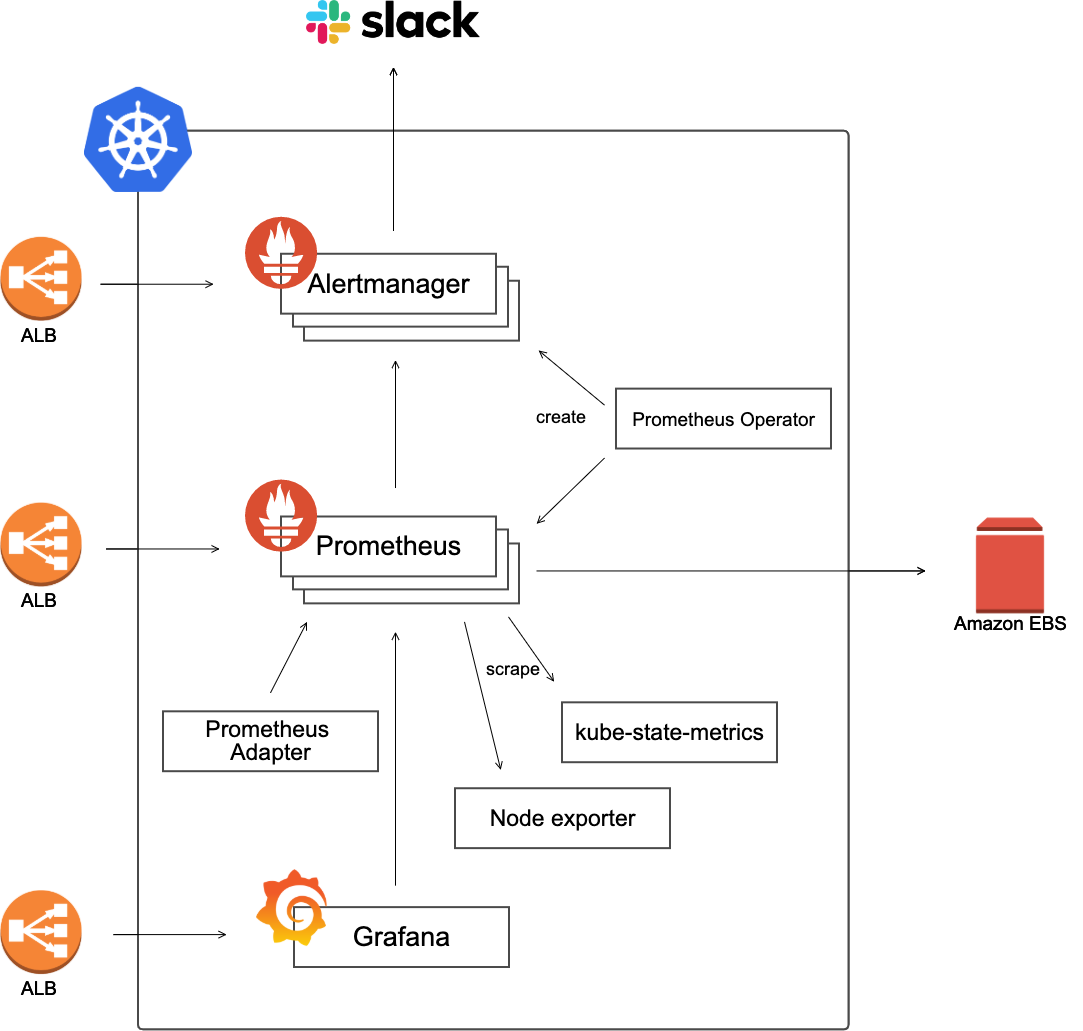
AlertmanagerとPrometheusはレプリカ数3の冗長構成となっています。
Prometheusが収集したメトリクスデータはAmazon EBSに保存しています。EBSはAZを跨いでアクセスすることができないため、マルチAZ構成の場合はPrometheusのレプリカ数は最低でもAZ数分用意するか、AZ数よりも少ない数のレプリカ数でPrometheusを運用する場合は、AffinityなどでPrometheusが配置されるAZを指定しておくよう注意が必要です。
Grafana, Prometheus, Alertmanager用のALBの作成はALB Ingress Controllerが行い、各ALBのDNSのAレコードの作成はExternalDNSが行っておりますので、ALB Ingress ControllerとExternalDNSが同一Kubernetesクラスター内で動いていることが前提のカスタムプロジェクトとなっています。
ファイル構成
カスタムプロジェクトのファイル構成は下記のようになっています。
.
├── base.libsonnet
├── build.sh
├── dev.jsonnet
├── stg.jsonnet
├── prd.jsonnet
├── jsonnetfile.json
├── jsonnetfile.lock.json
├── custom-dashboards
│   └── cluster-autoscaler-stats.json
├── vendor
│   ├── 省略(kube-prometheusと依存するプロジェクトのjsonnetファイル群)
└── manifests
    ├── dev
    │   ├── 省略(dev環境のマニフェストファイル)
    ├── stg
    │   ├── 省略(stg環境のマニフェストファイル)
    └── prd
        ├── 省略(prd環境のマニフェストファイル)
上記のファイルの内、jsonnetfile.jsonとjsonnetfile.lock.jsonは下記に示すカスタムプロジェクトの初期化の手順の際に出力されたファイルであり、パッケージマネージャーであるjsonnet-bundlerによって管理されているものになります。
$ jb init
$ jb install github.com/coreos/kube-prometheus/jsonnet/kube-prometheus@release-0.3
依存関係のあるjsonnetのプロジェクトのバージョンを更新したい場合には下記のコマンドを実行します。
$ jb update
以後、順を追ってカスタムプロジェクト内のファイルについて説明していきます。
まず、kube-prometheusのバージョンは0.3を指定しています。kube-prometheusのバージョンはjsonnetfile.jsonの中で指定します(release-0.3が指定しているバージョン)。
余談ですが、しばらくkube-prometheusのバージョン0.1を使って運用していましたが、バージョン0.3になってCoreDNSの監視用のServiceのマニフェストファイルが出力できるようになったり、Grafanaのダッシュボードが色々と増えてちょっとした感動を覚えました。
{
    "dependencies": [
        {
            "name": "kube-prometheus",
            "source": {
                "git": {
                    "remote": "https://github.com/coreos/kube-prometheus",
                    "subdir": "jsonnet/kube-prometheus"
                }
            },
            "version": "release-0.3"
        }
    ]
}
補足: kube-prometheusの依存プロジェクトのパッケージ管理について
kube-prometheusのプロジェクトはjsonnetで構成されており、さらに複数のgithubプロジェクトにあるjsonnetに依存しており、それらのjsonnetを組み合わせることでマニフェストファイルを構成しています。jsonnetのパッケージマネージャーにはjsonnet-bundlerを使用しており、上記のカスタムプロジェクトの初期化手順にあるjb installコマンドを実行することで、kube-prometheusと依存するプロジェクトのjsonnetファイル群がvendor配下にダウンロードされます。
カスタムプロジェクトのjsonnetファイルの構成
kube-prometheusのマニフェストファイルを拡張するために、base.libsonnetという名称のファイルを作成し、必要な要素を追加しています。
base.libsonnet
local k = import 'ksonnet/ksonnet.beta.3/k.libsonnet';
local secret = k.core.v1.secret;
local ingress = k.extensions.v1beta1.ingress;
local ingressRule = ingress.mixin.spec.rulesType;
local httpIngressPath = ingressRule.mixin.http.pathsType;
local limitRange = k.core.v1.limitRange;
local limitRangeItem = limitRange.mixin.spec.limitsType;
local pvc = k.core.v1.persistentVolumeClaim;
local sc = k.storage.v1.storageClass;

(import 'kube-prometheus/kube-prometheus.libsonnet') +
(import 'kube-prometheus/kube-prometheus-eks.libsonnet') +
(import 'kube-prometheus/kube-prometheus-node-ports.libsonnet') +
(import 'kube-prometheus/kube-prometheus-managed-cluster.libsonnet') +
{
  config:: {
    env: '',
    namespace: 'monitoring',
    urlProtocol: '',
    domain: '',
    subnets: '',
    grafana: {
      securityGroup: '',
      auth: {
        adminPassword: '',
        clientId: '',
        clientSecret: ''
      }
    },
    alertmanager: {
      securityGroup: '',
      slack: {
        critical: {
          channel: '',
          api_url: ''
        },
        warning: {
          channel: '',
          api_url: ''
        },
        watchdog: {
          channel: '',
          api_url: ''
        }
      },
    },
    prometheus: {
      securityGroup: '',
      storage: {
        retention: '',
        size: '',
        reclaimPolicy: 'Delete',
        allowVolumeExpansion: true
      },
    },
    domainPrefix: if $.config.env == 'prd' then '' else $.config.env + '-',
    cognito: '',
  },
} + {
  _config+:: {
    jobs: {
      Kubelet: $._config.kubeletSelector,
      KubeAPI: $._config.kubeApiserverSelector,
      KubeStateMetrics: $._config.kubeStateMetricsSelector,
      NodeExporter: $._config.nodeExporterSelector,
      Alertmanager: $._config.alertmanagerSelector,
      Prometheus: $._config.prometheusSelector,
      PrometheusOperator: $._config.prometheusOperatorSelector,
      CoreDNS: $._config.coreDNSSelector,
    },
    namespace: $.config.namespace,
    grafana+:: {
      plugins+: ['grafana-piechart-panel'],
      config+: {
        sections+: {
          server+: {
            root_url: '%s://%sgrafana.%s' % [$.config.urlProtocol, $.config.domainPrefix, $.config.domain],
          },
          security: {
            admin_password: $.config.grafana.auth.adminPassword
          },
          'auth.github': {
            enabled: true,
            allow_sign_up: true,
            client_id: $.config.grafana.auth.clientId,
            client_secret: $.config.grafana.auth.clientSecret,
            scopes: 'user:email,read:org',
            auth_url: 'https://github.com/login/oauth/authorize',
            token_url: 'https://github.com/login/oauth/access_token',
            api_url: 'https://api.github.com/user',
            team_ids: '',
            allowed_organizations: 'hoge'
          }
        },
      },
    },
    alertmanager+:: {
      config: {
        global: {
          resolve_timeout: '5m',
          slack_api_url: $.config.alertmanager.slack.critical.api_url
        },
        route: {
          group_wait: '10s',
          group_interval: '5m',
          repeat_interval: '30m',
          receiver: 'slack-critical',
          routes: [
            {
              receiver: 'slack-critical',
              group_wait: '10s',
              match: {
                severity: 'error',
              },
              continue: true
            },
            {
              receiver: 'slack-warning',
              group_wait: '10s',
              match: {
                severity: 'warning',
              },
              continue: true
            },
            {
              receiver: 'slack-watchdog',
              group_wait: '10s',
              match: {
                alertname: 'Watchdog',
              },
              continue: true
            },
          ],
        },
        receivers: [
          {
            name: 'slack-critical',
            slack_configs: [
              {
                api_url: $.config.alertmanager.slack.critical.api_url,
                channel: $.config.alertmanager.slack.critical.channel,
                title: '[{{ .Status | toUpper }}{{ if eq .Status "firing" }}:{{ .Alerts.Firing | len }}{{ end }}] Monitoring Event Notification',
                text: '{{ range .Alerts }}\n  *Description:* {{ .Annotations.message }}\n  *Graph:* <{{ .GeneratorURL }}|:chart_with_upwards_trend:> *Runbook:* <{{ .Annotations.runbook_url }}|:spiral_note_pad:>\n  *Details:*\n  {{ range .Labels.SortedPairs }}  *{{ .Name }}:* `{{ .Value }}`\n  {{ end }}\n{{ end }}',
                send_resolved: true
              }
            ]
          },
          {
            name: 'slack-warning',
            slack_configs: [
              {
                api_url: $.config.alertmanager.slack.warning.api_url,
                channel: $.config.alertmanager.slack.warning.channel,
                title: '[{{ .Status | toUpper }}{{ if eq .Status "firing" }}:{{ .Alerts.Firing | len }}{{ end }}] Monitoring Event Notification',
                text: '{{ range .Alerts }}\n  *Description:* {{ .Annotations.message }}\n  *Graph:* <{{ .GeneratorURL }}|:chart_with_upwards_trend:> *Runbook:* <{{ .Annotations.runbook_url }}|:spiral_note_pad:>\n  *Details:*\n  {{ range .Labels.SortedPairs }}  *{{ .Name }}:* `{{ .Value }}`\n  {{ end }}\n{{ end }}',
                send_resolved: true
              }
            ]
          },
          {
            name: 'slack-watchdog',
            slack_configs: [
              {
                api_url: $.config.alertmanager.slack.watchdog.api_url,
                channel: $.config.alertmanager.slack.watchdog.channel,
                title: '[{{ .Status | toUpper }}{{ if eq .Status "firing" }}:{{ .Alerts.Firing | len }}{{ end }}] Monitoring Event Notification',
                text: '{{ range .Alerts }}\n  *Description:* {{ .Annotations.message }}\n  *Graph:* <{{ .GeneratorURL }}|:chart_with_upwards_trend:> *Runbook:* <{{ .Annotations.runbook_url }}|:spiral_note_pad:>\n  *Details:*\n  {{ range .Labels.SortedPairs }}  *{{ .Name }}:* `{{ .Value }}`\n  {{ end }}\n{{ end }}',
                send_resolved: true
              }
            ]
          },
          {
            name: 'silent-receiver'
          }
        ],
      },
    },
    prometheus+:: {
      replicas: 3,
    }
  },
  alertmanager+:: {
    alertmanager+: {
      spec+: {
        externalUrl: '%s://%salertmanager.%s' % [$.config.urlProtocol, $.config.domainPrefix, $.config.domain],
      },
    },
  },
  prometheus+:: {
    prometheus+: {
      spec+: {
        externalUrl: '%s://%sprometheus.%s' % [$.config.urlProtocol, $.config.domainPrefix, $.config.domain],
        retention: $.config.prometheus.storage.retention,
        storage: {
          volumeClaimTemplate:
            pvc.new() +
            pvc.mixin.spec.withAccessModes('ReadWriteOnce') +
            pvc.mixin.spec.resources.withRequests({ storage: $.config.prometheus.storage.size }) +
            pvc.mixin.spec.withStorageClassName('prometheus'),
        },
      },
    },
  },
  storageClass+:: {
    prometheus:
      sc.new() +
      sc.withProvisioner('kubernetes.io/aws-ebs') +
      sc.mixin.metadata.withName('prometheus') +
      sc.withParameters({
        'type': 'gp2'
      }) +
      sc.withReclaimPolicy($.config.prometheus.storage.reclaimPolicy) +
      sc.withAllowVolumeExpansion($.config.prometheus.storage.allowVolumeExpansion),
  },
  ingress+:: {
    'alertmanager-main':
      ingress.new() +
      ingress.mixin.metadata.withName('alertmanager-main') +
      ingress.mixin.metadata.withNamespace($.config.namespace) +
      ingress.mixin.metadata.withAnnotations({
        'alb.ingress.kubernetes.io/auth-idp-cognito': $.config.cognito,
        'alb.ingress.kubernetes.io/auth-on-unauthenticated-request': 'authenticate',
        'alb.ingress.kubernetes.io/auth-scope': 'openid',
        'alb.ingress.kubernetes.io/auth-session-cookie': 'AWSELBAuthSessionCookie',
        'alb.ingress.kubernetes.io/auth-session-timeout': '604800',
        'alb.ingress.kubernetes.io/auth-type': 'cognito',
        'alb.ingress.kubernetes.io/healthcheck-path': '/-/healthy',
        'alb.ingress.kubernetes.io/scheme': 'internet-facing',
        'alb.ingress.kubernetes.io/security-groups': $.config.alertmanager.securityGroup,
        'alb.ingress.kubernetes.io/subnets': $.config.subnets,
        'alb.ingress.kubernetes.io/tags': 'env=%s,app=alertmanager-main' % $.config.env,
        'alb.ingress.kubernetes.io/target-group-attributes': 'stickiness.enabled=true,stickiness.lb_cookie.duration_seconds=60',
        'alb.ingress.kubernetes.io/certificate-arn': $.config.acmArn,
        'kubernetes.io/ingress.class': 'alb',
      }) +
      ingress.mixin.spec.withRules(
        ingressRule.new() +
        ingressRule.withHost('%salertmanager.%s' % [$.config.domainPrefix, $.config.domain]) +
        ingressRule.mixin.http.withPaths(
          httpIngressPath.new() +
          httpIngressPath.mixin.backend.withServiceName('alertmanager-main') +
          httpIngressPath.mixin.backend.withServicePort('web')
        ),
      ),
    grafana:
      ingress.new() +
      ingress.mixin.metadata.withName('grafana') +
      ingress.mixin.metadata.withNamespace($.config.namespace) +
      ingress.mixin.metadata.withAnnotations({
        'alb.ingress.kubernetes.io/auth-idp-cognito': $.config.cognito,
        'alb.ingress.kubernetes.io/auth-on-unauthenticated-request': 'authenticate',
        'alb.ingress.kubernetes.io/auth-scope': 'openid',
        'alb.ingress.kubernetes.io/auth-session-cookie': 'AWSELBAuthSessionCookie',
        'alb.ingress.kubernetes.io/auth-session-timeout': '604800',
        'alb.ingress.kubernetes.io/auth-type': 'cognito',
        'alb.ingress.kubernetes.io/healthcheck-path': '/api/health',
        'alb.ingress.kubernetes.io/scheme': 'internet-facing',
        'alb.ingress.kubernetes.io/security-groups': $.config.grafana.securityGroup,
        'alb.ingress.kubernetes.io/subnets': $.config.subnets,
        'alb.ingress.kubernetes.io/tags': 'env=%s,app=grafana' % $.config.env,
        'alb.ingress.kubernetes.io/certificate-arn': $.config.acmArn,
        'kubernetes.io/ingress.class': 'alb',
      }) +
      ingress.mixin.spec.withRules(
        ingressRule.new() +
        ingressRule.withHost('%sgrafana.%s' % [$.config.domainPrefix, $.config.domain]) +
        ingressRule.mixin.http.withPaths(
          httpIngressPath.new() +
          httpIngressPath.mixin.backend.withServiceName('grafana') +
          httpIngressPath.mixin.backend.withServicePort('http')
        ),
      ),
    'prometheus-k8s':
      ingress.new() +
      ingress.mixin.metadata.withName('prometheus-k8s') +
      ingress.mixin.metadata.withNamespace($.config.namespace) +
      ingress.mixin.metadata.withAnnotations({
        'alb.ingress.kubernetes.io/auth-idp-cognito': $.config.cognito,
        'alb.ingress.kubernetes.io/auth-on-unauthenticated-request': 'authenticate',
        'alb.ingress.kubernetes.io/auth-scope': 'openid',
        'alb.ingress.kubernetes.io/auth-session-cookie': 'AWSELBAuthSessionCookie',
        'alb.ingress.kubernetes.io/auth-session-timeout': '604800',
        'alb.ingress.kubernetes.io/auth-type': 'cognito',
        'alb.ingress.kubernetes.io/healthcheck-path': '/-/healthy',
        'alb.ingress.kubernetes.io/scheme': 'internet-facing',
        'alb.ingress.kubernetes.io/security-groups': $.config.prometheus.securityGroup,
        'alb.ingress.kubernetes.io/subnets': $.config.subnets,
        'alb.ingress.kubernetes.io/tags': 'env=%s,app=prometheus-k8s' % $.config.env,
        'alb.ingress.kubernetes.io/target-group-attributes': 'stickiness.enabled=true,stickiness.lb_cookie.duration_seconds=60',
        'alb.ingress.kubernetes.io/certificate-arn': $.config.acmArn,
        'kubernetes.io/ingress.class': 'alb',
      }) +
      ingress.mixin.spec.withRules(
        ingressRule.new() +
        ingressRule.withHost('%sprometheus.%s' % [$.config.domainPrefix, $.config.domain]) +
        ingressRule.mixin.http.withPaths(
          httpIngressPath.new() +
          httpIngressPath.mixin.backend.withServiceName('prometheus-k8s') +
          httpIngressPath.mixin.backend.withServicePort('web')
        ),
      ),
  },
  common+:: {
    'limit-range':
      limitRange.new() +
      limitRange.mixin.metadata.withName('limit-range') +
      limitRange.mixin.metadata.withNamespace($.config.namespace) +
      limitRange.mixin.spec.withLimits([
        limitRangeItem.new() +
        limitRangeItem.withType('Container') +
        limitRangeItem.withMax({
          'cpu': '8',
          'memory': '16Gi',
        }) +
        limitRangeItem.withMin({
          'cpu': '10m',
          'memory': '10Mi',
        }) +
        limitRangeItem.withDefault({
          'memory': '16Gi',
        }) +
        limitRangeItem.withDefaultRequest({
          'cpu': '100m',
          'memory': '100Mi',
        }),
        limitRangeItem.new() +
        limitRangeItem.withType('Pod') +
        limitRangeItem.withMax({
          'cpu': '16',
          'memory': '32Gi',
        }) +
        limitRangeItem.withMin({
          'cpu': '100m',
          'memory': '100Mi',
        })
      ]),
  },
  grafanaDashboards+:: {
    'cluster-autoscaler-stats.json': (import 'custom-dashboards/cluster-autoscaler-stats.json'),
  },
}

{
  build()::
    { ['00namespace-' + name]: $.kubePrometheus[name] for name in std.objectFields($.kubePrometheus) } +
    { ['0prometheus-operator-' + name]: $.prometheusOperator[name] for name in std.objectFields($.prometheusOperator) } +
    { ['node-exporter-' + name]: $.nodeExporter[name] for name in std.objectFields($.nodeExporter) } +
    { ['kube-state-metrics-' + name]: $.kubeStateMetrics[name] for name in std.objectFields($.kubeStateMetrics) } +
    { ['alertmanager-' + name]: $.alertmanager[name] for name in std.objectFields($.alertmanager) } +
    { ['prometheus-' + name]: $.prometheus[name] for name in std.objectFields($.prometheus) } +
    { ['prometheus-adapter-' + name]: $.prometheusAdapter[name] for name in std.objectFields($.prometheusAdapter) } +
    { ['grafana-' + name]: $.grafana[name] for name in std.objectFields($.grafana) } +
    { ['ingress-' + name]: $.ingress[name] for name in std.objectFields($.ingress) } +
    { ['storage-class-' + name]: $.storageClass[name] for name in std.objectFields($.storageClass) } +
    { ['common-' + name]: $.common[name] for name in std.objectFields($.common) }
}
セキュリティグループやサブネット情報などは環境毎に異なるため、それらの設定値の変数をbase.libsonnetのconfig要素の中に用意しておきます。環境毎の識別子をファイル名に付したjsonnetファイル(dev.jsonnetなど)がbase.libsonnetをimportし、config要素の変数を上書きすることで環境毎の設定値を反映しています。
下記のファイルはdev環境用のdev.jsonnetです。
((import "base.libsonnet") +
{
  config+:: {
    env: 'dev',
    urlProtocol: 'https',
    domain: 'hoge.com',
    subnets: 'subnet-xxxx,subnet-yyyy,subnet-zzzz',
    acmArn: 'arn:aws:acm:ap-northeast-1:xxxx:certificate/xxxx',
    cognito: '{"UserPoolArn":"arn:aws:cognito-idp:ap-northeast-1:xxxx:userpool/ap-northeast-1_xxxx","UserPoolClientId":"xxxx","UserPoolDomain":"developer"}',
    grafana: {
      securityGroup: 'sg-xxxx',
      auth: {
        adminPassword: 'hoge',
        clientId: 'xxxx',
        clientSecret: 'yyyy'
      }
    },
    alertmanager+: {
      securityGroup: 'sg-yyyy',
      slack: {
        critical: {
          channel: '#prom-alert-dev',
          api_url: 'https://hooks.slack.com/services/xxxx/yyyy/zzzz'
        },
        warning: {
          channel: '#prom-alert-dev',
          api_url: 'https://hooks.slack.com/services/xxxx/yyyy/zzzz'
        },
        watchdog: {
          channel: '#prom-alert-watchdog',
          api_url: 'https://hooks.slack.com/services/xxxx/yyyy/zzzz'
        }
      },
    },
    prometheus+: {
      securityGroup: 'sg-zzzz',
      storage+: {
        retention: '30d',
        size: '30Gi',
      },
    },
  },
}).build()
マニフェストファイルの出力方法
マニフェストファイルを出力するスクリプトbuild.shを用意します。
# !/bin/sh

set -exo pipefail

environment=$1
target_dir=manifests/${environment}
temp_dir=temp

rm -rf ${temp_dir}
mkdir -p ${temp_dir}

jsonnet -J vendor -m ${temp_dir} "${environment}.jsonnet" | xargs -I{} sh -c 'cat {} | gojsontoyaml > {}.yaml; rm -f {}' -- {}

rm -rf ${target_dir}
mkdir -p ${target_dir}
mv -f ${temp_dir}/*.yaml ${target_dir}/
build.shの引数に環境毎の識別子(dev|stg|prd)を指定してbuild.shを実行することでmanifestsディレクトリの下の環境毎の識別子の名称のディレクトリの配下(manifests/dev/など)にマニフェストファイルが出力されます。
EKSで動作させるために追加した要素
kube-prometheusのマニフェストファイルを拡張してEKS環境で動作させるために追加した要素について説明していきます。
kube-prometheus-eks.libsonnetのインポート
kube-prometheusの0.3からkube-prometheus-eks.libsonnetが追加されました。このファイルをインポートすることでCNIプラグインのメトリクスエンドポイントにアクセスするためのServiceのマニフェストファイルが出力されるようになりました。
apiVersion: v1
kind: Service
metadata:
  labels:
    k8s-app: aws-node
  name: aws-node
  namespace: kube-system
spec:
  clusterIP: None
  ports:
  - name: cni-metrics-port
    port: 61678
    targetPort: 61678
  selector:
    k8s-app: aws-node
また、IPアドレスの枯渇を検知するアラートルールも追加されました。
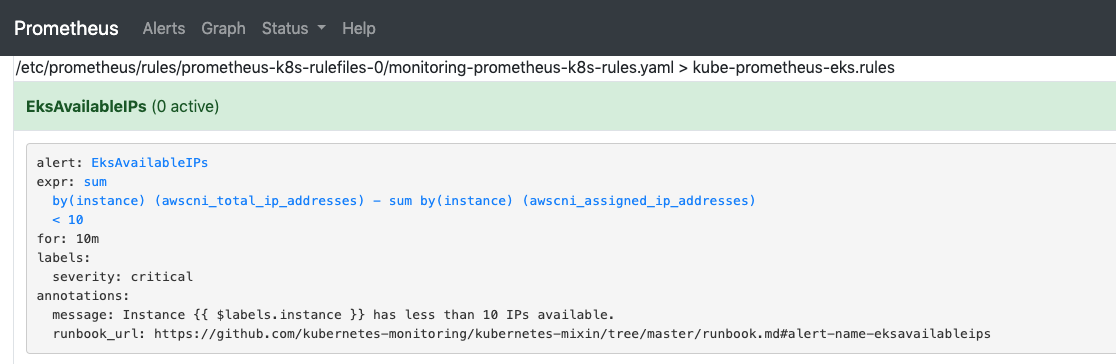
参考: CNI monitoring special configuration updates for EKS
ALB Ingress Controller用のNodePortとIngressの定義
この記事の冒頭のあたりで述べたように、Grafana, Prometheus, AlertmanagerはApplication Load Balancer(ALB)経由でアクセスできるようにしています。そしてそれらのALBはALB Ingress Controllerによって作成しています。なのでALB Ingress ControllerによってALBが作成されるようにマニフェストファイルを構成する必要があります。
まずはGrafana, Prometheus, Alertmanager用のServiceのtypeをNodePortに変更するために、base.libsonnet内で'kube-prometheus/kube-prometheus-node-ports.libsonnet'をimportします。
(import 'kube-prometheus/kube-prometheus-node-ports.libsonnet') +
これだけで下記のようにServiceのspec.typeがNodePortに変更され、NodePort Serviceの受け口となるPortnodePortもマニフェストファイルに定義されます。
apiVersion: v1
kind: Service
metadata:
  labels:
    prometheus: k8s
  name: prometheus-k8s
  namespace: monitoring
spec:
  ports:
  - name: web
    nodePort: 30900
    port: 9090
    targetPort: web
  selector:
    app: prometheus
    prometheus: k8s
  sessionAffinity: ClientIP
  type: NodePort
次にGrafana, Prometheus, Alertmanager用のIngressリソースの定義をbase.libsonnetに追加します。
Ingressリソースを定義するために、jsonnetでKubernetesリソースを定義できるksonnetを利用します。base.libsonnetの最初に下記のように定義し、ksonnetでIngressリソースを定義するために必要な変数を定義しておきます。
local k = import 'ksonnet/ksonnet.beta.3/k.libsonnet';

local ingress = k.extensions.v1beta1.ingress;
local ingressRule = ingress.mixin.spec.rulesType;
local httpIngressPath = ingressRule.mixin.http.pathsType;
次にIngressリソースの定義をします。下記はAlertmanager用のIngressの定義をbase.libsonnetの中から抜粋したものです。
  ingress+:: {
    'alertmanager-main':
      ingress.new() +
      ingress.mixin.metadata.withName('alertmanager-main') +
      ingress.mixin.metadata.withNamespace($.config.namespace) +
      ingress.mixin.metadata.withAnnotations({
        'alb.ingress.kubernetes.io/auth-idp-cognito': $.config.cognito,
        'alb.ingress.kubernetes.io/auth-on-unauthenticated-request': 'authenticate',
        'alb.ingress.kubernetes.io/auth-scope': 'openid',
        'alb.ingress.kubernetes.io/auth-session-cookie': 'AWSELBAuthSessionCookie',
        'alb.ingress.kubernetes.io/auth-session-timeout': '604800',
        'alb.ingress.kubernetes.io/auth-type': 'cognito',
        'alb.ingress.kubernetes.io/healthcheck-path': '/-/healthy',
        'alb.ingress.kubernetes.io/scheme': 'internet-facing',
        'alb.ingress.kubernetes.io/security-groups': $.config.alertmanager.securityGroup,
        'alb.ingress.kubernetes.io/subnets': $.config.subnets,
        'alb.ingress.kubernetes.io/tags': 'env=%s,app=alertmanager-main' % $.config.env,
        'alb.ingress.kubernetes.io/target-group-attributes': 'stickiness.enabled=true,stickiness.lb_cookie.duration_seconds=60',
        'alb.ingress.kubernetes.io/certificate-arn': $.config.acmArn,
        'kubernetes.io/ingress.class': 'alb',
      }) +
      ingress.mixin.spec.withRules(
        ingressRule.new() +
        ingressRule.withHost('%salertmanager.%s' % [$.config.domainPrefix, $.config.domain]) +
        ingressRule.mixin.http.withPaths(
          httpIngressPath.new() +
          httpIngressPath.mixin.backend.withServiceName('alertmanager-main') +
          httpIngressPath.mixin.backend.withServicePort('web')
        ),
      ),
Cognitoを利用した認証も行いたいため、annotationの定義が膨れ上がっています。
環境毎に差異のある情報は先述したconfigフィールド内に定義した変数を参照するようにして吸収しています。
最後にbase.libsonnetのbuild()の中にIngress用のマニフェストファイルを出力する定義を追加します。
{
  build()::
    { ['00namespace-' + name]: $.kubePrometheus[name] for name in std.objectFields($.kubePrometheus) } +
    { ['0prometheus-operator-' + name]: $.prometheusOperator[name] for name in std.objectFields($.prometheusOperator) } +
    { ['node-exporter-' + name]: $.nodeExporter[name] for name in std.objectFields($.nodeExporter) } +
    { ['kube-state-metrics-' + name]: $.kubeStateMetrics[name] for name in std.objectFields($.kubeStateMetrics) } +
    { ['alertmanager-' + name]: $.alertmanager[name] for name in std.objectFields($.alertmanager) } +
    { ['prometheus-' + name]: $.prometheus[name] for name in std.objectFields($.prometheus) } +
    { ['prometheus-adapter-' + name]: $.prometheusAdapter[name] for name in std.objectFields($.prometheusAdapter) } +
    { ['grafana-' + name]: $.grafana[name] for name in std.objectFields($.grafana) } +
+    { ['ingress-' + name]: $.ingress[name] for name in std.objectFields($.ingress) } +
    { ['storage-class-' + name]: $.storageClass[name] for name in std.objectFields($.storageClass) } +
    { ['common-' + name]: $.common[name] for name in std.objectFields($.common) }
}
ingress-alertmanager-main.yaml,ingress-grafana.yaml,ingress-prometheus-k8s.yamlの名称でマニフェストファイルが出力されます。
EBS用のStorageClassとvolumeClaimTemplateの定義
先述したようにPrometheusが収集したメトリクスデータはEBSに保存しています。PrometheusのPodはStatefulSetであり、PrometheusのPodからEBSにアクセスできるように定義を追加していきます。
まずは、StorageClassの定義を追加します。
  storageClass+:: {
    prometheus:
      sc.new() +
      sc.withProvisioner('kubernetes.io/aws-ebs') +
      sc.mixin.metadata.withName('prometheus') +
      sc.withParameters({
        'type': 'gp2'
      }) +
      sc.withReclaimPolicy($.config.prometheus.storage.reclaimPolicy) +
      sc.withAllowVolumeExpansion($.config.prometheus.storage.allowVolumeExpansion),
  },
上記で定義したStorageClassのマニフェストファイルを出力できるように下記の定義を追加します。
{
  build()::
    { ['00namespace-' + name]: $.kubePrometheus[name] for name in std.objectFields($.kubePrometheus) } +
    { ['0prometheus-operator-' + name]: $.prometheusOperator[name] for name in std.objectFields($.prometheusOperator) } +
    { ['node-exporter-' + name]: $.nodeExporter[name] for name in std.objectFields($.nodeExporter) } +
    { ['kube-state-metrics-' + name]: $.kubeStateMetrics[name] for name in std.objectFields($.kubeStateMetrics) } +
    { ['alertmanager-' + name]: $.alertmanager[name] for name in std.objectFields($.alertmanager) } +
    { ['prometheus-' + name]: $.prometheus[name] for name in std.objectFields($.prometheus) } +
    { ['prometheus-adapter-' + name]: $.prometheusAdapter[name] for name in std.objectFields($.prometheusAdapter) } +
    { ['grafana-' + name]: $.grafana[name] for name in std.objectFields($.grafana) } +
    { ['ingress-' + name]: $.ingress[name] for name in std.objectFields($.ingress) } +
+    { ['storage-class-' + name]: $.storageClass[name] for name in std.objectFields($.storageClass) } +
    { ['common-' + name]: $.common[name] for name in std.objectFields($.common) }
}
ここまでの定義で、下記のStorageClassリソースのマニフェストファイルが出力されます。
allowVolumeExpansion: true
apiVersion: storage.k8s.io/v1
kind: StorageClass
metadata:
  name: prometheus
parameters:
  type: gp2
provisioner: kubernetes.io/aws-ebs
reclaimPolicy: Delete
最後にPrometheus CRDのspec.storage.volumeClaimTemplateを追加します。
  prometheus+:: {
    prometheus+: {
      spec+: {
        externalUrl: '%s://%sprometheus.%s' % [$.config.urlProtocol, $.config.domainPrefix, $.config.domain],
        retention: $.config.prometheus.storage.retention,
        storage: {
          volumeClaimTemplate:
            pvc.new() +
            pvc.mixin.spec.withAccessModes('ReadWriteOnce') +
            pvc.mixin.spec.resources.withRequests({ storage: $.config.prometheus.storage.size }) +
            pvc.mixin.spec.withStorageClassName('prometheus'),
        },
      },
    },
ここまでの定義で出力されるPrometheusリソースのマニフェストファイルにspec.storage.volumeClaimTemplateが追加されます。
apiVersion: monitoring.coreos.com/v1
kind: Prometheus
metadata:
  labels:
    prometheus: k8s
  name: k8s
  namespace: monitoring
spec:
  alerting:
    alertmanagers:
    - name: alertmanager-main
      namespace: monitoring
      port: web
  baseImage: quay.io/prometheus/prometheus
  externalUrl: https://dev-hoge.com
  nodeSelector:
    beta.kubernetes.io/os: linux
  replicas: 3
  resources:
    requests:
      memory: 400Mi
  retention: 30d
  ruleSelector:
    matchLabels:
      prometheus: k8s
      role: alert-rules
  securityContext:
    fsGroup: 2000
    runAsNonRoot: true
    runAsUser: 1000
  serviceAccountName: prometheus-k8s
  serviceMonitorNamespaceSelector: {}
  serviceMonitorSelector: {}
  storage:
    volumeClaimTemplate:
      apiVersion: v1
      kind: PersistentVolumeClaim
      spec:
        accessModes:
        - ReadWriteOnce
        resources:
          requests:
            storage: 30Gi
        storageClassName: prometheus
  version: v2.7.2
これでPrometheusがEBSにデータを保存できるようになりました。
補足:base.libsonnetのその他の定義について
以降、EKSで動かすための設定とはほぼ関係ありませんが、補足としてbase.libsonnet内のその他の定義について説明していきます。
まず、base.libsonnetのトップレベルにある_configフィールドについてです。
_configフィールドは先述したjbコマンドでダウンロードしたkube-prometheusとその依存関係にあるjsonnetファイル群にも定義されており、_configの値を各所で参照してマニフェストファイルを生成しています。そのため、_config配下のフィールドの値を上書きすることで、生成されるマニフェストファイルの内容を変更することが可能です。
  _config+:: {
    jobs: {
      Kubelet: $._config.kubeletSelector,
      KubeAPI: $._config.kubeApiserverSelector,
      KubeStateMetrics: $._config.kubeStateMetricsSelector,
      NodeExporter: $._config.nodeExporterSelector,
      Alertmanager: $._config.alertmanagerSelector,
      Prometheus: $._config.prometheusSelector,
      PrometheusOperator: $._config.prometheusOperatorSelector,
      CoreDNS: $._config.coreDNSSelector,
    },
    namespace: $.config.namespace,
    grafana+:: {
      plugins+: ['grafana-piechart-panel'],
      config+: {
        sections+: {
          server+: {
            root_url: '%s://%sgrafana.%s' % [$.config.urlProtocol, $.config.domainPrefix, $.config.domain],
          },
          security: {
            admin_password: $.config.grafana.auth.adminPassword
          },
          'auth.github': {
            enabled: true,
            allow_sign_up: true,
            client_id: $.config.grafana.auth.clientId,
            client_secret: $.config.grafana.auth.clientSecret,
            scopes: 'user:email,read:org',
            auth_url: 'https://github.com/login/oauth/authorize',
            token_url: 'https://github.com/login/oauth/access_token',
            api_url: 'https://api.github.com/user',
            team_ids: '',
            allowed_organizations: 'hoge'
          }
        },
      },
    },
    alertmanager+:: {
      config: {
        global: {
          resolve_timeout: '5m',
          slack_api_url: $.config.alertmanager.slack.critical.api_url
        },
        route: {
          group_wait: '10s',
          group_interval: '5m',
          repeat_interval: '30m',
          receiver: 'slack-critical',
          routes: [
            {
              receiver: 'silent-receiver',
              match: {
                alertname: 'KubeCPUOvercommit'
              }
            },
            {
              receiver: 'silent-receiver',
              match: {
                alertname: 'CPUThrottlingHigh'
              }
            },
            {
              receiver: 'silent-receiver',
              match: {
                alertname: 'KubeVersionMismatch'
              }
            },
            {
              receiver: 'slack-critical',
              group_wait: '10s',
              match: {
                severity: 'error',
              },
              continue: true
            },
            {
              receiver: 'slack-warning',
              group_wait: '10s',
              match: {
                severity: 'warning',
              },
              continue: true
            },
            {
              receiver: 'slack-watchdog',
              group_wait: '10s',
              match: {
                alertname: 'Watchdog',
              },
              continue: true
            },
          ],
        },
        receivers: [
          {
            name: 'slack-critical',
            slack_configs: [
              {
                api_url: $.config.alertmanager.slack.critical.api_url,
                channel: $.config.alertmanager.slack.critical.channel,
                title: '[{{ .Status | toUpper }}{{ if eq .Status "firing" }}:{{ .Alerts.Firing | len }}{{ end }}] Monitoring Event Notification',
                text: '{{ range .Alerts }}\n  *Description:* {{ .Annotations.message }}\n  *Graph:* <{{ .GeneratorURL }}|:chart_with_upwards_trend:> *Runbook:* <{{ .Annotations.runbook_url }}|:spiral_note_pad:>\n  *Details:*\n  {{ range .Labels.SortedPairs }}  *{{ .Name }}:* `{{ .Value }}`\n  {{ end }}\n{{ end }}',
                send_resolved: true
              }
            ]
          },
          {
            name: 'slack-warning',
            slack_configs: [
              {
                api_url: $.config.alertmanager.slack.warning.api_url,
                channel: $.config.alertmanager.slack.warning.channel,
                title: '[{{ .Status | toUpper }}{{ if eq .Status "firing" }}:{{ .Alerts.Firing | len }}{{ end }}] Monitoring Event Notification',
                text: '{{ range .Alerts }}\n  *Description:* {{ .Annotations.message }}\n  *Graph:* <{{ .GeneratorURL }}|:chart_with_upwards_trend:> *Runbook:* <{{ .Annotations.runbook_url }}|:spiral_note_pad:>\n  *Details:*\n  {{ range .Labels.SortedPairs }}  *{{ .Name }}:* `{{ .Value }}`\n  {{ end }}\n{{ end }}',
                send_resolved: true
              }
            ]
          },
          {
            name: 'slack-watchdog',
            slack_configs: [
              {
                api_url: $.config.alertmanager.slack.watchdog.api_url,
                channel: $.config.alertmanager.slack.watchdog.channel,
                title: '[{{ .Status | toUpper }}{{ if eq .Status "firing" }}:{{ .Alerts.Firing | len }}{{ end }}] Monitoring Event Notification',
                text: '{{ range .Alerts }}\n  *Description:* {{ .Annotations.message }}\n  *Graph:* <{{ .GeneratorURL }}|:chart_with_upwards_trend:> *Runbook:* <{{ .Annotations.runbook_url }}|:spiral_note_pad:>\n  *Details:*\n  {{ range .Labels.SortedPairs }}  *{{ .Name }}:* `{{ .Value }}`\n  {{ end }}\n{{ end }}',
                send_resolved: true
              }
            ]
          },
          {
            name: 'silent-receiver'
          }
        ],
      },
    },
    prometheus+:: {
      replicas: 3,
    }
  },
上記の_configの各設定項目について説明していきます。
下記のフィールドはプロメテウスのアラートルールを定義したマニフェストファイルprometheus-rules.yamlにサービスがダウンしたかどうかを検知するアラートルールを追加するものです。
    jobs: {
      Kubelet: $._config.kubeletSelector,
      KubeAPI: $._config.kubeApiserverSelector,
      KubeStateMetrics: $._config.kubeStateMetricsSelector,
      NodeExporter: $._config.nodeExporterSelector,
      Alertmanager: $._config.alertmanagerSelector,
      Prometheus: $._config.prometheusSelector,
      PrometheusOperator: $._config.prometheusOperatorSelector,
      CoreDNS: $._config.coreDNSSelector,
    },
例えばKubeletのフィールドを上記のように定義すると、prometheus-rules.yamlに下記の定義が追加されます。
    - alert: KubeletDown
      annotations:
        message: Kubelet has disappeared from Prometheus target discovery.
        runbook_url: https://github.com/kubernetes-monitoring/kubernetes-mixin/tree/master/runbook.md#alert-name-kubeletdown
      expr: |
        absent(up{job="kubelet"} == 1)
      for: 15m
      labels:
        severity: critical
なお、下記の定義をjobs内に追加するとkube-schedulerとkube-controller-managerのアラートルールを追加することもできますが、EKSクラスターにおいては、これらのコンポーネントをPrometheusの監視対象のターゲットとして設定することはできないため(できる方法があったらすみません)、この設定は追加していません。
      KubeScheduler: $._config.kubeSchedulerSelector,
      KubeControllerManager: $._config.kubeControllerManagerSelector,
_configの次のフィールドを見ていきます。
namespaceフィールドに、対象のnamespaceを定義します。指定したnamespace名のnamespaceリソースのマニフェストファイルも作成されます。
namespace: $.config.namespace,
次に_configのgrafanaフィールドについて見ていきます。
grafana.configフィールドの値には、Grafanaの設定ファイルであるgrafana.iniの内容を定義していきます。
    grafana+:: {
      plugins+: ['grafana-piechart-panel'],
      config+: {
        sections+: {
          server+: {
            root_url: '%s://%sgrafana.%s' % [$.config.urlProtocol, $.config.domainPrefix, $.config.domain],
          },
          security: {
            admin_password: $.config.grafana.auth.adminPassword
          },
          'auth.github': {
            enabled: true,
            allow_sign_up: true,
            client_id: $.config.grafana.auth.clientId,
            client_secret: $.config.grafana.auth.clientSecret,
            scopes: 'user:email,read:org',
            auth_url: 'https://github.com/login/oauth/authorize',
            token_url: 'https://github.com/login/oauth/access_token',
            api_url: 'https://api.github.com/user',
            team_ids: '',
            allowed_organizations: 'hoge'
          }
        },
      },
    },
上記の定義であれば、下記の内容のgrafana.iniが生成されます。実際にはBase64エンコードされてgrafana-config.yamlのファイル名でSecretリソース内に定義されます。
[auth.github]
allow_sign_up = true
allowed_organizations = hoge
api_url = https://api.github.com/user
auth_url = https://github.com/login/oauth/authorize
client_id = hoge
client_secret = fuga
enabled = true
scopes = user:email,read:org
team_ids =
token_url = https://github.com/login/oauth/access_token
[security]
admin_password = xxxxx
[server]
root_url = https://dev-grafana.hoge.com
grafana.iniの設定内容の詳細な説明は省きますが、[auth.github]セクションでGrafanaのGithubログインに関する設定をし、[security]セクションのadmin_passwordでGrafanaのAdminユーザーのパスワードを設定しています。
次に_configのalertmanagerフィールドについて見ていきます。
alertmanager.configフィールドの値には、Alertmanagerの設定ファイルの内容を定義しています。
設定ファイルの内容はBase64エンコードされ、alertmanager-secret.yamlのファイル名でSecretリソース内に定義されます。
    alertmanager+:: {
      config: {
        global: {
          resolve_timeout: '5m',
          slack_api_url: $.config.alertmanager.slack.critical.api_url
        },
        route: {
          group_wait: '10s',
          group_interval: '5m',
          repeat_interval: '30m',
          receiver: 'slack-critical',
          routes: [
            {
              receiver: 'slack-critical',
              group_wait: '10s',
              match: {
                severity: 'error',
              },
              continue: true
            },
            {
              receiver: 'slack-warning',
              group_wait: '10s',
              match: {
                severity: 'warning',
              },
              continue: true
            },
            {
              receiver: 'slack-watchdog',
              group_wait: '10s',
              match: {
                alertname: 'Watchdog',
              },
              continue: true
            },
          ],
        },
        receivers: [
          {
            name: 'slack-critical',
            slack_configs: [
              {
                api_url: $.config.alertmanager.slack.critical.api_url,
                channel: $.config.alertmanager.slack.critical.channel,
                title: '[{{ .Status | toUpper }}{{ if eq .Status "firing" }}:{{ .Alerts.Firing | len }}{{ end }}] Monitoring Event Notification',
                text: '{{ range .Alerts }}\n  *Description:* {{ .Annotations.message }}\n  *Graph:* <{{ .GeneratorURL }}|:chart_with_upwards_trend:> *Runbook:* <{{ .Annotations.runbook_url }}|:spiral_note_pad:>\n  *Details:*\n  {{ range .Labels.SortedPairs }}  *{{ .Name }}:* `{{ .Value }}`\n  {{ end }}\n{{ end }}',
                send_resolved: true
              }
            ]
          },
          {
            name: 'slack-warning',
            slack_configs: [
              {
                api_url: $.config.alertmanager.slack.warning.api_url,
                channel: $.config.alertmanager.slack.warning.channel,
                title: '[{{ .Status | toUpper }}{{ if eq .Status "firing" }}:{{ .Alerts.Firing | len }}{{ end }}] Monitoring Event Notification',
                text: '{{ range .Alerts }}\n  *Description:* {{ .Annotations.message }}\n  *Graph:* <{{ .GeneratorURL }}|:chart_with_upwards_trend:> *Runbook:* <{{ .Annotations.runbook_url }}|:spiral_note_pad:>\n  *Details:*\n  {{ range .Labels.SortedPairs }}  *{{ .Name }}:* `{{ .Value }}`\n  {{ end }}\n{{ end }}',
                send_resolved: true
              }
            ]
          },
          {
            name: 'slack-watchdog',
            slack_configs: [
              {
                api_url: $.config.alertmanager.slack.watchdog.api_url,
                channel: $.config.alertmanager.slack.watchdog.channel,
                title: '[{{ .Status | toUpper }}{{ if eq .Status "firing" }}:{{ .Alerts.Firing | len }}{{ end }}] Monitoring Event Notification',
                text: '{{ range .Alerts }}\n  *Description:* {{ .Annotations.message }}\n  *Graph:* <{{ .GeneratorURL }}|:chart_with_upwards_trend:> *Runbook:* <{{ .Annotations.runbook_url }}|:spiral_note_pad:>\n  *Details:*\n  {{ range .Labels.SortedPairs }}  *{{ .Name }}:* `{{ .Value }}`\n  {{ end }}\n{{ end }}',
                send_resolved: true
              }
            ]
          },
          {
            name: 'silent-receiver'
          }
        ],
      },
    },
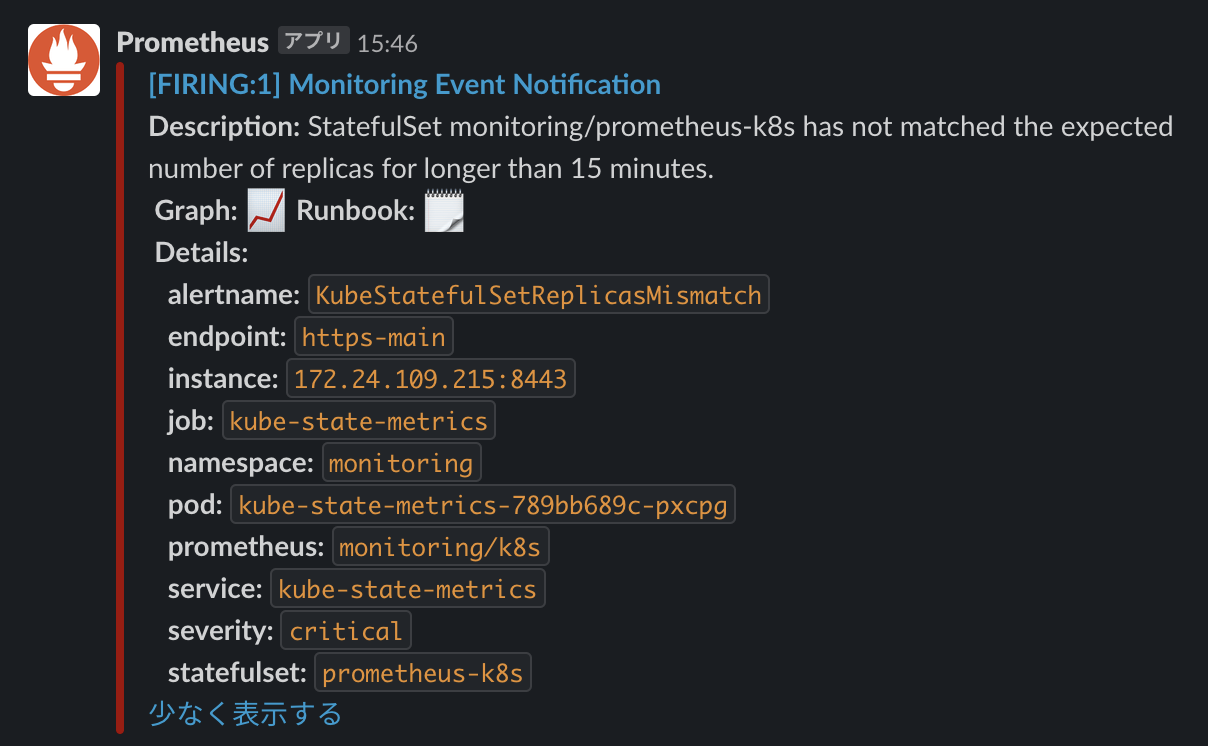
上記のslack_configsの設定であれば、slackに下記のように通知されます。Graph:の右の画像をクリックすると、Prometheusに遷移してグラフを表示してくれます。
次に_configフィールドのprometheusフィールドについてです。
replicasフィールドにPrometheusのPodのレプリカ数を定義します。この値はprometheus-prometheus.yamlのファイル名で出力されるPrometheus Operator用のCustom Resource(CD)であるPrometheusリソースの定義内に反映されます。
    prometheus+:: {
      replicas: 3,
    }
他の要素についても説明したかったのですが、スタミナ切れで今回はここまでとさせていただければと思います。
最後に
以上のご紹介してきた方法でモニタリング環境を構築し、12月半ばから本番環境で運用を始めたばかりなので、今後色々と改善点が見つかるかもしれませんが、一旦今の構成ということで記事にまとめてみました。
base.libsonnetの内容が結構膨れてきたり冗長な記述があるので、ファイル分割や冗長な記述の共通化をする余地があります。リファクタがんばります。
PrometheusのデータはEBSに保存していますが、Thanosへの移行してS3に永続化する方法も検討中です。
kube-prometheusは慣れるまでは苦戦しましたが、今では割と思うように拡張することができるようになってきました。試していないので分かりませんが、もしかしたらprometheus-operatorのHelmチャートの方が同様の構成を簡単に作れるかもしれません(笑)。