はじめに
DockerでPrometheus、Grafana、Alertmanagerを同時に動かしてみました。
その際AlertmanagerからSlackに通知が行くようにしています。
Prometheusとは
Prometheusはオープンソースの監視ツールで、元々は2012年にSoundCloudで作られたものです。その後様々な企業に採用され、プロジェクトは活発になっていきました。
多次元データモデルやHTTPのpull型通信を用いた時系列収集が特徴で、グラフやダッシュボードがサポートされています。
Grafanaとは
GrafanaはPrometheusやInfluxDBと連携してグラフ描写を行えるデータダッシュボードソフトウェアです。
Prometheusにデフォルトで付いているグラフ描写機能はカスタマイズ性が少なくて監視するサーバの数が多くなるとただただ見にくいので、Grafanaで独自にカスタマイズしたダッシュボードを使うことがオススメです。
Alertmanagerとは
Alertmanagerは、クライアントに障害が起きたときにメール、Slack、Hipchatなどに通知を送ることができます。
通知を行うルール自体はPrometheusに設定しておきます。Alertmanagerではどのツールに通知を送るかを定義します。
実装
最終的なディレクトリ構成は次のようになります。
├── docker-compose.yaml
├── prometheus
│   ├── alert.rules
│   └── prometheus.yaml
└── alertmanager
    └── config.yaml
docker-compose.yaml
まずはdocker-compose.yamlです。alertを試すためにダミーでnode-exporterのコンテナを作ります。
version: '3'
services:
  prometheus:
    image: prom/prometheus
    container_name: prometheus
    volumes:
      - ./prometheus:/etc/prometheus
    command: "--config.file=/etc/prometheus/prometheus.yaml"
    ports:
      - 9090:9090
    restart: always
  exporter:
    image: prom/node-exporter:latest
    container_name: node-exporter
    ports:
      - 9100:9100
    restart: always
  grafana:
    image: grafana/grafana
    container_name: grafana
    ports:
      - 3000:3000
    restart: always
  alertmanager:
    image: prom/alertmanager
    container_name: alertmanager
    volumes:
      - ./alertmanager:/etc/alertmanager
    command: "--config.file=/etc/alertmanager/config.yaml"
    ports:
      - 9093:9093
    restart: always
prometheus.yaml
次にprometheus.yamlです。監視対象、通知ルール、alertmanagerへの通知を定義します。
global:
  scrape_interval:     15s
  evaluation_interval: 15s
  external_labels:
      monitor: 'codelab-monitor'

rule_files:
  - /etc/prometheus/alert.rules

alerting:
  alertmanagers:
    - scheme: http
      static_configs:
      - targets:
        - alertmanager:9093

scrape_configs:
  - job_name: 'prometheus'
    static_configs:
      - targets:
        -  prometheus:9090
        -  node-exporter:9100
alert.rules
次にalert.rulesです。ここではインスタンスが5分間ダウンしていたら通知を送るよう設定します。
groups:
- name: example
  rules:
  - alert: instance_down
    expr: up == 0
    for: 5m
    labels:
      severity: critical
    annotations:
      summary: "Instance {{ $labels.instance }} down"
      description: "{{ $labels.instance }} of job {{ $labels.job }} has been down for more than 5 minutes."
config.yaml
最後にconfig.yamlです。これはalertmanagerがどこに通知を行うかを設定します。今回はSlackに通知を行くよう設定します。
global:
  slack_api_url: 'https://hooks.slack.com/services/***/***/******'

route:
  receiver: 'slack'

receivers:
  - name: 'slack'
    slack_configs:
    - channel: '#alerts'
実行
実際に試してみましょう。
$ docker-compose up -d
確認
Prometheus
http://localhost:9090/targetsにアクセスしてみます。
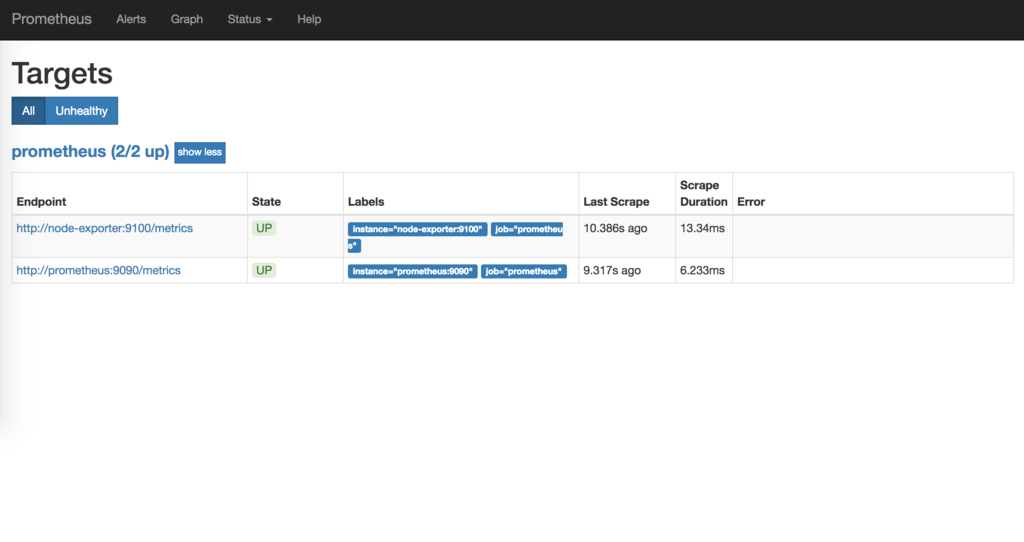
2つのインスタンスの状態がupであることを確認できます。
Grafana
http://localhost:3000にアクセスします。初回はユーザ名とパスワードを要求されますがadmin/adminで大丈夫です。ログインしたら左側のメニューからDashboardsを選びData Sources選択画面に移ります。
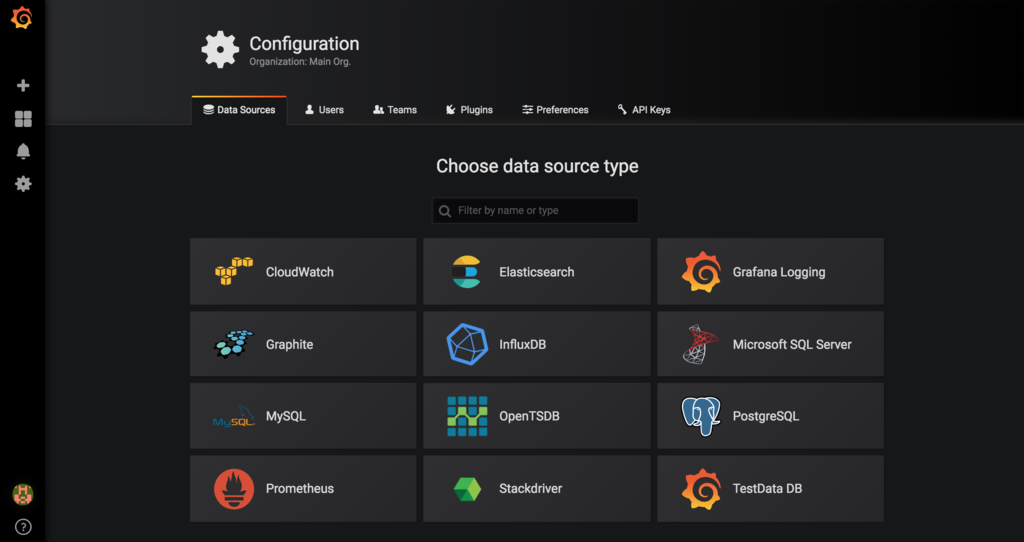
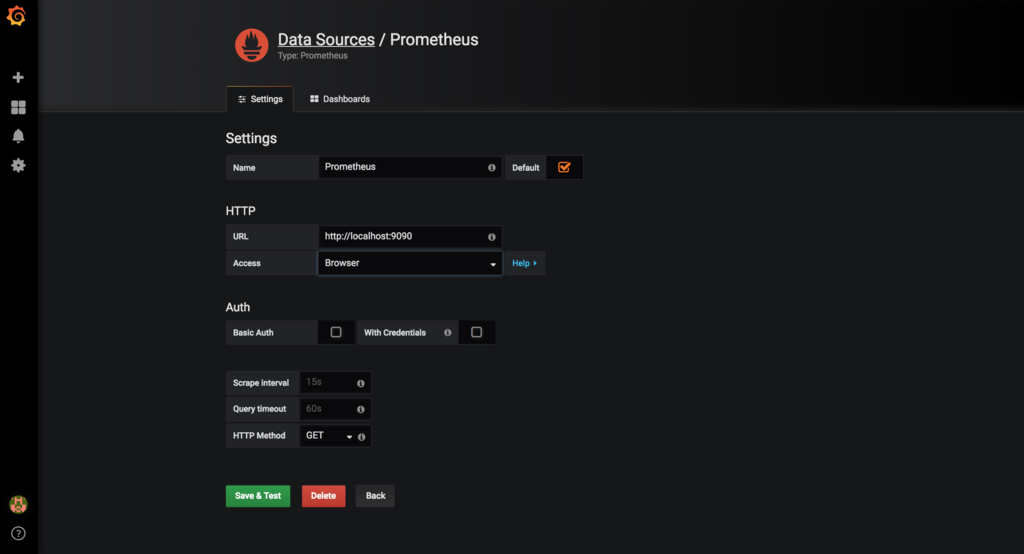
Data SourcesにPrometheusを選択すると下の画面が表示されますが、HTTPのURLにhttp://localhost:9090、AccessにBrowserを選択しSave&Testボタンを押せば設定完了です。
DashboardsタブからPrometheus 2.0 Statsをimportします。

実際にダッシュボードを見てみましょう。デフォルトで色々なグラフが表示されています。自分でカスタマイズも可能です。

Alertmanager
http://localhost:9093/#/statusにアクセスします。きちんとSlackの情報がconfigに書かれていることを確認します。
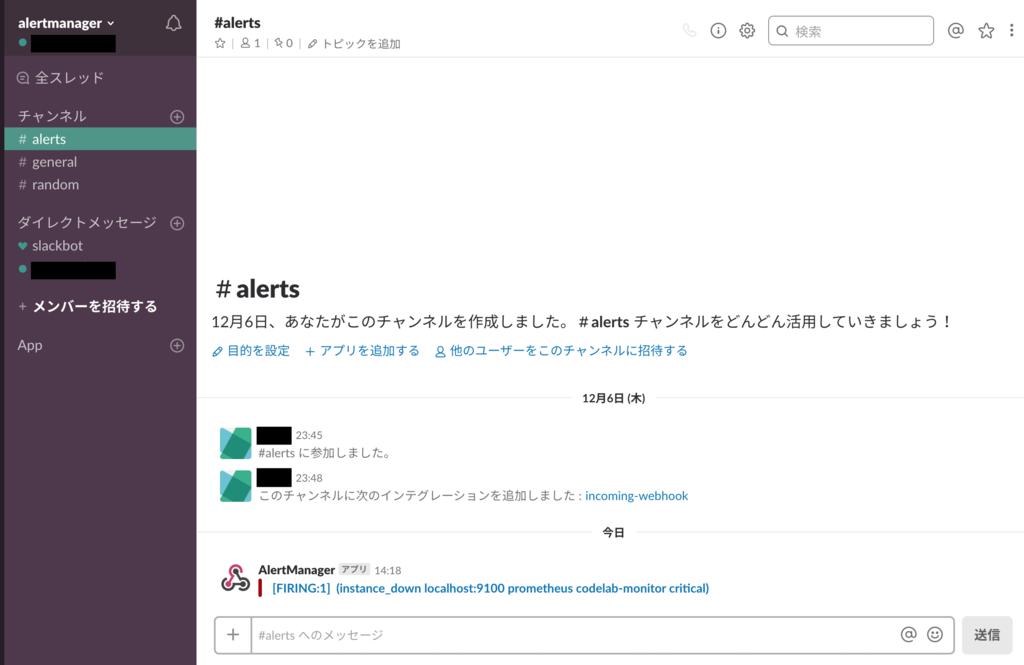
この設定がうまくいっていないとデフォルト設定のままとなってしまい、Slackに通知することができません。試しにnode-exporterのコンテナをstopさせます。
$ docker container stop node-exporter
すると5分後Slackに通知が来るが確認できます。
まとめ
Dockerを用いてPrometheus、Grafana、Alertmanagerのコンテナを作成し、Slackへの通知の流れを説明しました。ちなみに、Grafanaのグラフは設定ファイルから作成できるのでDockerを用いる場合はファイル作成した方が良いです。