はじめに
地図の可視化は情報を直感的に捉えやすくする強力な手段となっています。その中でも、ipyleafletはJupyter Notebook上で地図を簡単に表示・操作するためのライブラリとして注目を浴びています。Pythonのコードを数行書くだけで、対話的な地図を手軽に描画できるため、多くのデータサイエンティストや研究者に利用されています。
国土交通省のデータを題材に、ipyleafletの魅力を活かして、情報の可視化方法を紹介します。国土交通省は、様々な地域情報を公開しており、このような公開データは、都市計画や不動産の評価、環境問題の分析など多岐にわたる用途で活用されています。データを視覚的に捉えることで、抽象的な数字や文字情報を具体的な形に変換し、情報の深い理解を得ることができます。
方法
データの入手
国土交通省の公式サイトから、必要なデータをダウンロードします。以下の手順でデータを入手できます。
- 国土交通省のデータダウンロードページへアクセスします。
- ページ内で「A29-11_27_GML.zip」というファイル名を探します。この例では大阪のデータを使用していますが、他の都道府県のデータを利用する場合は、ファイル名の数字部分を適宜読み替えてください。
- ファイルをダウンロードし、適当な場所に解凍します。解凍すると、「A29-11_27.xml」というXMLファイルが得られます。このXMLファイルが今回の分析で使用する主要なデータとなります。
データの一部変更
ダウンロードしたXMLデータのスキーマURLがリンク切れしているため修正が必要です。具体的には、ファイルの7行目の以下の部分:
xmlns:schemaLocation="http://nlftp.mlit.go.jp/ksj/schemas/ksj-app KsjAppSchema-A29-v1_0.xsd">
を、以下のURLに変更します:
xmlns:schemaLocation="https://nlftp.mlit.go.jp/ksj/jpgis/xsd/KsjAppSchema.xsd">
実装
以下の内容をjupyterで実行してください。
from ipyleaflet import Map, Polygon, basemaps, LegendControl
from lxml import etree
import tqdm

color_dic = {
    "第一種低層住居専用地域": "#440154",
    "第二種低層住居専用地域": "#481f70",
    "第一種中高層住居専用地域": "#443983",
    "第二種中高層住居専用地域": "#3b528b",
    "第一種住居地域": "#31688e",
    "第二種住居地域": "#287c8e",
    "準住居地域": "#21918c",
    "近隣商業地域": "#20a486",
    "商業地域": "#35b779",
    "準工業地域": "#5ec962",
    "工業地域": "#90d743",
    "工業専用地域": "#c8e020",
    "不明": "#fde725",
    }

# XMLをパースする
tree = etree.parse('A29-11_27.xml')
root = tree.getroot()

# 地図の描画
m = Map(center=(34.70299001403928, 135.49518904821613), zoom=15, basemap=basemaps.CartoDB.Positron)

nsmap = {
    'ksj': 'http://nlftp.mlit.go.jp/ksj/schemas/ksj-app',
    'gml': 'http://www.opengis.net/gml',
    'xlink': 'http://www.w3.org/1999/xlink'
}

def add_polygon_to_map(m, coordinates, kda):
    polygon = Polygon(
        locations=coordinates,
        color="transparent",
        fill_color=color_dic[kda],
        fill_opacity=0.6
    )
    m.add_layer(polygon)


for area in tqdm.tqdm(root.findall('.//ksj:DesignatedArea', namespaces=nsmap)):
    surface_ref = area.find('ksj:cda', namespaces=root.nsmap).attrib['{http://www.w3.org/1999/xlink}href'].lstrip('#')
    use_name = area.find('ksj:kda', namespaces=root.nsmap).text
    curve_ref = root.find('.//gml:Surface[@gml:id="{}"]/gml:patches/gml:PolygonPatch/gml:exterior/gml:Ring/gml:curveMember'.format(surface_ref), namespaces=root.nsmap).attrib['{http://www.w3.org/1999/xlink}href'].lstrip('#')
    coords = root.find('.//gml:Curve[@gml:id="{}"]/gml:segments/gml:LineStringSegment/gml:posList'.format(curve_ref), namespaces=root.nsmap).text.split()
    coords = [(float(coords[i]), float(coords[i+1])) for i in range(0, len(coords), 2)]
    add_polygon_to_map(m, coords, use_name)

legend = LegendControl(color_dic, position="topright")
m.add_control(legend)
m
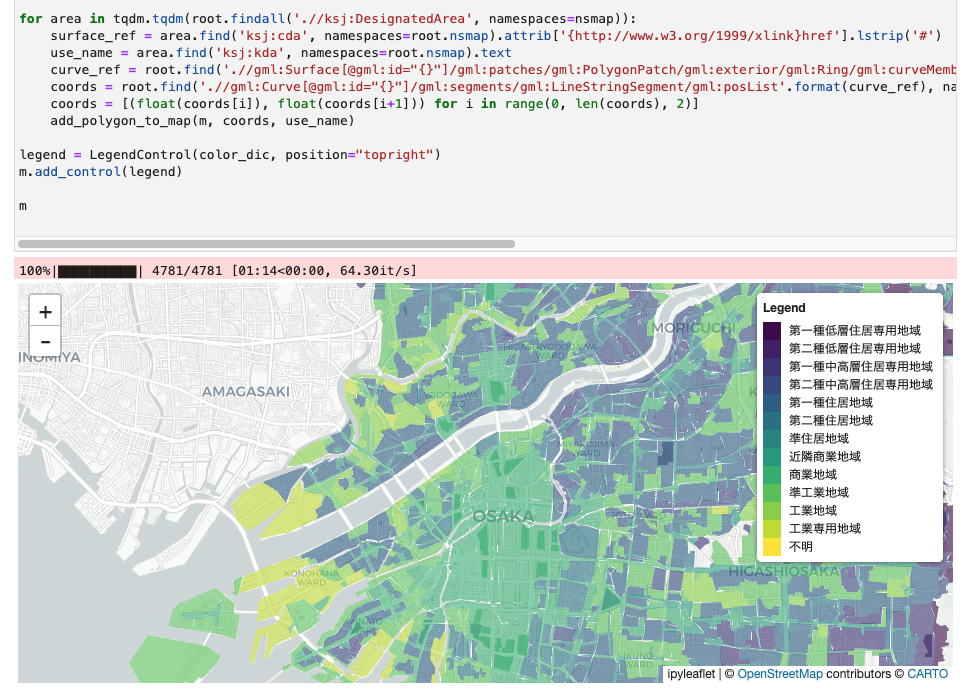
以下のように可視化できるはずです。
結論
本記事を通じて、地理データの可視化の重要性とその実現方法を紹介しました。特に、ipyleafletは地理データの可視化において非常に有効なツールであることが確認できました。国土交通省のような信頼性のあるデータソースを活用することで、さまざまな情報を効果的に伝えることができると感じました。機会があれば、国土数値情報の他のデータセットも探索し、可視化してみたいと思います。
