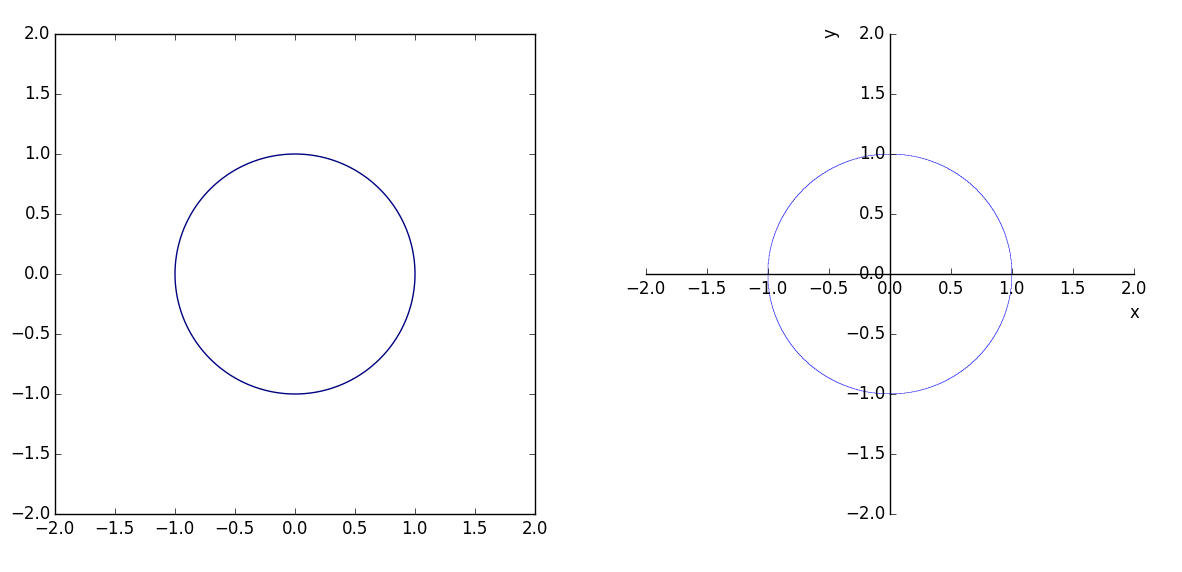
陰関数の描画
陰関数とは,$f(x,y)=0$のうち,陽な形に変形することが難しいものをいいます.
円$x^2+y^2-1=0$などが代表的です.
変形できなくもないですが,場合分けが必要になるので,グラフを書く場合にはあまりスマートではないです.
こういった時,contourが便利です.
import matplotlib.pyplot as plt
import numpy as np

delta = 0.025
xrange = np.arange(-2, 2, delta)
yrange = np.arange(-2, 2, delta)
X, Y = np.meshgrid(xrange,yrange)

# 軸の設定
plt.axis([-2, 2, -2, 2])
plt.gca().set_aspect('equal', adjustable='box')

# 描画
Z=X**2+Y**2-1
plt.contour(X, Y, Z, [0])
plt.show()
コード中のplt.contour(X, Y, Z, [0])が, Z=0の等高線を描きます.
[-1,0,1]と指定すると,等高線が追加されていきます.かしこいですね.
他の方法
かなり短くかけますが,$-\epsilon<f(x,y)<\epsilon$を塗っているだけな気がします.
from sympy import *
x, y = symbols("x y")
Z=x**2+y**2-1
plot_implicit(Z, (x, -2, 2), (y, -2, 2))
