ポイント
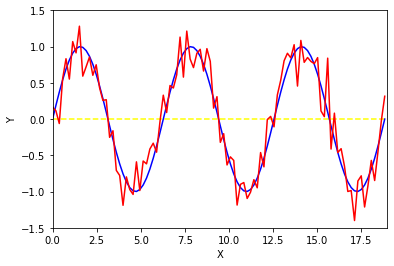
➀波形データは時系列解析などで重要となってくる。ノイズ生成やノイズ除去の方法について整理しておく必要がある。
➁波形データの特徴量
・振幅(基線からの波の振れ幅)
・周期(一回振動するのにかかる時間)
・振動数(一秒間あたりに振動する回数)
・波長(一回振動するときのx軸方向の長さ)
➂sin波のy座標に対して乱数値を足し合わせることによって、ノイズを表現することができる。
➃今回のグラフ表示には、matplotlibを使用した。このライブラリの機能の特徴としては、
・グラフを重ね合わせて表示することができる。
・表示範囲について、X軸もしくはY軸方向の最大値・最小値を設定することができる。
・表示する曲線の色や点線の有無などの設定をすることができる。
・ラベル、Grid線、凡例(Legend)の表示を行うことができる。
・横線や縦線を引くことができる。
ソース
import numpy as np
import matplotlib.pyplot as plt
n=100 #x軸方向のデータ数
xmin, xmax = 0,19
# x軸方向の範囲(0~6π)にかけて、100個のx座標データを用意する。
x = np.linspace(0, 6*np.pi, n)
# きれいなsin波とノイズ入りsin波の準備
y=np.sin(x)
y_noise= y + 0.2 * np.random.randn(n)
# 波形の描写
p = plt.plot(x, y, "blue", linestyle='solid')
p = plt.plot(x, y_noise, "red", linestyle='solid')
p = plt.hlines([0], xmin, xmax, "yellow", linestyles='dashed')     # 基線

p = plt.xlim(xmin, xmax)
p = plt.ylim(-1.5, 1.5)
p = plt.xlabel('X')
p = plt.ylabel('Y')
plt.show(p)
