TL;DR
Chromeで console.profile() と console.profileEnd() を使うと超簡単にJSの実行パフォーマンスを解析できる、という事実を今日知ったのでシェアさせていただきます。
やりたいこと
JSの任意の関数の実行プロファイル (コールスタックごとの所要時間) を見たい。
やりかた
Google Chromeのデバッグコンソールで以下のようなスクリプトを入力して実行 (見やすくするため改行入れてますが実際には一行で)
console
console.profile();
xxxxx(); // 解析したい処理
console.profileEnd()
実行されると以下のようにログが出力されます。
output
Profile 'Profile 1' started.
Profile 'Profile 1' finished.
んで、Profileタブを開くと、実行プロファイルが出力されいます。
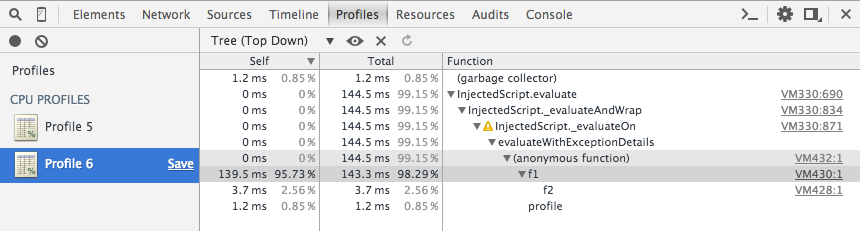
コールスタックごとの処理時間が分かって超便利 \(^o^)/
参照
以上です。