SignalFXとは
realtimeでの各サーバ、マイクロサービスのモニタリング、アプリケーションのトレースなんかをやってくれるツールです。
最近、splunkに買収されたみたいなので、metricsストアに組み込まれていくんですかね、、、
下の図で見ればなんとなくわかりますね。ApplicationのMetrics,Trace、Dockerやk8sのリソースをSingalFx
に集めて、Debug / Tracing /Alert / Visualizationもやってくれるみたいっすね。
アプリケーションのトレーシングは全部取得してくれる(他製品のようにサンプリングではない)、metricsは1秒単位で取得できるらしいので、その辺が強い感じですかね。

どうやってデータを収集してる?
データの収集については、基本はSignalFx smaer Agent(Agentベース)だけど、その他多くのpluginが用意されてるみたいです。AWS,GCP,AzureはもちろんSparkやCassandra,k8sもpluginが用意されてるみたい。

Timeseriesのデータとmetadataを別々に取得するアーキテクチャーみたいっすね。

Traceデータについては、Trace用のデータに入れるみたい。
とりあえずやってみましょう。
SingnaFxに登録
ホームページの右上に14dayのFree trailがあるので、こっから登録しましょう。
Agentのインストール方法
SignalFxにログイン後、menubarのIntegrationから、SingalFx Smart Agentを選択します。
そうすると、インストラクションがでてくるので、その通りに実行します。
今時のモニタリングサービスと一緒ですね。コピペでagentインストール完了です。

インストール後、起動のチェックをかけます。
statusの他に、config,endpointで情報を取れるみたいです。
root@ip-172-31-22-149:~# sudo signalfx-agent status
SignalFx Agent version:           4.13.0
Agent uptime:                     26m27s
Observers active:                 host
Active Monitors:                  10
Configured Monitors:              10
Discovered Endpoint Count:        9
Bad Monitor Config:               None
Global Dimensions:                {host: ip-172-31-22-149, AWSUniqueId: i-044c2ea8e77605846_ap-northeast-1_935995623716}
Datapoints sent (last minute):    246
Datapoints failed (last minute):  0
Events Sent (last minute):        6
Trace Spans Sent (last minute):   0

Additional status commands:

signalfx-agent status config - show resolved config in use by agent
signalfx-agent status endpoints - show discovered endpoints
signalfx-agent status monitors - show active monitors
signalfx-agent status all - show everything
root@ip-172-31-22-149:~#
また、実際のConfigファイル自体は、yamlで生成されていて、monitorの箇所で、なにをmonitoringするかを定義しています。
root@ip-172-31-22-149:~# cat /etc/signalfx/agent.yaml
---
# *Required* The access token for the org that you wish to send metrics to.
signalFxAccessToken: {"#from": "/etc/signalfx/token"}
ingestUrl: {"#from": "/etc/signalfx/ingest_url", default: "https://ingest.signalfx.com"}
apiUrl: {"#from": "/etc/signalfx/api_url", default: "https://api.signalfx.com"}
cluster: {"#from": "/etc/signalfx/cluster", optional: true}

intervalSeconds: 10

logging:
  # Valid values are 'debug', 'info', 'warning', and 'error'
  level: info

# observers are what discover running services in the environment
observers:
  - type: host

monitors:
  - {"#from": "/etc/signalfx/monitors/*.yaml", flatten: true, optional: true}
  - type: host-metadata
  - type: collectd/cpu
  - type: collectd/cpufreq
  - type: collectd/df
  - type: collectd/disk
  - type: collectd/interface
  - type: collectd/load
  - type: collectd/memory
  - type: collectd/signalfx-metadata
  - type: collectd/vmem

enableBuiltInFiltering: true
root@ip-172-31-22-149:~#
metricsタブには取得する/できるMetricsの一覧が書かれているので、参考にするとよいかも。

モニタリングの確認をしてみる
Signal Fxのmenu barにあるInfrastructureからHosts(SmartAgent/collectd)を選択してみると、hostの簡易一覧が表示される。

ホストでドリルダウン
基本的に必要な項目は自動で取得できている。

リソースでドリルダウン
リソースの文字をチェックすると、さらにドリルダウンできるようになっている。

F(x)の箇所を選択すると、集計の方法(sum,avg,medianなどを選択可能)

Visualizationも左上のアイコンをクリックすれば、好きなように変更可能。


Dashboard
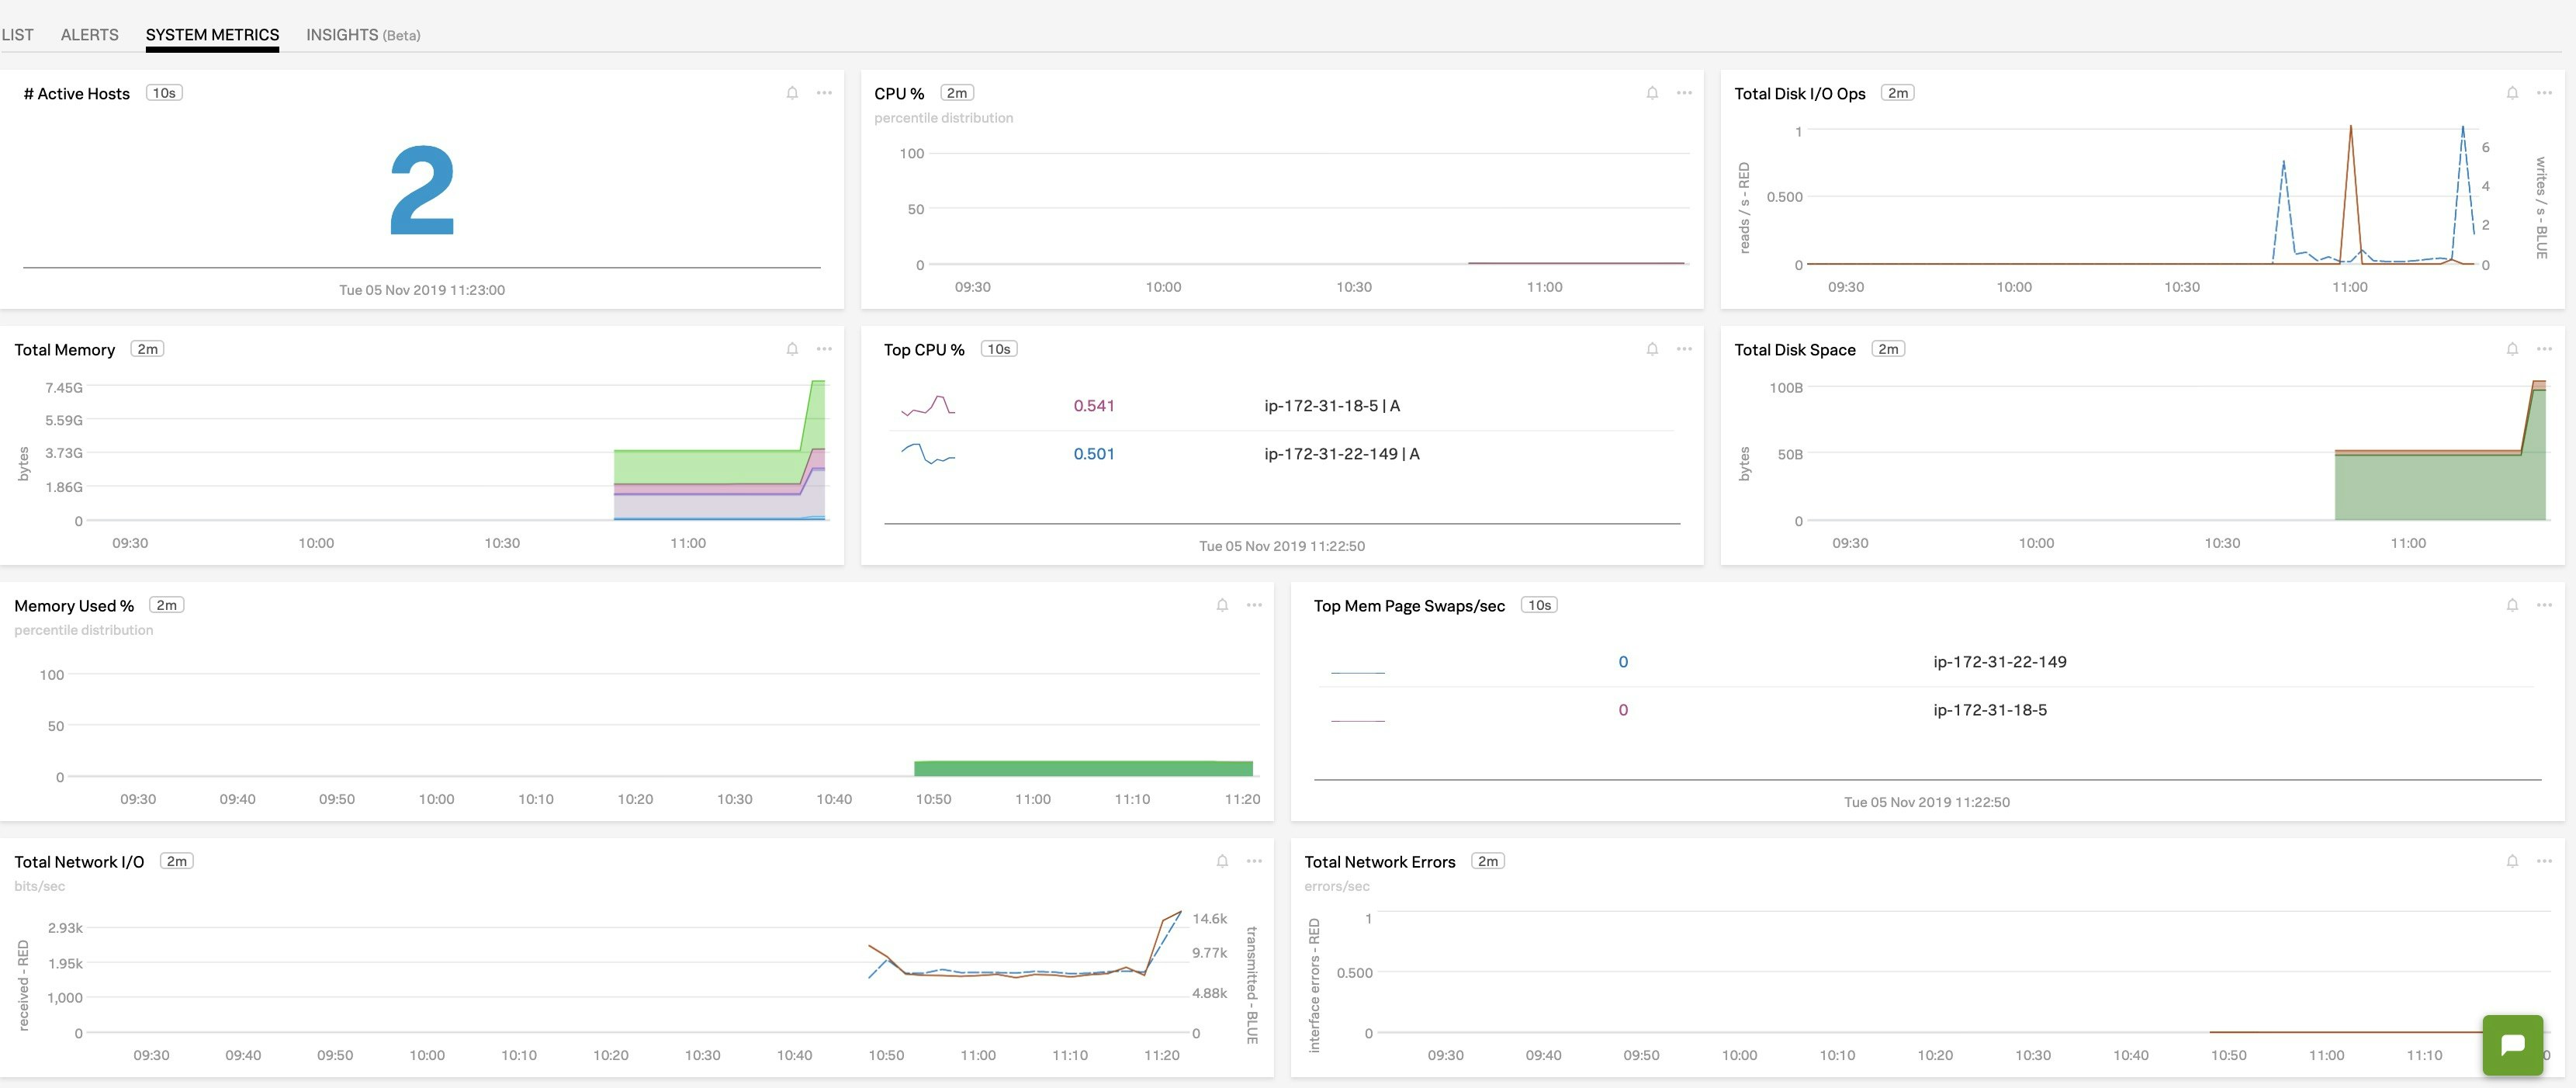
defaultのdashboardを確認してみる。左上のDashboard → Infrastructureを選択すると
全体のリソースをまとめた画面が表示される。

Dashboardを自作してみる
メニューバーの右上にある+のアイコンをクリックして、dashboardをクリック。

右側にmetrics(Browse Metrics Bar)をクリックして表示したいmetricsをそれぞれ埋め込んでいきます。

Sample Dashboard
サンプルのリアルタイムにデータを取得するdashboardをみてみると、結構レスポンスも早いし、なんかよさそうっすね。

さいごに
まずはこんな感じで基本的な使い方をまとめてみました。
あとで、awsや、その他のミドルウェアとの連携もやってみますねー。