概要
matplotlibのグラフにマーカーとして画像を使う方法。AnnotationBboxを使いました。
コード
import
import numpy as np
import matplotlib.pyplot as plt
from matplotlib.offsetbox import OffsetImage, AnnotationBbox
つかうものをimport
anotation_picture
def imscatter(x, y, image, ax=None, zoom=1):
    if ax is None:
        ax = plt.gca()
    try:
        image = plt.imread(image)
    except:
        pass
    im = OffsetImage(image, zoom=zoom)
    artists = []
    for x0, y0 in zip(x, y):
        ab = AnnotationBbox(im, (x0, y0), xycoords='data', frameon=False)
        artists.append(ax.add_artist(ab))
    return artists
- axが設定されてないときは現在のグラフをaxに設定
-
plt.imread()で画像の読み込み - annotationにいれるために
OffsetImage()に画像ファイルを入れる。 - 空のartistsをつくって、x,yの各データに
AnnotationBboxでdataの位置に図を挿入。- xycoodsはannotationを表示する位置の設定で、'data'でdataと同じスケールで位置の設定ができる。他には、左下を(0,0)右上を(1,1)とする'axes fraction'などがある。
- frameonは画像の枠線の設定でFalseで非表示。
-
artists.append(ax.add_artist(ab))でabをaxに追加して、それをartistsに追加する。
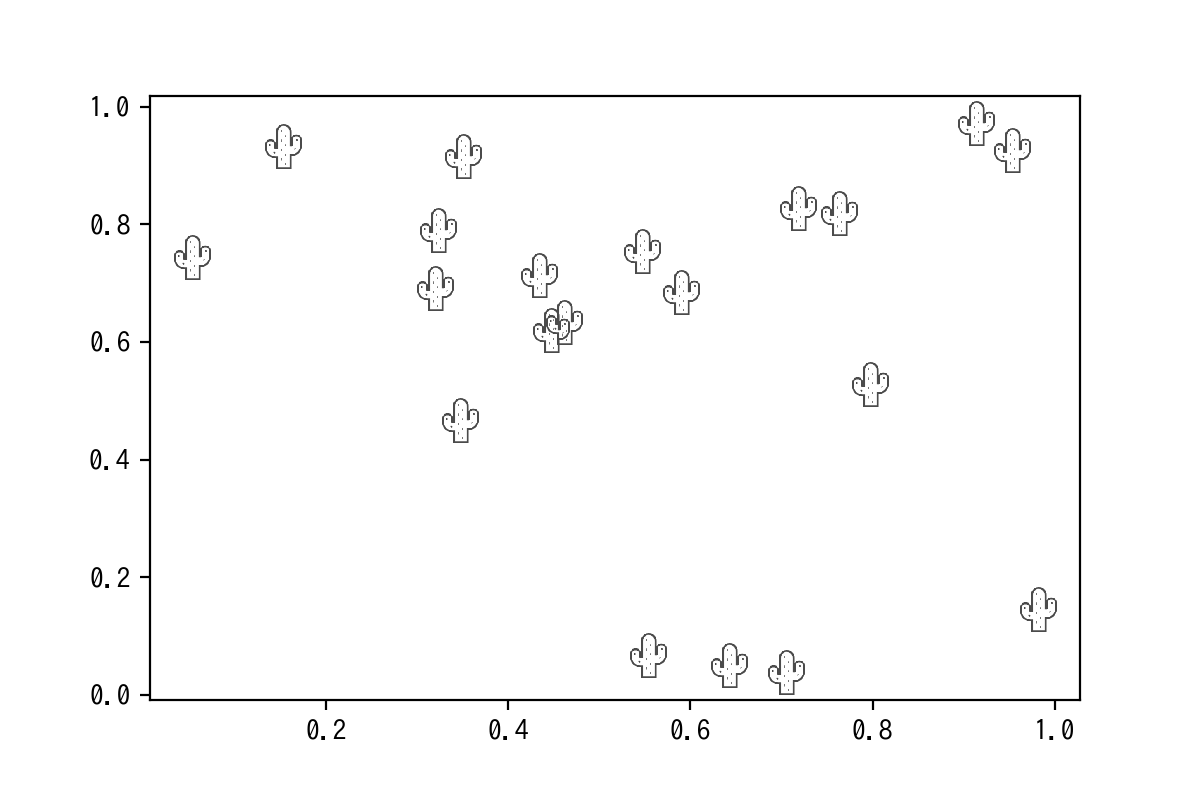
plot
x,y =np.random.rand(2, 20)#データ生成
image_path = 'cactus.png'
fig, ax = plt.subplots()
imscatter(x, y, image_path, ax=ax,  zoom=.25)
ax.plot(x, y, 'ko',alpha=0)
ax.autoscale()
plt.show()
- image_pathはファイルのpath,今回のファイルはこちらでダウンロード。
- imscatterで画像をプロット、zoomで拡大縮小の設定ができる。
- alpha=0で透明にしてプロット,こうしないとautoscaleが効かない。