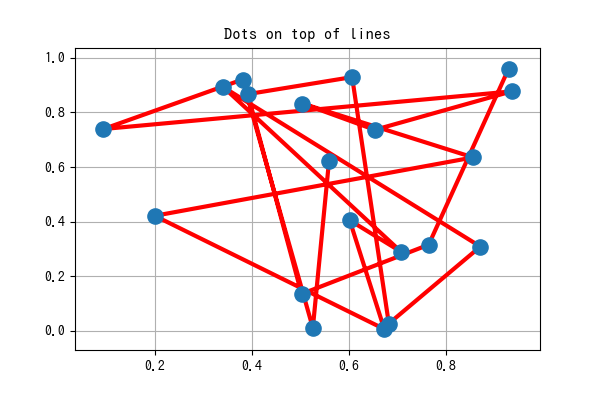
grid
gridが最前面にきて、plotに覆いかぶさることがたまにあります。
この場合、axisbelow(True)でgridが最背面に移動します。
## axの場合
ax.set_axisbelow(True)
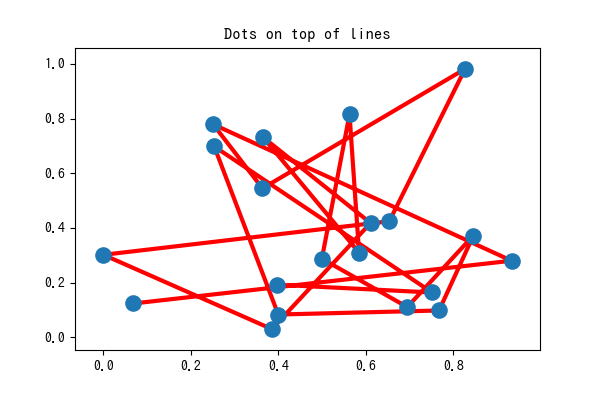
## rcParamsの場合
plt.rcParams['axes.axisbelow'] = True
plotの表示順
plotの表示順はzorderで設定できます。
zorderとは平面上のxy軸に対して、奥行きのz軸に関する設定です。
値を大きくすることでプロットを手前にもってくることができます。
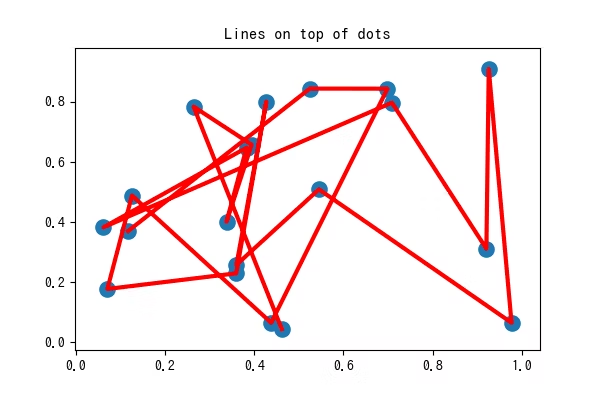
線のzorderが1, 丸のzorderが2
plt.plot(x, y, 'r', zorder=1, lw=3)
plt.scatter(x, y, s=120, zorder=2)
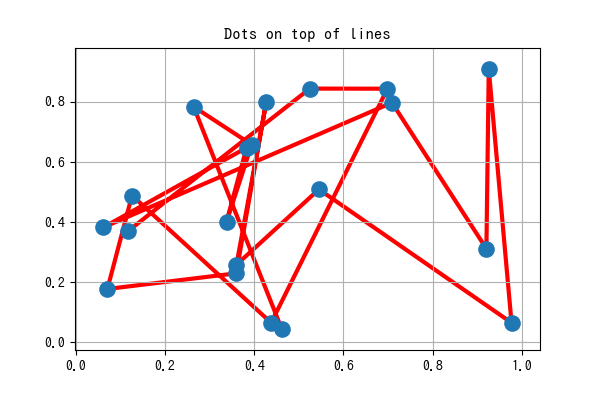
線のzorderが2, 丸のzorderが1
plt.plot(x, y, 'r', zorder=2, lw=3)
plt.scatter(x, y, s=120, zorder=1)