追記
大学別のレート分布も出しました。
-> AtCoderの大学別レート分布を出してみた
きっかけ
レート分布に興味があったので、はじめは手入力でグラフを作っていました。
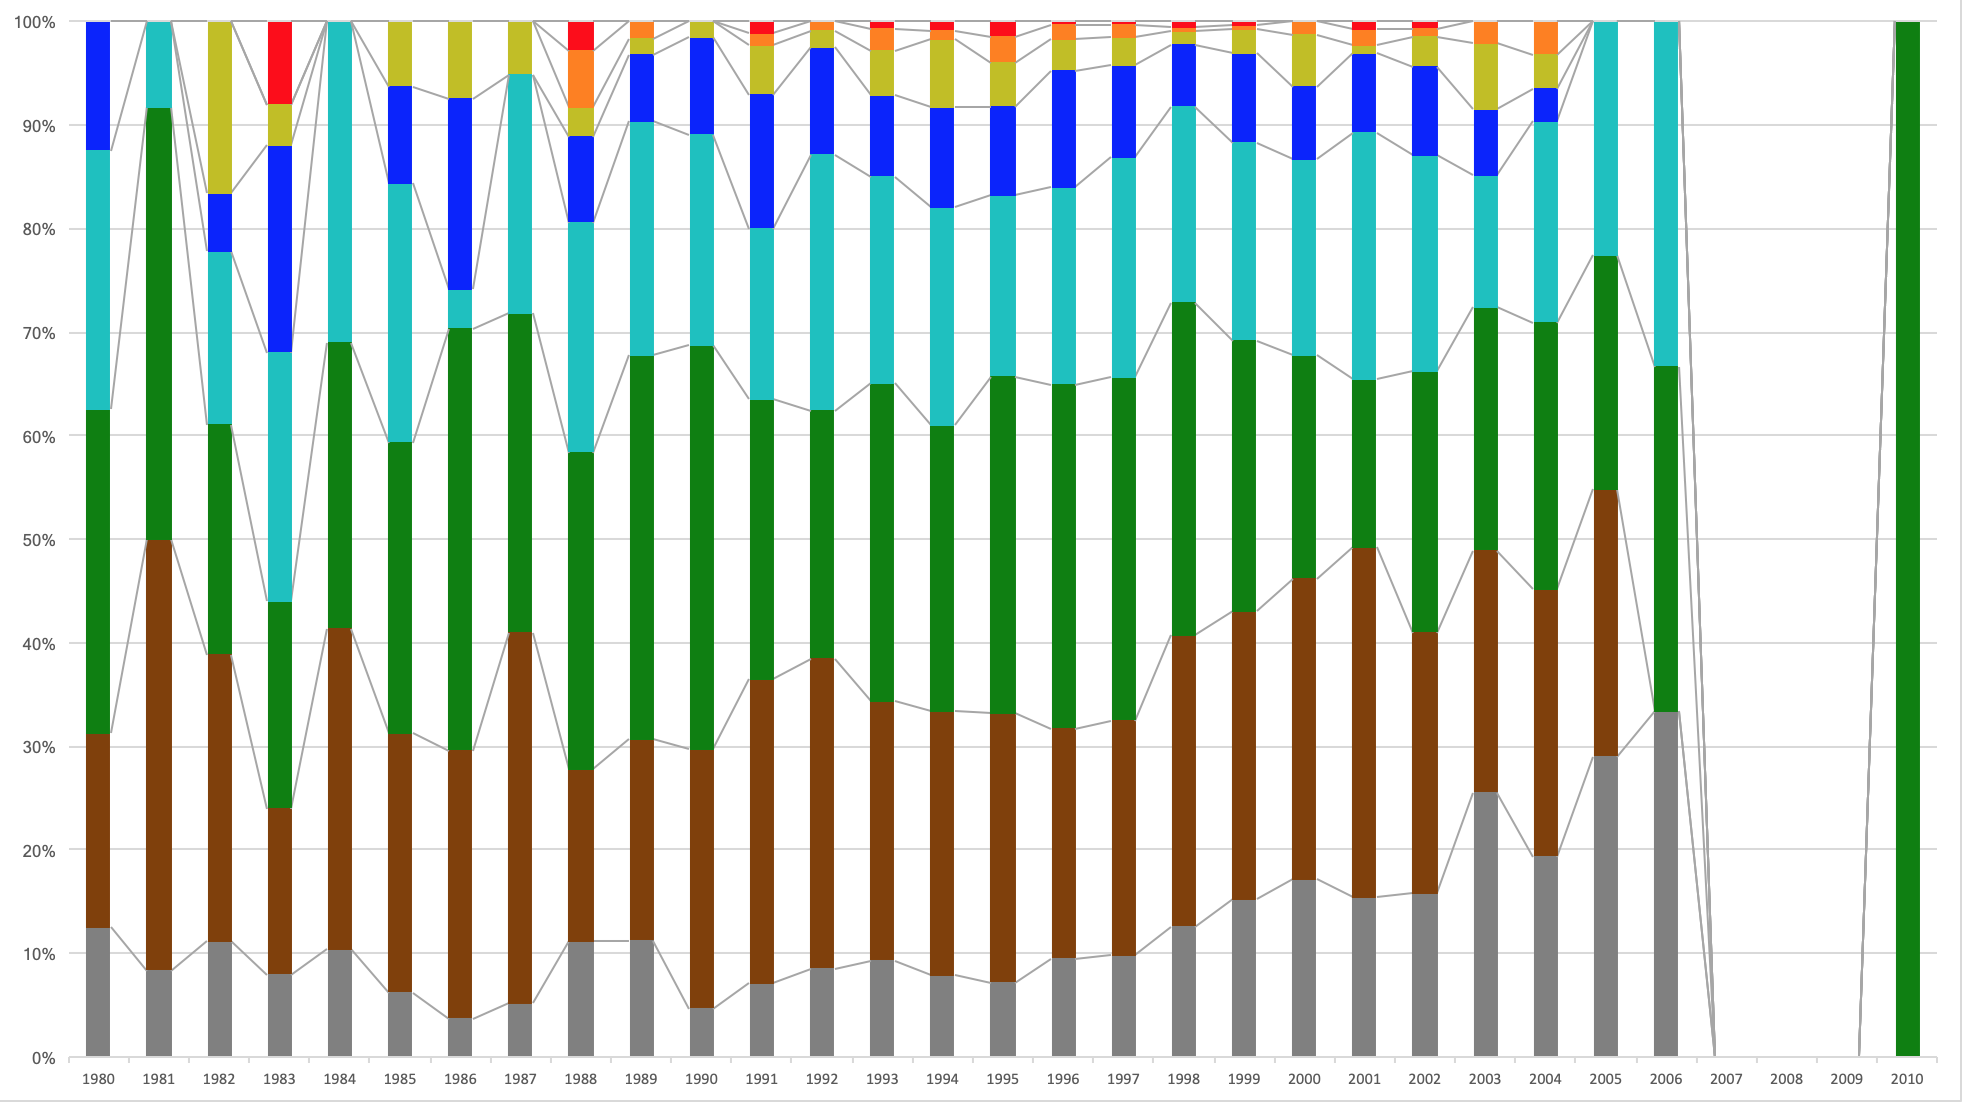
1980年〜2010年生まれのレート分布です(1枚目が各年割合、2枚目が各年人数) pic.twitter.com/2F6xLnZhRI
— saba (@saba_kpr) 2019年6月4日
しかしこれだと1回作るのに時間がかかる上、手も疲れるし入力ミスもありました。そもそもせっかくPythonが書けるのに自動化しないのはアホらしいということで、Webスクレイピングの勉強も兼ね自動化しました。
やったこと
言語: Python 3.6
ライブラリ: urllib, BeautifulSoup, csv
を用いて、 https://atcoder.jp/ranking から国籍や年代、レートなどを指定して当てはまる人数を取得できるようにしました。
PythonでのWebスクレイピングについて
・Python Webスクレイピング 実践入門
・PythonとBeautiful Soupでスクレイピング
の2つがわかりやすくて参考になります。
実装
以下のコードは条件内での誕生年ごとのレート分布を出すものです。
from urllib import request
from bs4 import BeautifulSoup
import csv

# 検索フィルタ
Affiliation = ""  # 所属
BirthYearLowerBound = 0  # 誕生年下限
BirthYearUpperBound = 9999  # 誕生年上限
CompetitionsLowerBound = 0  # コンテスト参加回数下限
CompetitionsUpperBound = 9999  # コンテスト参加回数上限
Country = "JP"  # 国籍
HighestRatingLowerBound = 0  # Rating最高値下限
HighestRatingUpperBound = 9999  # Rating最高値上限
RatingLowerBound = 0  # Rating下限
RatingUpperBound = 9999  # Rating上限
UserScreenName = ""  # ユーザ
WinsLowerBound = 0  # 優勝数下限
WinsUpperBound = 9999  # 優勝数上限


num = {}  # {誕生年: [灰色の人数, 茶色の人数, ...]} の形式で人数を入れる

# 誕生年 from_ から to_ まで
from_ = 1980
to_ = 2010

for birth in range(from_, to_ + 1):
    print("-{}-".format(birth))

    BirthYearLowerBound = birth
    BirthYearUpperBound = birth

    for rating in range(0, 3200, 400):
        print(rating)

        RatingLowerBound = rating
        if rating == 2800:  # 赤以上
            RatingUpperBound = 9999
        else:
            RatingUpperBound = rating + 399

        # フィルタを URL にセットする
        url_filter = "?f.Affiliation=" + Affiliation +\
                     "&f.BirthYearLowerBound=" + str(BirthYearLowerBound) +\
                     "&f.BirthYearUpperBound=" + str(BirthYearUpperBound) +\
                     "&f.CompetitionsLowerBound=" + str(CompetitionsLowerBound) +\
                     "&f.CompetitionsUpperBound=" + str(CompetitionsUpperBound) +\
                     "&f.Country=" + Country +\
                     "&f.HighestRatingLowerBound=" + str(HighestRatingLowerBound) +\
                     "&f.HighestRatingUpperBound=" + str(HighestRatingUpperBound) +\
                     "&f.RatingLowerBound=" + str(RatingLowerBound) +\
                     "&f.RatingUpperBound=" + str(RatingUpperBound) +\
                     "&f.UserScreenName=" + UserScreenName +\
                     "&f.WinsLowerBound=" + str(WinsLowerBound) +\
                     "&f.WinsUpperBound=" + str(WinsUpperBound) +\
                     "&page="

        url = "https://atcoder.jp/ranking"
        html = request.urlopen(url + url_filter + "0")
        soup = BeautifulSoup(html, "html.parser")

        ul = soup.find_all("ul")

        a = []

        # 指定したフィルタでのページ数を調べる
        page = 0
        for tag in ul:
            try:
                string_ = tag.get("class")

                if "pagination" in string_:
                    a = tag.find_all("a")
                    break

            except:
                pass

        for tag in a:
            try:
                string_ = tag.get("href")

                if "ranking" in string_:
                    page = max(page, int(tag.string))

            except:
                pass

        # フィルタ内順位を入れていく
        rank = []

        # 順位の最大値を調べるために、後ろから3ページほどを見る
        for i in range(max(1, page - 3), page + 1):
            html = request.urlopen(url + url_filter + str(i))
            soup = BeautifulSoup(html, "html.parser")

            td = soup.find_all("span")

            for tag in td:
                try:
                    string_ = tag.get("class").pop(0)

                    if string_ == "small":
                        rank.append(int(tag.string[1:-1]))

                except:
                    pass

        if birth not in num:
            num[birth] = []
        if rank:
            # フィルタ内順位の最大値がその人数
            num[birth].append(max(rank) + rank.count(max(rank)) - 1)
        else:
            num[birth].append(0)

print(num)

# CSV として書き出し
# 横軸が誕生年、縦軸が色(上から灰色, 茶色, ...の順)
with open("rating_{}{}_{}.csv".format(from_, to_, Country), "w") as f:
    writer = csv.DictWriter(f, num.keys())
    writer.writeheader()
    for i in range(len(num[from_])):
        row = {}
        for k, v in num.items():
            row[k] = v[i]
        writer.writerow(row)
結果
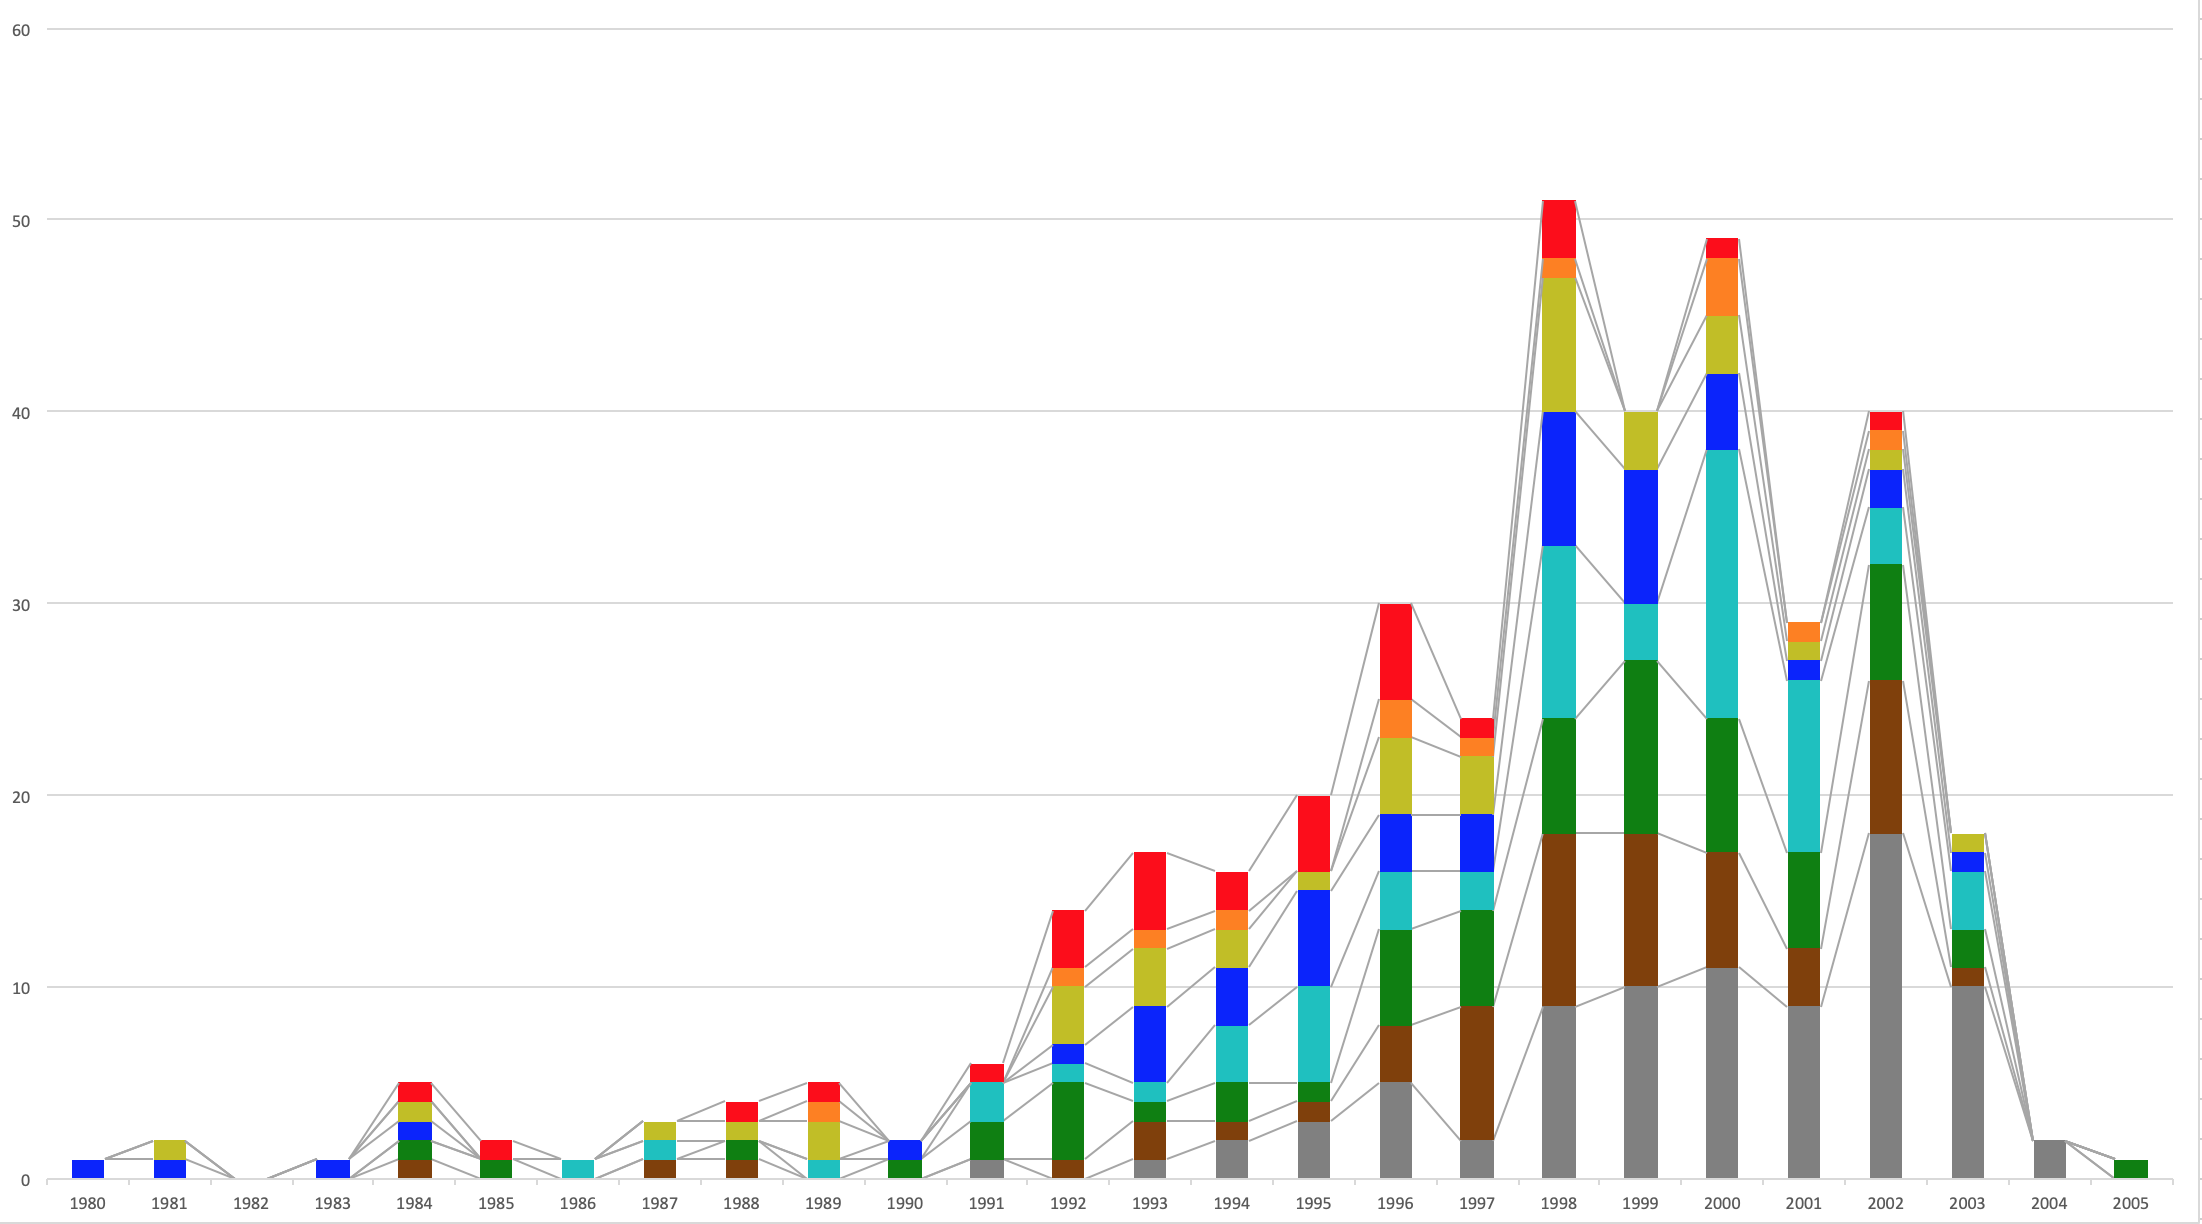
 こんな感じの CSV ファイルが出力されます。1行目は誕生年で、2行目から9行目は上から順に灰色、茶色、緑、水色、青、黄色、橙、赤のレートの人数です。あとはこれを Excel でインポートしてあげれば、以下のようなレート分布のグラフが簡単に作れます。(それぞれ、100% 積み上げ縦棒と積み上げ縦棒)


条件を変えてみる
例えば、9行目の「コンテスト参加回数下限」を以下のように変えてあげると、
CompetitionsLowerBound = 10 # コンテスト参加回数下限

このように参加回数が10回以上の人に絞ってグラフを作れます。2006年生まれ以降がほとんどいないので、こういう時は25行目を
to_ = 2005
としてあげれば、2005年生まれまでに範囲を絞れます。
注意
このレート分布は誕生年を用いているため、そもそも AtCoder のアカウントに誕生年を記載していないアカウントは含まれていません。誕生年が書かれているアカウントは全体の6割ほどなので、グラフの人数も実際の約6割になっています。
おまけ
簡単に作れるようになったので、中国とロシアの分布も作ってみました。
中国
1985年〜2010年生まれです。
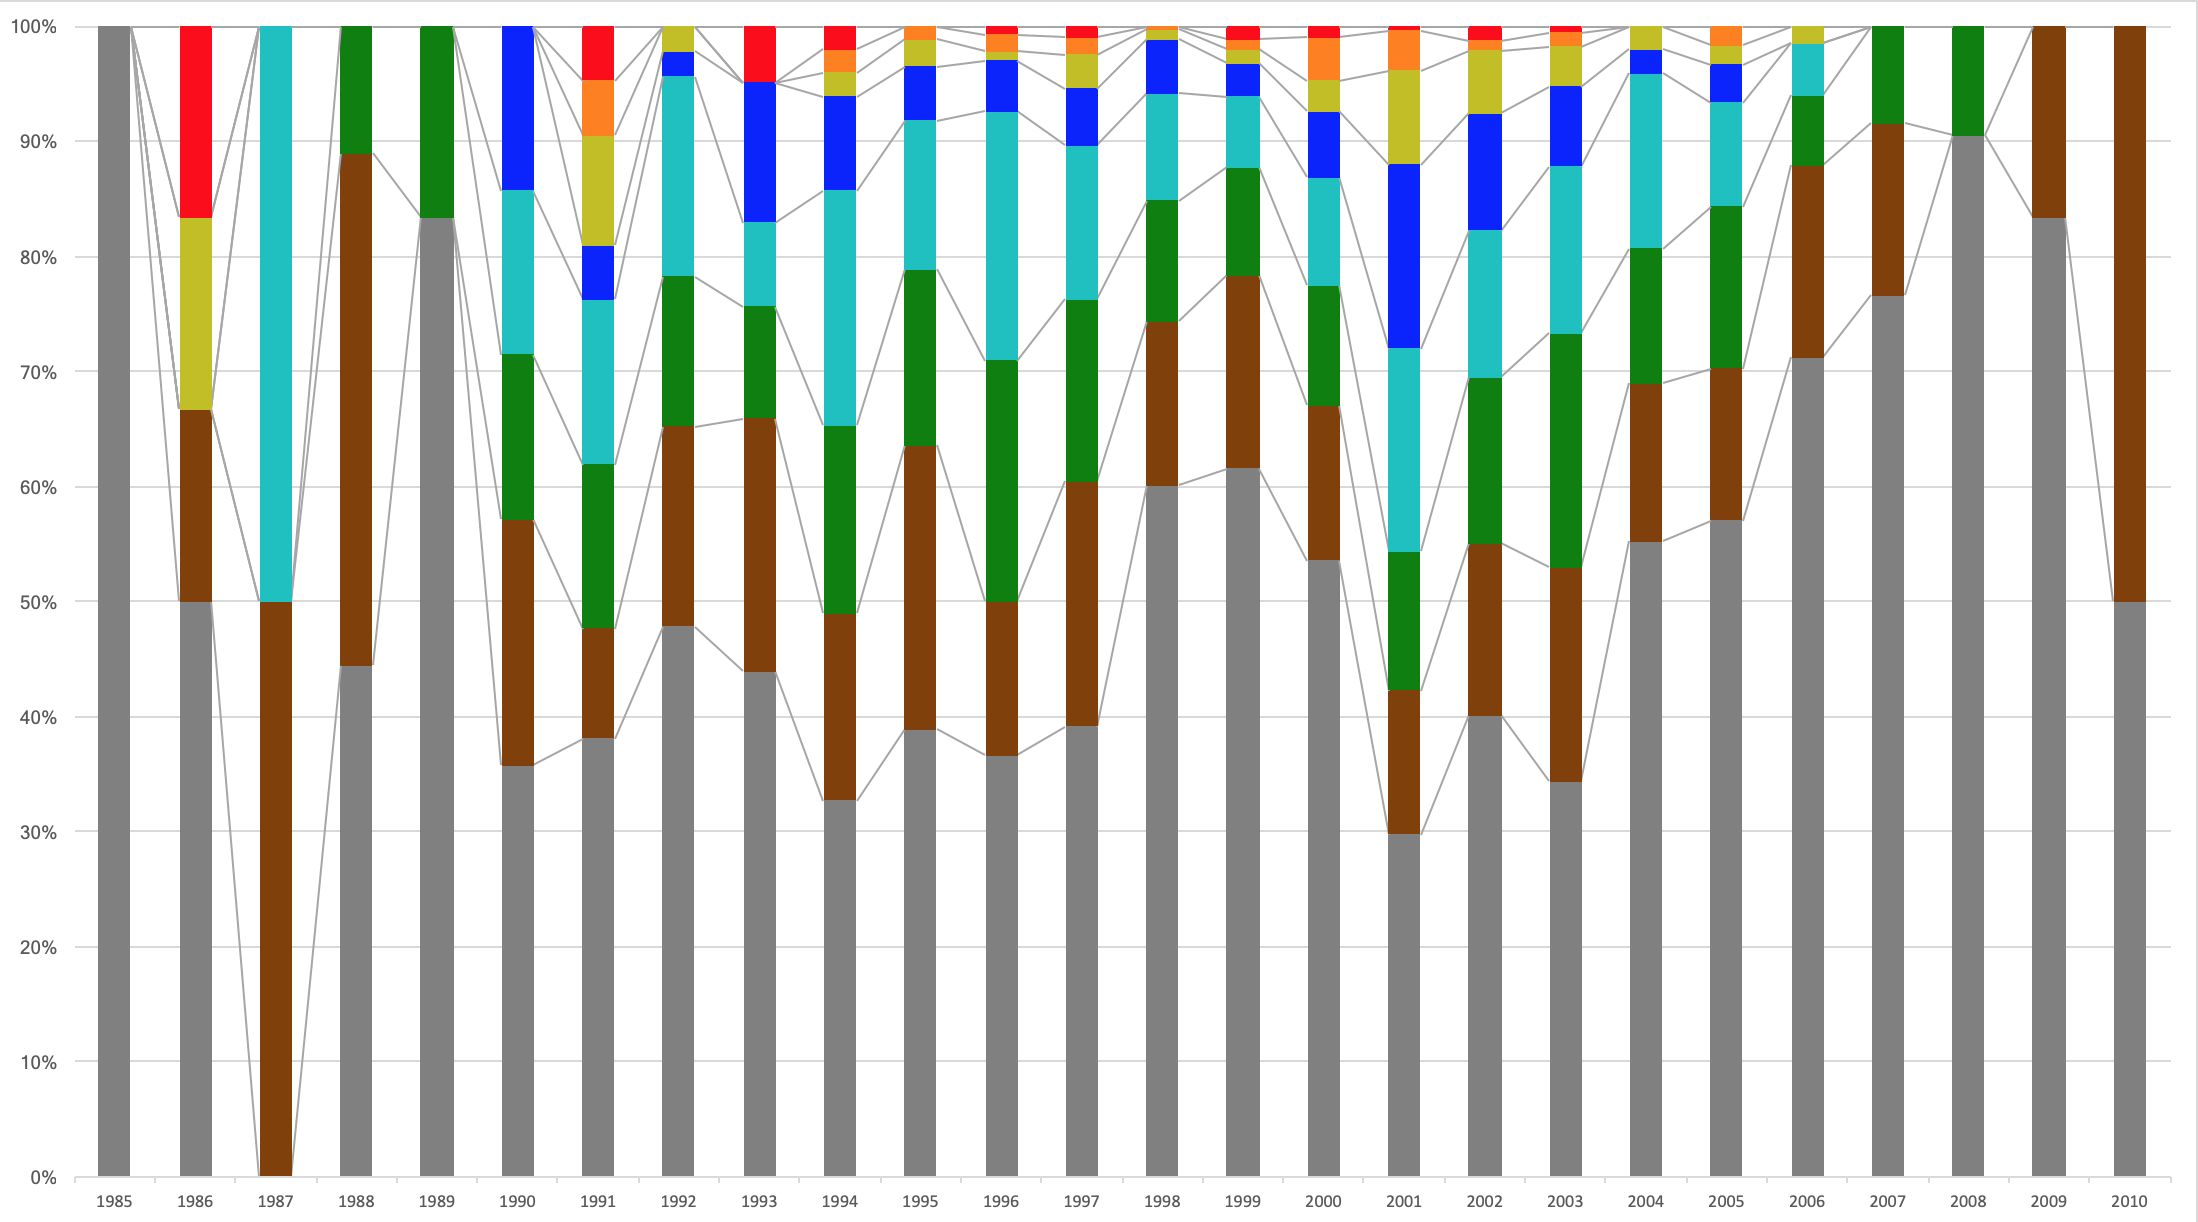
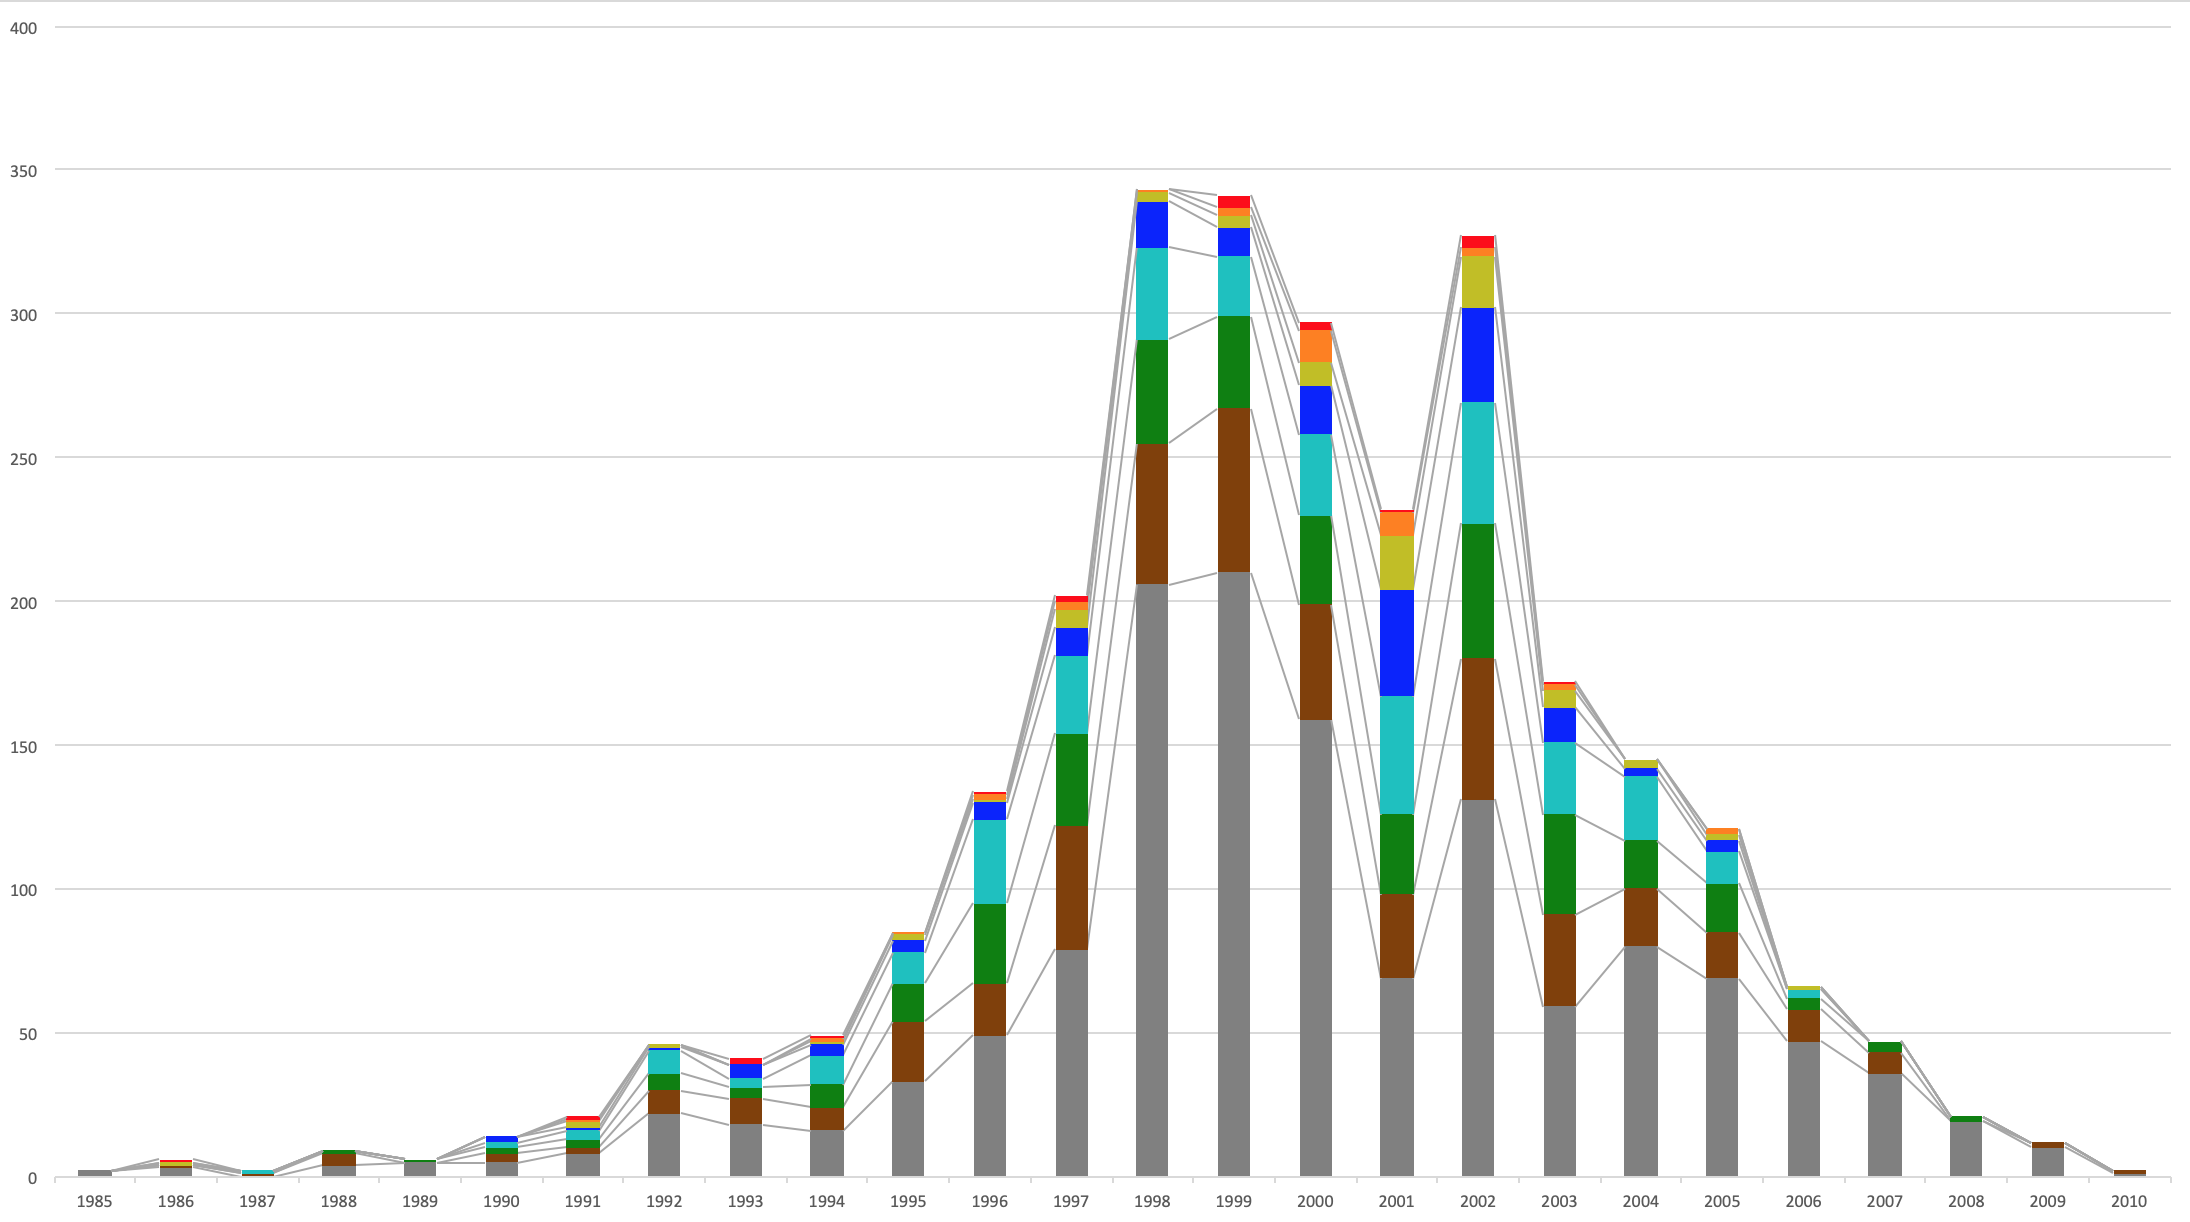
若い層が多いですね。
ロシア
1980年〜2005年生まれです。
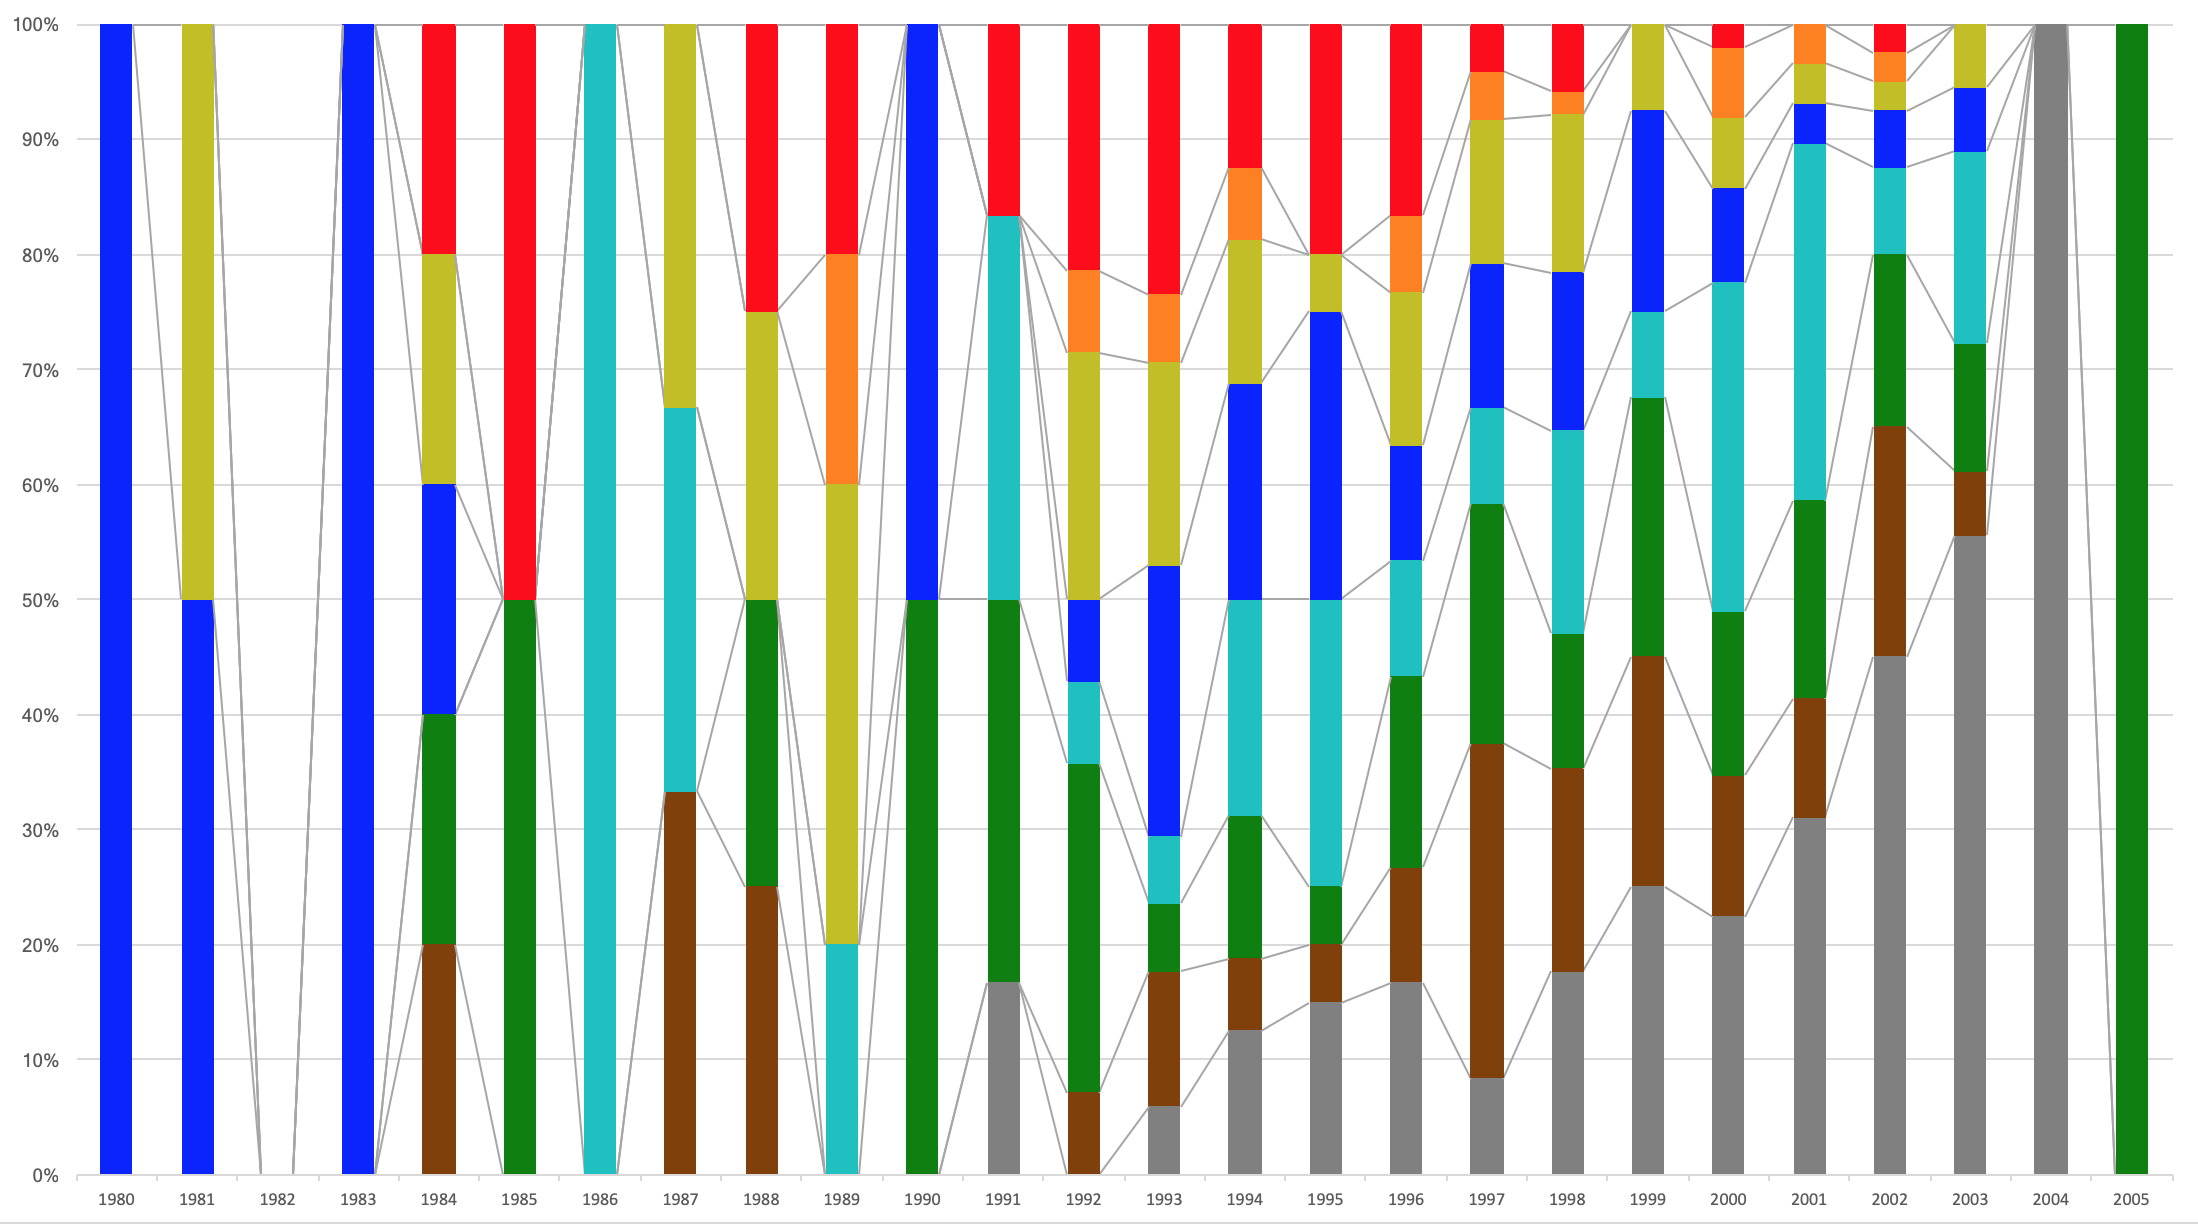
おそロシア……