はじめに
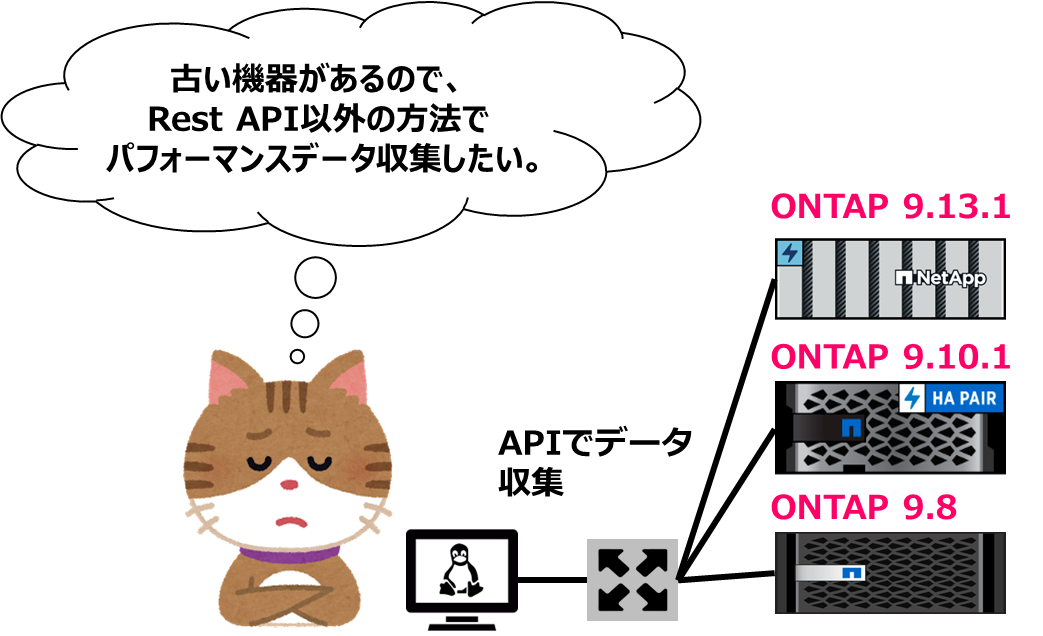
本記事では、NetApp社の提供するStorageであるONTAPに関する統計情報をAPIで取得する方法について記載します。
ONTAPI API(ZAPI)は、データストレージの管理・運用タスクの自動化をサポートするために、NetApp ONTAPソフトウェアに含まれている独自のコールセットですが、ONTAP9.11からは設定項目だけでなく、Performance用のREST APIも用意されていますので、将来のバージョンでは基本的にREST APIを利用頂く事になります。
と言うものの、ONTAP9.10以下ではONTAPIを使用している場合は、ZAPIを利用する必要がある為、本記事ではZAPIを使った統計情報の取得について中心の内容になります。
何をしたい?できる?
- CLIとAPI(ZAPI)のMappingについてを調べる
- APIで使うパフォーマンス用のカウンターを調べる
- NetApp Manageability SDKを使ってAPI(ZAPI)を利用したデータ取得を行う
- Powershell Toolkitを利用してデータ取得を行う
- Ansible moduleでZAPIを利用してデータ取得を行う
ONTAPI API(ZAPI)はいつまで利用可能?
NetAppのSupport Site(アカウントが必要)を確認すると、以下の内容(予定)が確認できます。
- ONTAP9.14.1~は、必要に応じてONTAPIアクセスを再有効化可能
- ONTAP9.14.1や9.15.1で、アップグレード時にONTAPI使用が検出された場合、有効のまま
- ONTAPIの使用が検出されない場合、無効(CLIを使用して再度有効化は可能)
- 以前案内のあった9.18.1以降は無効といった内容はしばらく延長に更新(2024/6)
# ONTAPIを有効化するには以下CLIを実行
> system services web ontapi modify -suspended false
1. コマンドとAPIの紐付けの確認方法について
基本的にはマニュアルからAPIの利用方法を確認します。

とはいえ、マニュアル探すのも大変だしCLI操作は分かるけども、どのAPIを利用するか困るといったことがあるかと思います。その際には、コマンドからAPIを調べる場合は、security login role show-ontapi -commandを使用し、APIから対応するコマンド調べる場合は、security login role show-ontapi -ontapiを使用します。
# CIFS設定に対応するZAPIの確認
::> security login role show-ontapi -command "vserver cifs create"
ONTAPI                      Command
--------------------------- ---------------------------------------------------
cifs-server-create          vserver cifs create


# Performance取得に対応するZAPIの確認
> set advanced
Warning: These advanced commands are potentially dangerous; use them only when directed to do so by NetApp personnel.
Do you want to continue? {y|n}: y

*> security login role show-ontapi -command "statistics show"
ONTAPI                      Command
--------------------------- ---------------------------------------------------
perf-object-get-instances   statistics show


# DNS設定のZAPIに対応するコマンドの確認
::> security login role show-ontapi -ontapi net-dns-create

ONTAPI Name: net-dns-create
CLI Command: vserver services name-service dns create
SVM向けのAPIか、Cluster全体で利用するAPIかの判断について
上記のようにコマンドラインからAPIを確認できるので、Cluster管理からSVMにログインして使えるコマンドを確認する事でSVMに対して利用可能なZAPIを知る事ができます。
# Clusterの全体管理へsshログイン後、ps_vm_hypervというSVMにログイン
> hostname
ps-8300-cl01

> vserver context ps_vm_hyperv
Info: Use 'exit' command to return.

# SVMログイン後、?を実行で使えるコマンド一覧の表示
> ?
  exit                        Quit the CLI session
  history                     Show the history of commands for this CLI session
  job>                        Manage jobs and job schedules
  lun>                        Manage LUNs
  man                         Display the on-line manual pages
  network>                    Manage physical and virtual network connections
(中略)

# コマンドは階層構造なので、指定後さらに?を実行すると利用可能な操作の表示
> volume ?
  analytics>                  The analytics directory
  autosize                    Set/Display the autosize settings of the flexible volume.
  clone>                      Manage FlexClones
  create                      Create a new volume
  delete                      Delete an existing volume
(中略)
2. APIで使うパフォーマンス用のカウンターを調べる
latencyやCPUの値をAPIを用いて取得する際に、どのようなパラメータを指定して取得するか分かり難いのではないかと思いますが、事前にCLIのadvancedモードで利用できるstatistics show-periodicコマンドで値の表示をさせる事で理解が進むのではないかと思います。
オブジェクトやカウンターはZAPIに限らず、REST APIでも同じように使用します。
# PS-A220-01というコントローラ名のCPU busy値を秒単位で出力
> set advanced
Warning: These advanced commands are potentially dangerous; use them only when directed to do so by NetApp personnel.
Do you want to continue? {y|n}: y

*> statistics show-periodic -interval 1 -object system:node -instance PS-A220-01 -counter cpu_busy

PS-A220: system:node.PS-A220-01: 12/15/2023 18:35:50
  cpu
 busy
 ----
   6%
   4%
  17%

#  hyperv_ds01というVolume名の平均Latency値を秒単位で出力
*> statistics show-periodic -interval 1 -object volume -instance hyperv_ds01 -counter avg_latency
ps-8300-cl01: volume.hyperv_ds01: 12/15/2023 18:40:53
      avg
  latency
 --------
     41us
     13us
     39us
objectやinstance、counterの後にtabキー実行することで、選択可能な一覧を表示させることができます。
*> statistics show-periodic -interval 1 -object   #-objectの後にスペースがある形でtabキーの実行

    adaptive_policy_group             adaptive_policy_group:constituent
    ads                               aggr_efficiency
    aggregate                         audit_ng
    audit_ng:vserver                  cdp
    cg_table                          cgstat
    cifs                              cifs:node
    cifs:vserver                      cifs_ctx
    cifs_ctx:node                     client
<中略>
また、カウンター自体の説明を確認したい場合は、 statistics catalog counterコマンドで確認することができます。
カウンターに格納できるデータサイズ(32bitや64bit)を確認したい場合は、Diagモードに変更してから確認する必要があります。なお、8と表示された際は、いわゆる8 byteなので64bit分のデータが格納可能という事になります。
#  NICについて情報が必要なので、nic_commonというObjectで指定できるカウンターrx_errorsについて調べる
*> statistics catalog counter show -object nic_common -counter rx_errors

Object: nic_common
    Counter                     Description
    --------------------------- ----------------------------------------------
    rx_errors                   Error received


#  Diagモードでnic_commonというObjectで指定できるカウンターrx_errorsのサイズについて調べる
> set diag

Warning: These diagnostic commands are for use by NetApp personnel only.
Do you want to continue? {y|n}: y

*> statistics catalog counter show -object nic_common -counter rx_errors -fields size
object     counter   size
---------- --------- ----
nic_common rx_errors 8
3. NetApp Manageability SDKを使ってAPI(ZAPI)を利用したデータ取得を行う
NetApp Manageability SDKとは
ONTAPをプログラムで制御するためのツールセットで、NetAppのデータ管理API(Application Programming Interface)を使用して、ストレージと通信するためのライブラリやサンプルコードが含まれています。
SDKでは多くのプログラミング言語(Java、Perl、Python、C#、C++など)で利用でき、開発者は自分が最も得意とする言語でNetAppのストレージシステムを制御することができます。
本記事ではPythonを使ってコード実行する例について記載します。
3-1. サポートサイトからDownload
SDKを使ってAPI操作する為に、サポートサイトからSDKをダウンロードします。

3-2. コードを実行するサーバ上で解凍
本記事ではLinuxサーバ上で解凍しています。
> unzip netapp-manageability-sdk-9.8P7-linux.zip

Archive:  netapp-manageability-sdk-9.8P7-linux.zip
   creating: netapp-manageability-sdk-9.8P7/
   creating: netapp-manageability-sdk-9.8P7/bin/
   creating: netapp-manageability-sdk-9.8P7/bin/nt/
  inflating: netapp-manageability-sdk-9.8P7/bin/nt/libeay32.dll
(中略)
解凍後に、各言語毎に必要なライブラリが確認できます。
主に利用するライブラリは以下の2つです。
| ライブラリ | 説明 |
|---|---|
| NaServer | APIサーバに接続し、整形されたAPIリクエストを呼び出し(接続やAPI実行) |
| NaElement | 入力/出力要素の作成と管理や応答とステータスの確認 |
>  ls netapp-manageability-sdk-9.8P7/lib/
DotNet  java  linux-64  nt  perl  ppc64-redhat-linux  python  ruby

>  ls netapp-manageability-sdk-9.8P7/lib/python/NetApp/
DfmErrno.py  NaElement.py  NaErrno.py  NaServer.py
3-3. コードを記載
コードは以下のような形で記載します。

以下の例は各コントローラにあるNICのPort e0Mの転送量をAPIで取得するコードとなります。
ライブラリのパス、ONTAPのIPやアカウントを環境に合わせて修正するとそのまま利用できるかと思います。
利用したいパフォーマンスカウンターが別にあるのであれば、上記の2. APIで使うパフォーマンス用のカウンターを調べるに記載されている方法で、指定すべきオブジェクトやカウンターを調査して使う事になります。
>  cat test.py
import sys
sys.path.append("/work/netapp-manageability-sdk-9.8P7/lib/python/NetApp")
from NaServer import *


hostname = "192.168.123.45";
username = "admin";
password = "Ntappass0101";
port = 80;
serverType = "FILER"
transportType = "HTTP"

server = NaServer(hostname, 1 , 180)
server.set_server_type(serverType)
server.set_transport_type(transportType)
server.set_port(port)
server.set_style("LOGIN")
server.set_admin_user(username, password)


api = NaElement("perf-object-get-instances")
api.child_add_string("objectname", "nic_common")
api.child_add_string("privilege-level", "diag")

instancesElement = NaElement("instances")
api.child_add(instancesElement)
instancesElement.child_add_string("instance", "e0M")

countersElement = NaElement("counters")
api.child_add(countersElement)
countersElement.child_add_string("counter", "total_bytes")

output = server.invoke_elem(api)
if (output.results_status() == "failed") :
    print ("Error:\n")
    print (output.sprintf())
    sys.exit (1)
print ("Received:\n")
print (output.sprintf())
実行すると以下のような形でデータを取得します。
>  python test.py
Received:

<results status="passed">
        <instances>
                <instance-data>
                        <counters>
                                <counter-data>
                                        <name>total_bytes</name>
                                        <value>821701224453</value>
                                </counter-data>
                        </counters>
                        <name>e0M</name>
                        <sort-id>0</sort-id>
                        <uuid>ps-8300-cl-01:kernel:e0M</uuid>
                </instance-data>
                <instance-data>
                        <counters>
                                <counter-data>
                                        <name>total_bytes</name>
                                        <value>17130128431</value>
                                </counter-data>
                        </counters>
                        <name>e0M</name>
                        <sort-id>0</sort-id>
                        <uuid>ps-8300-cl-02:kernel:e0M</uuid>
                </instance-data>
        </instances>
        <timestamp>1702884761</timestamp>
</results>
4. Powershell Toolkitを利用してデータ取得を行う
NetApp PowerShell Toolkitは、NetAppストレージシステムを管理するためのPowerShellツールキットで、 PowerShellのコマンドラインを使って、ONTAPの管理を実施できます。
Windowsに限らず、Ubuntu、RedHat Enterprise Linux(RHEL)、macOSのクロスプラットフォームにも対応しています。
上記のSDKで.Netを使って各APIを実行する為のコードを書いて、Powershellのコマンドとして使えるようにしたものがPowershell Toolkitと理解すると分かりやすいかと思います。
(かなり端的な説明ですが)
4-1. サポートサイトからDownload
PowerShell Toolkitを使ってAPI操作する為に、サポートサイトからNetApp.ONTAP PowerShell Toolkitをダウンロードします。

4-2. PowerShell ToolkitのInstall
Downloadした圧縮ファイルを解凍してInstallを実行します。
(古いPowerShell Toolkitの入った環境へ上書きInstallしています)
PS C:\temp10\NetApp.ONTAP\NetApp.ONTAP> dir

Directory: C:\temp10\NetApp.ONTAP\NetApp.ONTAP
Mode                 LastWriteTime         Length Name
----                 -------------         ------ ----
-a---          2023/06/16    22:25          11483 Install.ps1
-a---          2023/06/16    22:25       17283395 netapp_ontap.zip
-a---          2023/06/23    14:35            823 README.txt
-a---          2023/06/16    22:25           9134 Uninstall.ps1


C:\temp10\NetApp.ONTAP\NetApp.ONTAP> .\Install.ps1

Choose an installation destination:

  1: C:\Users\Administrator\Documents\PowerShell\Modules
  2: C:\Program Files\PowerShell\Modules
  3: c:\program files\powershell\7\Modules
  4: C:\Program Files (x86)\WindowsPowerShell\Modules
  5: C:\Windows\system32\WindowsPowerShell\v1.0\Modules
  6: C:\Program Files (x86)\NetApp\NetApp PowerShell Toolkit\Modules (installed: 9.8.0.0)

Install to directory: [6]: 6

DataONTAP already exists in destination; delete first? (y/abort) [y]: y

Installed successfully; run "Import-Module NetApp.ONTAP" to make the cmdlets available.
4-3. コマンドレットの実行
Performanceデータは、Get-NcPerfDataを実行することで取得できます。
# ModuleのImport
PS C:\> Import-Module dataontap
PS C:\> Get-Module

ModuleType Version    Name                                ExportedCommands
---------- -------    ----                                ----------------
Manifest   9.13.1.... dataontap                           {Add-NaAggr, Add-NaCifsShare, Add-NaCredential, Add-NaFpol...
Manifest   3.1.0.0    Microsoft.PowerShell.Utility        {Add-Member, Add-Type, Clear-Variable, Compare-Object...}
Script     2.0.0      PSReadline                          {Get-PSReadLineKeyHandler, Get-PSReadLineOption, Remove-PS...


# 管理するONTAPクラスタへ接続
PS C:\> Connect-NcController -Name 192.168.123.45 -HTTPS

Name                 Address           Vserver              Version
----                 -------           -------              -------
192.168.123.45       192.168.123.45                         NetApp Release 9.8P19: Thu May 11 17:26:53 UTC 2023


# 取得する対象の確認(並びや対象等)
PS C:\> Get-NcPerfData -Name nic_common -Instance e0M -Counter total_bytes

Name                   Uuid                                     Counters
----                   ----                                     --------
e0M                    ps-8300-cl-01:kernel:e0M                 {total_bytes}
e0M                    ps-8300-cl-02:kernel:e0M                 {total_bytes}

# 実際に取得したデータの確認
PS C:\> (Get-NcPerfData -Name nic_common -Instance e0M -Counter total_bytes).counters | Select-Object Name,Value

Name        Value
----        -----
total_bytes 822006461865
total_bytes 17135454700
5. Ansible moduleでZAPIを利用してデータ取得を行う
本記事では、既にAnsibleを使ってONTAPが管理できる状態からの記載となります。
Ansibleを使ってONTAPを管理するために必要な設定は、以下の記事を参照ください。
Ansibleを使ってStorage(ONTAP)を管理する1【Rocky LinuxへAnsible Install編】
5-1. Playbookの記載
AnsibleでZAPIを利用するには、netapp.ontap.na_ontap_zapitモジュールを利用します。
以下の例では、e0Mの転送量の取得についての記載例で、taskの部分にZAPIのAPIの指定や対象オブジェクトやカウンターの記載を実施します。
(perf-object-get-instancesがZAPIにおけるAPI)
>  cat playbook_perf_get.yml
---
- name: ONTAP Zapi
  hosts: localhost
  connection: local
  gather_facts: false

  vars:
    login: &login
      hostname: 192.168.123.45
      username: admin
      password: clusterpass1010
      https: true
      validate_certs: false

  tasks:
    - name: run ontap ZAPI command as Perf Get
      netapp.ontap.na_ontap_zapit:
        <<: *login
        zapi:
          perf-object-get-instances:

            objectname: nic_common
            instances:
              instance: e0M
            counters:
              counter: total_bytes

      register: output
    - debug: var=output
5-2. Playbookの実行
>  ansible-playbook -i inventory.yml -u user01 playbook_perf_get.yml --ask-pass
SSH password:

PLAY [ONTAP Zapi] *****************************************************************************************************

TASK [run ontap ZAPI command as Perf Get] *****************************************************************************
[WARNING]: With version 22.0.0 ONTAPI (ZAPI) has been deprecated. The final ONTAP version to support ZAPI is ONTAP
9.13.1.  ZAPI calls in these modules will continue to work for ONTAP versions that supports ZAPI.  You can update your
playbook to use REST by adding use_rest: always to your playbook.  More information can be found at:
https://github.com/ansible-collections/netapp.ontap
changed: [localhost]

TASK [debug] **********************************************************************************************************
ok: [localhost] => {
    "output": {
        "changed": true,
        "failed": false,
        "response": {
            "instances": {
                "instance-data": [
                    {
                        "counters": {
                            "counter-data": {
                                "name": "total_bytes",
                                "value": "822458494222"
                            }
                        },
                        "name": "e0M",
                        "sort-id": "0",
                        "uuid": "ps-8300-cl-01:kernel:e0M"
                    },
                    {
                        "counters": {
                            "counter-data": {
                                "name": "total_bytes",
                                "value": "17143925449"
                            }
                        },
                        "name": "e0M",
                        "sort-id": "0",
                        "uuid": "ps-8300-cl-02:kernel:e0M"
                    }
                ]
            },
            "timestamp": "1702894657"
        },
        "warnings": [
            "With version 22.0.0 ONTAPI (ZAPI) has been deprecated. The final ONTAP version to support ZAPI is ONTAP 9.13.1.  ZAPI calls in these modules will continue to work for ONTAP versions that supports ZAPI.  You can update your playbook to use REST by adding use_rest: always to your playbook.  More information can be found at: https://github.com/ansible-collections/netapp.ontap"
        ]
    }
}

PLAY RECAP ************************************************************************************************************
localhost                  : ok=2    changed=1    unreachable=0    failed=0    skipped=0    rescued=0    ignored=0
参考及びリンク
Performance counters with ONTAP REST APIs 9.11.1
Reference Manual for ONTAP 9.14.1 APIs
NetApp PowerShell Toolkit 9.13.1.2306 Installation Guide
netapp.ontap.na_ontap_zapit module – NetApp ONTAP Run any ZAPI on ONTAP
FAQs on ZAPI to ONTAP REST API transformation for CPC (Customer Product Communiques) notification