matplotlibで積み上げ棒グラフを描いてみる
モチベーション
積み上げ棒グラフをPythonで描く際に、エクセルみたいにデータラベルを表示できたらいいなぁと思い、いざ調べてみるとデータラベルを表示できるような記事が無く、コピペできるコードもありませんでした。そこで、積み上げ棒グラフにデータラベルをつけようと思った時にコピペできるコードを書いてみました。
ちなみに、積み上げ棒グラフだけ描ければいいのであれば、このページの一番最後にある簡単に積み上げ棒グラフを描くを参考にしてください。
インポート
以下のライブラリーをインポートします。
import pandas as pd
import numpy as np
import matplotlib.pyplot as plt
import seaborn as sns

sns.set(font='IPAexGothic')

%matplotlib inline
ダミーデータの作成
ダミーデータはA,B,C支店の月別の売り上げデータを作成しました。
dataset = pd.DataFrame([[100, 200, 50], [300, 400, 600], [50, 300, 60]],
                       columns=['A支店', 'B支店', 'C支店'],
                       index=['4月', '5月', '6月'])
| A支店 | B支店 | C支店 | |
|---|---|---|---|
| 4月 | 100 | 200 | 50 |
| 5月 | 300 | 400 | 600 |
| 6月 | 50 | 300 | 60 |
棒グラフを描く
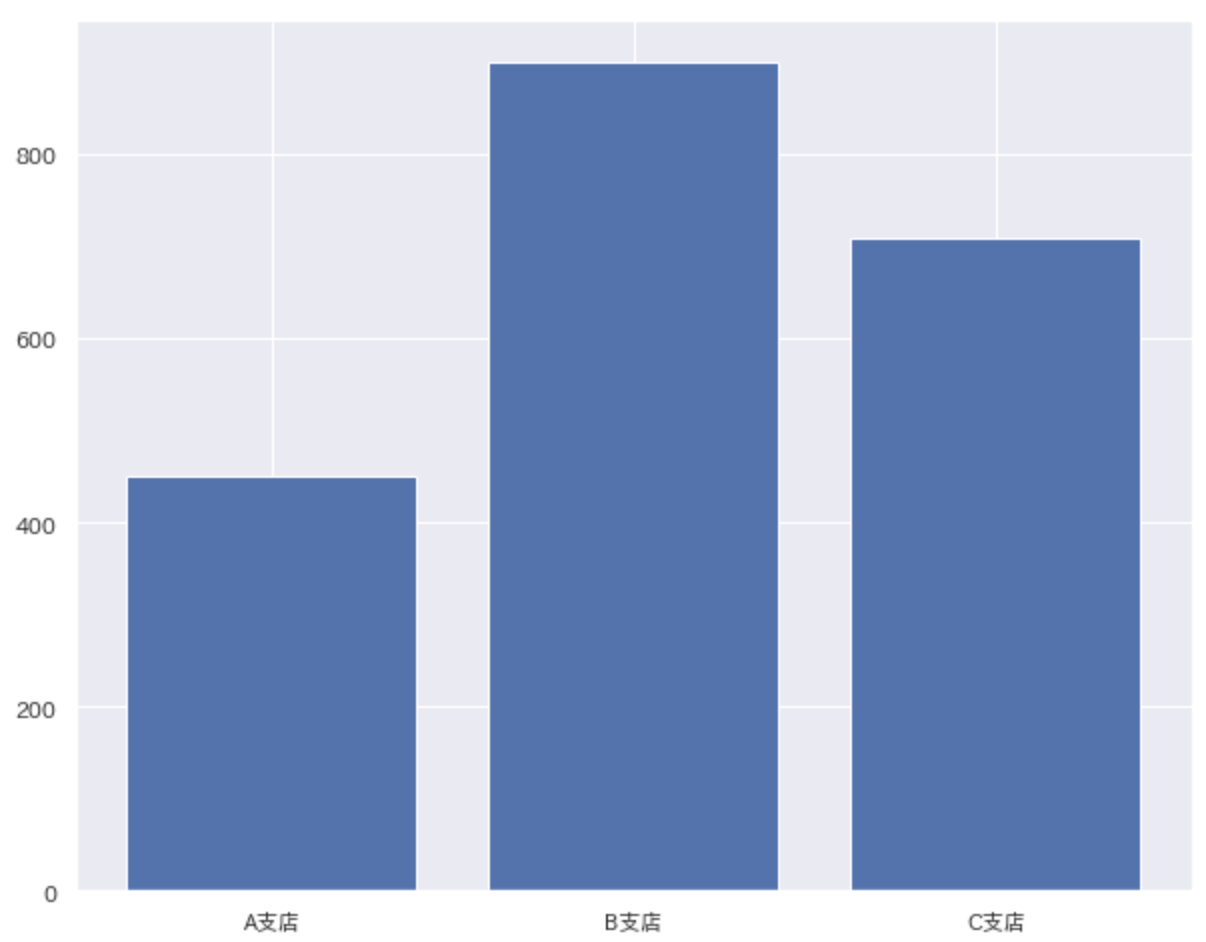
まずは簡単な棒グラフを描いてみます。
各支店の月の売り上げを合計した棒グラフを描いてみましょう。
描いてみたは良いもののこれだけだと、各月にどれくらい売り上げがあるのかわかりません。。。
そんな時は、積み上げ棒グラフを使いましょう!
fig, ax = plt.subplots(figsize=(10, 8))
ax.bar(dataset.columns, dataset.sum())
plt.show()
積み上げ棒グラフを描く
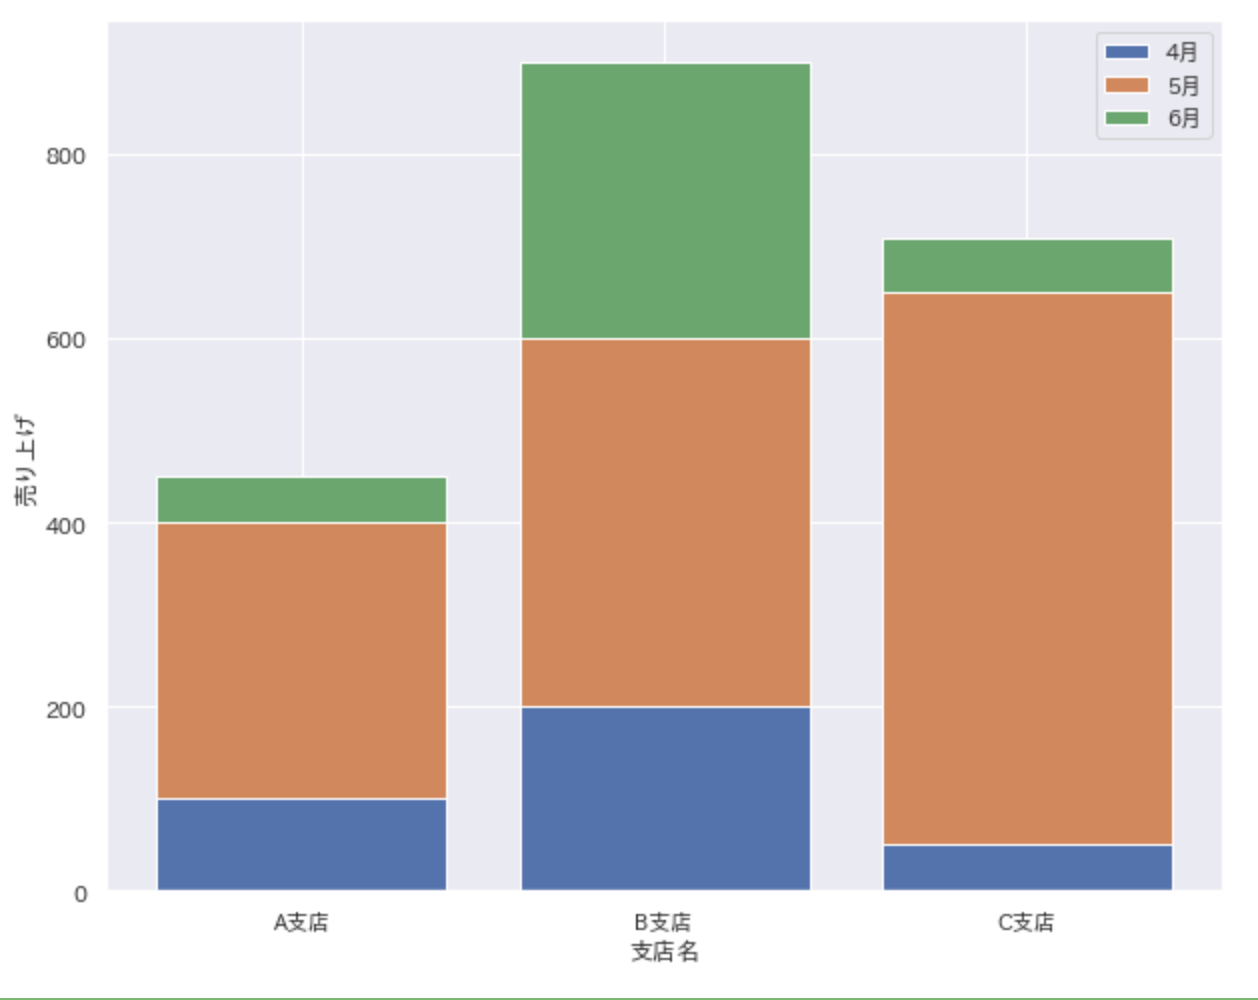
積み上げ棒グラフは棒グラフを描く時と同様にax.bar()を使います。
この時の引数bottomにバーのベースとなるy座標を指定します。
積み上げ棒グラフができました!!!やはり、データラベルが欲しいですね。
参考サイト:https://matplotlib.org/3.1.1/api/_as_gen/matplotlib.axes.Axes.bar.html
fig, ax = plt.subplots(figsize=(10, 8))
for i in range(len(dataset)):
    ax.bar(dataset.columns, dataset.iloc[i], bottom=dataset.iloc[:i].sum())
ax.set(xlabel='支店名', ylabel='売り上げ')
ax.legend(dataset.index)
plt.show()
積み上げ棒グラフ内にデータラベルを表示する
いよいよここからが本題です。
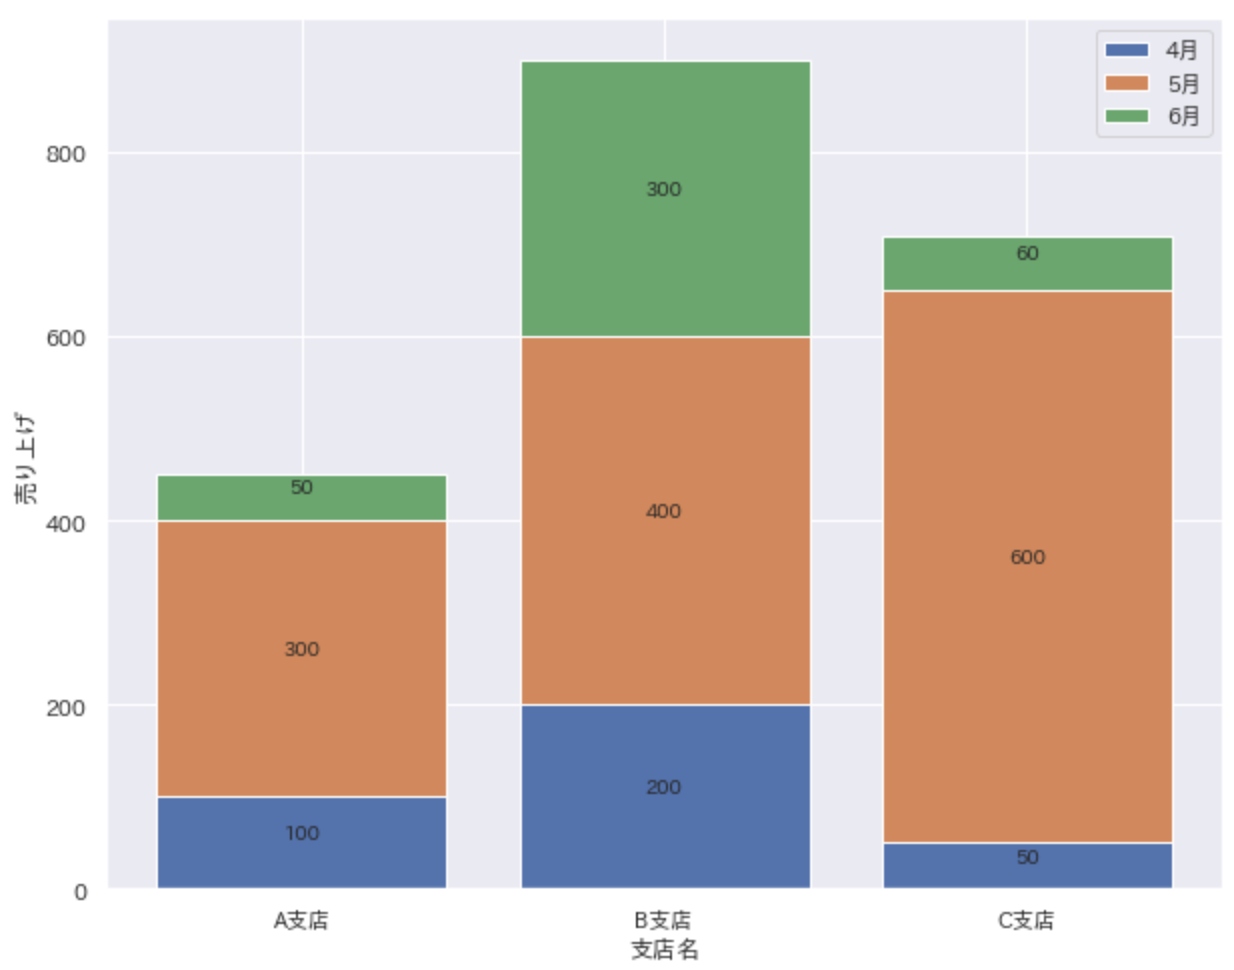
データラベルは、plt.text()でx座標とy座標を指定して挿入します。
そうすると、いい感じにできました!
fig, ax = plt.subplots(figsize=(10, 8))
for i in range(len(dataset)):
    ax.bar(dataset.columns, dataset.iloc[i], bottom=dataset.iloc[:i].sum())
    for j in range(len(dataset.columns)):
        plt.text(x=j,
                 y=dataset.iloc[:i, j].sum() + (dataset.iloc[i, j] / 2),
                 s=dataset.iloc[i, j],
                 ha='center',
                 va='bottom'
                )
ax.set(xlabel='支店名', ylabel='売り上げ')
ax.legend(dataset.index)
plt.show()
100%積み上げ棒グラフを描く
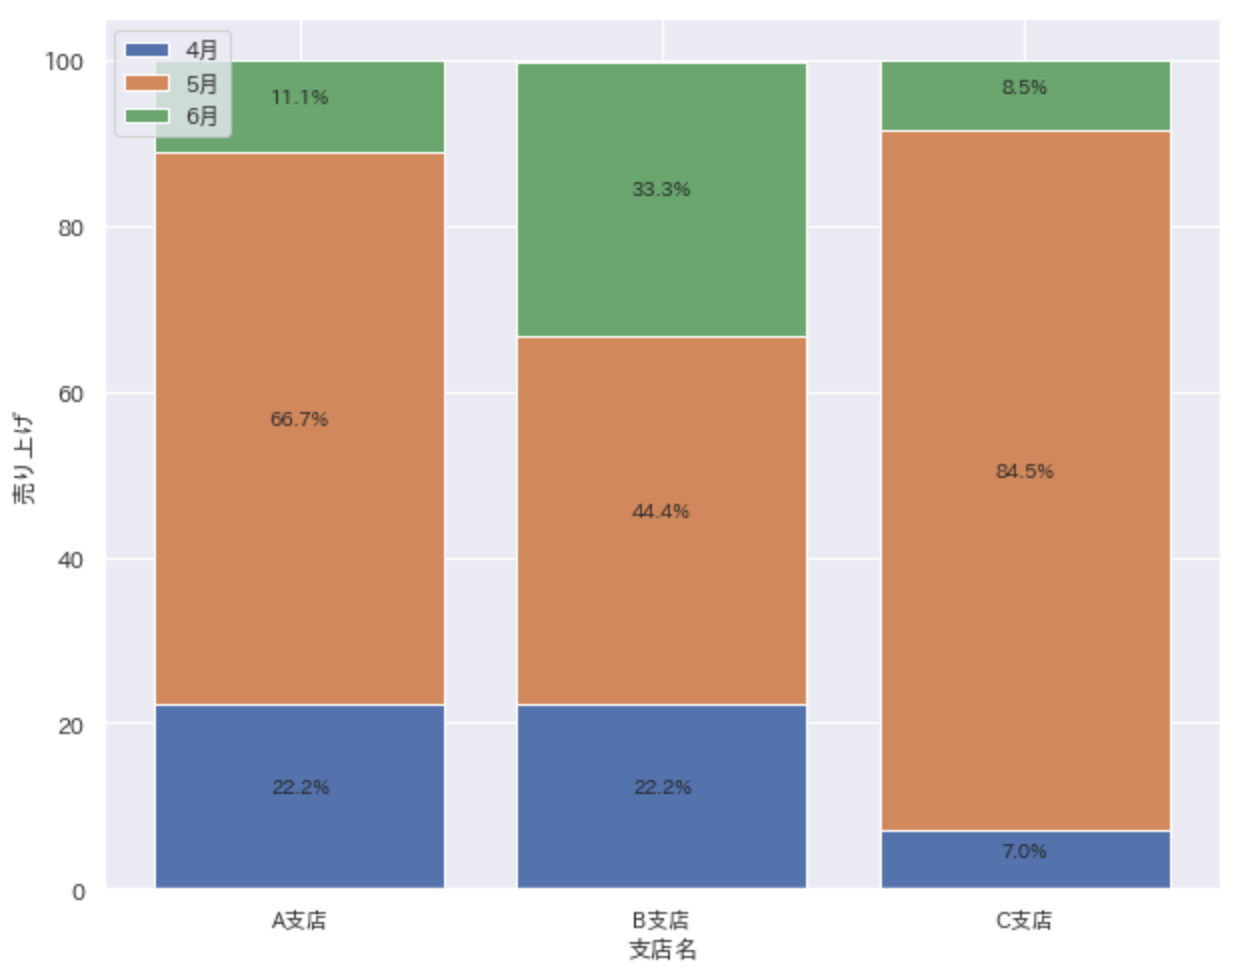
積み上げ棒グラフを使う時には100%積み上げ棒グラフも使用したくなりますよね。
まずはデータを加工します。
以下のコードで支店別の売り上げを割合に変換します。
plot_dataset = pd.DataFrame(index = dataset.index)
for col in dataset.columns:
    plot_dataset[col] = round(100 * dataset[col] / dataset[col].sum(), 1)
| A支店 | B支店 | C支店 | |
|---|---|---|---|
| 4月 | 22.2 | 22.2 | 7.0 |
| 5月 | 66.7 | 444. | 84.5 |
| 6月 | 11.1 | 33.3 | 8.5 |
変換したデータを使って100%積み上げ棒グラフを描きましょう。
コードは先ほどのコードを同じです。(変数だけ変更しています。)
fig, ax = plt.subplots(figsize=(10, 8))
for i in range(len(plot_dataset)):
    ax.bar(plot_dataset.columns,
           plot_dataset.iloc[i],
           bottom=plot_dataset.iloc[:i].sum()
          )
    for j in range(len(plot_dataset.columns)):
        plt.text(x=j,
                 y=plot_dataset.iloc[:i, j].sum()+(plot_dataset.iloc[i, j]/2),
                 s=f'{plot_dataset.iloc[i, j]}%',
                 ha='center',
                 va='bottom'
                )
ax.set(xlabel='支店名', ylabel='売り上げ')
ax.legend(plot_dataset.index)
plt.show()
簡単に積み上げ棒グラフを描く
積み上げ棒グラフを描くだけなら以下のコードで簡単に描けます。
fig, ax = plt.subplots(figsize=(10, 8))
dataset.T.plot(kind='bar', stacked=True, ax=ax)
plt.show()


