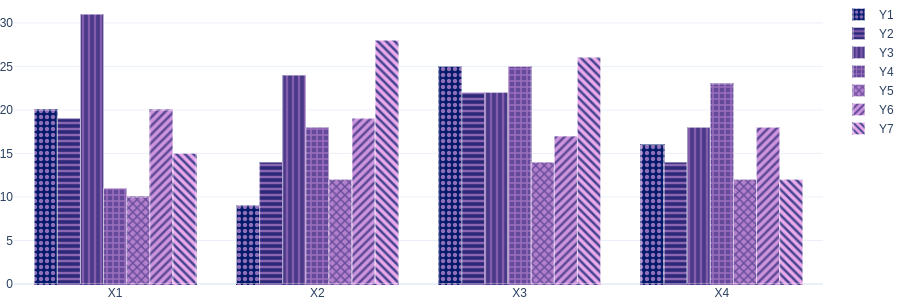
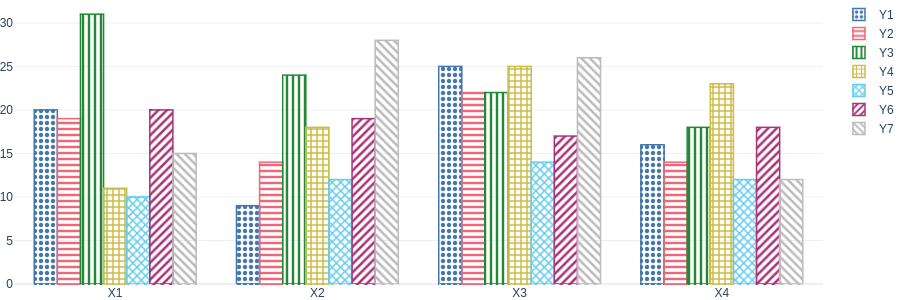
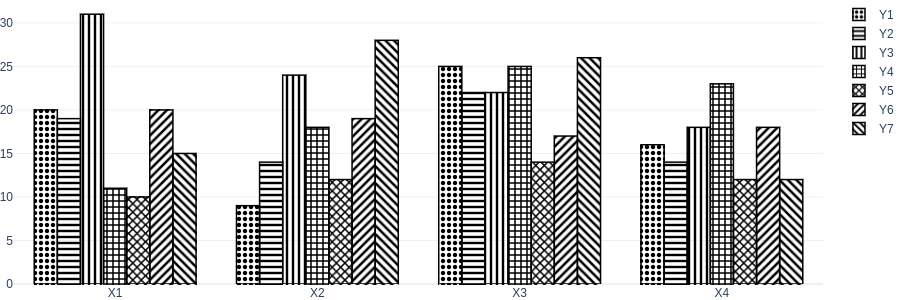
2021/6/22、Plotly.pyの新バージョン5.0.0がリリースされ、新しくpattern fill (a.k.a. hatch, texture)が使えるようになっています。
pattern fillの基本的な機能は私が実装してPRを投げたのですが1、その後より使いやすい機能拡張が施されて正式にライブラリの一部としてリリースされました。
Plotly、とても良いんですよ。例えば、
- ブラウザ上でインタラクティブにぐりぐり動かせる
- jsonをjsライブラリ(plotly.js)に投げるだけ、という設計なので言語非依存(本記事ではpythonを使いますが)
- グラフを他人と共有するとき、1つのHTMLファイルにまとめて共有できる(画像だけでなくデータも含めたjsonごと共有できる)
- レイアウト、見た目を結構細かく調整できる
などなど色々メリットがあり最近使っていたのですが、個人的にはpattern fillがないことがデメリットに感じていました(特に論文に使うような棒グラフを作りたい場合)。
しかし最新のバージョンでは、少しいじるとこんな感じの棒グラフを作れたりします:
本記事では論文やレポートにも気兼ねなく使える視認性の良いグラフをplotlyで作図することを目的とし、pattern fillの基本的な使い方から少し細かいパラメタの設定方法まで説明します。
本記事で用いているのはPlotly.py v5.0.0です。
基本の使い方
今回はplotlyのgraph_objectsを用いて棒グラフを描きます。
Plotly expressを使ってグラフを描きたい!って方は公式のデモを参照してください。
公式HPのデモ: Patterns, Hatching, Texture in Python
本記事ではコード例をサンプルとして貼り付けていくのが主なので、ちゃんとしたオプションの説明は公式referenceを参照したほうが良いです。
各オプションの詳しい説明は以下にあります。
詳細なreference: https://plotly.com/python/reference/bar/#bar-marker-pattern
では早速pattern fillを有効にして棒グラフを描いてみます。
基本の棒グラフ:
import plotly.graph_objects as go
import plotly.io as pio

pio.templates.default = 'plotly_white'

x = ['X1', 'X2', 'X3', 'X4']

fig = go.Figure()
fig.add_trace(go.Bar(
    x=x,
    y=[20, 9, 25, 16],
    name='Y1',
    marker_pattern_shape='.',
))
fig.add_trace(go.Bar(
    x=x,
    y=[19, 14, 22, 14],
    name='Y2',
    marker_pattern_shape='-',
))
fig.add_trace(go.Bar(
    x=x,
    y=[31, 24, 22, 18],
    name='Y3',
    marker_pattern_shape='|',
))
fig.add_trace(go.Bar(
    x=x,
    y=[11, 18, 25, 23],
    name='Y4',
    marker_pattern_shape='+',
))
fig.add_trace(go.Bar(
    x=x,
    y=[10, 12, 14, 12],
    name='Y5',
    marker_pattern_shape='x',
))
fig.add_trace(go.Bar(
    x=x,
    y=[20, 19, 17, 18],
    name='Y6',
    marker_pattern_shape='/',
))
fig.add_trace(go.Bar(
    x=x,
    y=[15, 28, 26, 12],
    name='Y7',
    marker_pattern_shape='\\',
))

fig.update_layout(
    width=900,
    height=300,
    margin=dict(l=0, r=0, b=0, t=0),
    barmode='group',
)
fig.show()
各グラフオブジェクトに対し、marker_pattern_shapeを設定します。
値は.(水玉), -(横線), |(縦線), +(横と縦), x(クロス), /(斜め), \(斜め逆)のいずれかです。
将来的にパターンは増えているかもしれません。
余談ですが論文とかに使う図を作るときにはlayoutにmargin=dict(l=0, r=0, b=0, t=0)を指定してマージンを0にしておくと良いです。
パターンの大きさを調整する
デフォルトのパターンでも十分かもしれませんが、ここではもう少しパターンを小さくして、よりパターンを目立たせてみましょう。
ついでに色も変えてみます。色盲の方でも見やすいカラーパレットがあるのでそれを使います:
https://personal.sron.nl/~pault/#sec:qualitative
import plotly.graph_objects as go
import plotly.io as pio

pio.templates.default = 'plotly_white'

colors = ['#4477AA', '#EE6677', '#228833', '#CCBB44', '#66CCEE', '#AA3377', '#BBBBBB']

x = ['X1', 'X2', 'X3', 'X4']

fig = go.Figure()
fig.add_trace(go.Bar(
    x=x,
    y=[20, 9, 25, 16],
    name='Y1',
    marker_color=colors[0],
    marker_pattern_shape='.',
))
fig.add_trace(go.Bar(
    x=x,
    y=[19, 14, 22, 14],
    name='Y2',
    marker_color=colors[1],
    marker_pattern_shape='-',
))
fig.add_trace(go.Bar(
    x=x,
    y=[31, 24, 22, 18],
    name='Y3',
    marker_color=colors[2],
    marker_pattern_shape='|',
))
fig.add_trace(go.Bar(
    x=x,
    y=[11, 18, 25, 23],
    name='Y4',
    marker_color=colors[3],
    marker_pattern_shape='+',
))
fig.add_trace(go.Bar(
    x=x,
    y=[10, 12, 14, 12],
    name='Y5',
    marker_color=colors[4],
    marker_pattern_shape='x',
))
fig.add_trace(go.Bar(
    x=x,
    y=[20, 19, 17, 18],
    name='Y6',
    marker_color=colors[5],
    marker_pattern_shape='/',
))
fig.add_trace(go.Bar(
    x=x,
    y=[15, 28, 26, 12],
    name='Y7',
    marker_color=colors[6],
    marker_pattern_shape='\\',
))

fig.update_traces(
    marker_pattern_size=6,
    marker_pattern_solidity=0.4,
)

fig.update_layout(
    width=900,
    height=300,
    margin=dict(l=0, r=0, b=0, t=0),
    barmode='group',
)
fig.show()
fig.update_tracesで各グラフオブジェクトに同じ設定を適用しています。
marker_pattern_sizeでパターンの繰り返し単位の大きさ(px)を少し小さめの値(6 px)に指定しています。
また、marker_pattern_solidityはおおまかに言うとパターンの太さで、パターンが全体の面積のどれくらいの割合を占めるかを(ざっくりと)表しており、1なら全部塗りつぶされます。0ならパターンなしです。
グラフの全体の大きさに応じてこの辺をいじると良いです。
replaceモードを使う
ここまで、パターンはマーカーのデフォルトの色(marker_color)に応じてコントラストが大きくなるように白っぽい色か黒っぽい色のいずれかがパターンとして重ねがけされていました。
これはoverlayモードと呼ばれ、pattern fillのモード(marker_pattern_fillmode)のデフォルトの挙動です。
もう一つのモードはreplaceモードで、これを使うとパターンの方にマーカーのデフォルトの色(marker_color)が適用されます。
import plotly.graph_objects as go
import plotly.io as pio

pio.templates.default = 'plotly_white'

colors = ['#4477AA', '#EE6677', '#228833', '#CCBB44', '#66CCEE', '#AA3377', '#BBBBBB']

x = ['X1', 'X2', 'X3', 'X4']

fig = go.Figure()
fig.add_trace(go.Bar(
    x=x,
    y=[20, 9, 25, 16],
    name='Y1',
    marker_color=colors[0],
    marker_line_color=colors[0],
    marker_pattern_shape='.',
))
fig.add_trace(go.Bar(
    x=x,
    y=[19, 14, 22, 14],
    name='Y2',
    marker_color=colors[1],
    marker_line_color=colors[1],
    marker_pattern_shape='-',
))
fig.add_trace(go.Bar(
    x=x,
    y=[31, 24, 22, 18],
    name='Y3',
    marker_color=colors[2],
    marker_line_color=colors[2],
    marker_pattern_shape='|',
))
fig.add_trace(go.Bar(
    x=x,
    y=[11, 18, 25, 23],
    name='Y4',
    marker_color=colors[3],
    marker_line_color=colors[3],
    marker_pattern_shape='+',
))
fig.add_trace(go.Bar(
    x=x,
    y=[10, 12, 14, 12],
    name='Y5',
    marker_color=colors[4],
    marker_line_color=colors[4],
    marker_pattern_shape='x',
))
fig.add_trace(go.Bar(
    x=x,
    y=[20, 19, 17, 18],
    name='Y6',
    marker_color=colors[5],
    marker_line_color=colors[5],
    marker_pattern_shape='/',
))
fig.add_trace(go.Bar(
    x=x,
    y=[15, 28, 26, 12],
    name='Y7',
    marker_color=colors[6],
    marker_line_color=colors[6],
    marker_pattern_shape='\\',
))

fig.update_traces(
    marker_line_width=1.5,
    marker_pattern_fillmode='replace',
    marker_pattern_size=6,
    marker_pattern_solidity=0.4,
)

fig.update_layout(
    width=900,
    height=300,
    margin=dict(l=0, r=0, b=0, t=0),
    barmode='group',
)
fig.show()
marker_pattern_fillmode='replace'を指定するとパターン側に色がついて背景が透明になります。
パターンを目立たせたい場合はこれ。
また、棒グラフの外枠(境界)はデフォルトでは白色ですが、そのままだと不格好なのでmarker_line_colorにmarker_colorと同じ色を指定していい感じの見た目にしています。
ついでに外枠の太さ(marker_line_width)も少し太め(1.5)に調整しています。
白黒のグラフを作る
たまに白黒のグラフを作らなければいけないこともあるかもしれません。
そういうときにpattern fillのreplaceモードは便利です。
import plotly.graph_objects as go
import plotly.io as pio

pio.templates.default = 'plotly_white'

x = ['X1', 'X2', 'X3', 'X4']

fig = go.Figure()
fig.add_trace(go.Bar(
    x=x,
    y=[20, 9, 25, 16],
    name='Y1',
    marker_pattern_shape='.',
))
fig.add_trace(go.Bar(
    x=x,
    y=[19, 14, 22, 14],
    name='Y2',
    marker_pattern_shape='-',
))
fig.add_trace(go.Bar(
    x=x,
    y=[31, 24, 22, 18],
    name='Y3',
    marker_pattern_shape='|',
))
fig.add_trace(go.Bar(
    x=x,
    y=[11, 18, 25, 23],
    name='Y4',
    marker_pattern_shape='+',
))
fig.add_trace(go.Bar(
    x=x,
    y=[10, 12, 14, 12],
    name='Y5',
    marker_pattern_shape='x',
))
fig.add_trace(go.Bar(
    x=x,
    y=[20, 19, 17, 18],
    name='Y6',
    marker_pattern_shape='/',
))
fig.add_trace(go.Bar(
    x=x,
    y=[15, 28, 26, 12],
    name='Y7',
    marker_pattern_shape='\\',
))

fig.update_traces(
    marker_color='black',
    marker_line_color='black',
    marker_line_width=1.5,
    marker_pattern_fillmode='replace',
    marker_pattern_size=6,
    marker_pattern_solidity=0.4,
)

fig.update_layout(
    width=900,
    height=300,
    margin=dict(l=0, r=0, b=0, t=0),
    barmode='group',
)
fig.show()
fig.update_tracesで全グラフオブジェクトに対し同じ設定を適用し、黒でパターンを塗りつぶしています。
背景色を設定してみる
ここまでreplaceモードで背景色は透明でしたが、色をつけることもできます。
import plotly.graph_objects as go
import plotly.io as pio

pio.templates.default = 'plotly_white'

colors = ['#77AADD', '#EE8866', '#44BB99', '#EEDD88', '#99DDFF', '#FFAABB', '#DDDDDD']

x = ['X1', 'X2', 'X3', 'X4']

fig = go.Figure()
fig.add_trace(go.Bar(
    x=x,
    y=[20, 9, 25, 16],
    name='Y1',
    marker_color=colors[0],
    marker_line_color=colors[0],
    marker_pattern_shape='.',
))
fig.add_trace(go.Bar(
    x=x,
    y=[19, 14, 22, 14],
    name='Y2',
    marker_color=colors[1],
    marker_line_color=colors[1],
    marker_pattern_shape='-',
))
fig.add_trace(go.Bar(
    x=x,
    y=[31, 24, 22, 18],
    name='Y3',
    marker_color=colors[2],
    marker_line_color=colors[2],
    marker_pattern_shape='|',
))
fig.add_trace(go.Bar(
    x=x,
    y=[11, 18, 25, 23],
    name='Y4',
    marker_color=colors[3],
    marker_line_color=colors[3],
    marker_pattern_shape='+',
))
fig.add_trace(go.Bar(
    x=x,
    y=[10, 12, 14, 12],
    name='Y5',
    marker_color=colors[4],
    marker_line_color=colors[4],
    marker_pattern_shape='x',
))
fig.add_trace(go.Bar(
    x=x,
    y=[20, 19, 17, 18],
    name='Y6',
    marker_color=colors[5],
    marker_line_color=colors[5],
    marker_pattern_shape='/',
))
fig.add_trace(go.Bar(
    x=x,
    y=[15, 28, 26, 12],
    name='Y7',
    marker_color=colors[6],
    marker_line_color=colors[6],
    marker_pattern_shape='\\',
))

fig.update_traces(
    marker_line_width=1.5,
    marker_pattern_fillmode='replace',
    marker_pattern_size=6,
    marker_pattern_solidity=0.4,
    marker_pattern_bgcolor='#444444',
)

fig.update_layout(
    width=900,
    height=300,
    margin=dict(l=0, r=0, b=0, t=0),
    barmode='group',
)
fig.show()
ここでは少し明るめのカラースキームをパターン側に適用し、背景色をmarker_pattern_bgcolor='#444444'で暗いグレーに設定しています。
ネオン灯っぽい感じ。
ちなみに前面のパターンの色はmarker_colorを用いていますが、marker_pattern_fgcolorとして明示的に設定することも可能です。
おまけ
本記事の最初に貼ったパターンは以下のようにして描けます。
import plotly.graph_objects as go
import plotly.io as pio

pio.templates.default = 'plotly_white'

colors = ['#001969', '#2e2879', '#4a3889', '#65499a', '#7f5baa', '#996dbb', '#b381cc', '#ce94dd', '#e9a9ea']

x = ['X1', 'X2', 'X3', 'X4']

fig = go.Figure()
fig.add_trace(go.Bar(
    x=x,
    y=[20, 9, 25, 16],
    name='Y1',
    marker_color=colors[0],
    marker_pattern_fgcolor=colors[7],
    marker_pattern_shape='.',
))
fig.add_trace(go.Bar(
    x=x,
    y=[19, 14, 22, 14],
    name='Y2',
    marker_color=colors[1],
    marker_pattern_fgcolor=colors[6],
    marker_pattern_shape='-',
))
fig.add_trace(go.Bar(
    x=x,
    y=[31, 24, 22, 18],
    name='Y3',
    marker_color=colors[2],
    marker_pattern_fgcolor=colors[5],
    marker_pattern_shape='|',
))
fig.add_trace(go.Bar(
    x=x,
    y=[11, 18, 25, 23],
    name='Y4',
    marker_color=colors[3],
    marker_pattern_fgcolor=colors[6],
    marker_pattern_shape='+',
))
fig.add_trace(go.Bar(
    x=x,
    y=[10, 12, 14, 12],
    name='Y5',
    marker_color=colors[6],
    marker_pattern_fgcolor=colors[2],
    marker_pattern_shape='x',
))
fig.add_trace(go.Bar(
    x=x,
    y=[20, 19, 17, 18],
    name='Y6',
    marker_color=colors[7],
    marker_pattern_fgcolor=colors[1],
    marker_pattern_shape='/',
))
fig.add_trace(go.Bar(
    x=x,
    y=[15, 28, 26, 12],
    name='Y7',
    marker_color=colors[8],
    marker_pattern_fgcolor=colors[0],
    marker_pattern_shape='\\',
))

fig.update_traces(
    marker_pattern_fillmode='overlay',
    marker_pattern_size=6,
    marker_pattern_solidity=0.4,
    marker_pattern_fgopacity=0.7,
)

fig.update_layout(
    width=900,
    height=300,
    margin=dict(l=0, r=0, b=0, t=0),
    barmode='group',
)
fig.show()
こんな感じのパターンをいくつか用意しておくと便利かもしれないです。
おわりに
以上はざっくりとした説明でしたが、コード例を元にいろいろパラメタをいじってみると楽しいと思います。
pattern fillが実装されたことで、plotlyでも十分論文などに使える図が生成できるようになりました。svgも吐けるし。めでたい。


