合成関数の偏微分法
\frac{dz}{dt} =
   \frac{\partial z}{\partial x} \frac{dx}{dt}
 + \frac{\partial z}{\partial y} \frac{dy}{dt}
を紹介する図式
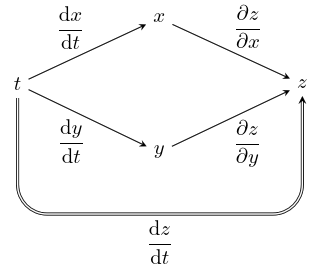
を TikZ で描く。
\matrixの利用
まずは変数をノードとして配置する。\matrix の利用が便利。
diagram.tex
\documentclass[dvipdfmx]{jsarticle}
\usepackage{tikz}


\begin{document}

\begin{tikzpicture}
\matrix {
                  & \node (x) {$x$}; &                  \\
 \node (t) {$t$}; &                  & \node (z) {$z$}; \\
                  & \node (y) {$y$}; &                  \\
};
\end{tikzpicture}

\end{document}

ノードの間隔の設定
矢線をつけてみる。
diagram.tex
\documentclass[dvipdfmx]{jsarticle}
\usepackage{tikz}


\begin{document}

\begin{tikzpicture}
\matrix {
                  & \node (x) {$x$}; &                  \\
 \node (t) {$t$}; &                  & \node (z) {$z$}; \\
                  & \node (y) {$y$}; &                  \\
};
\draw[->] (t) -- (x);
\draw[->] (x) -- (z);
\draw[->] (t) -- (y);
\draw[->] (y) -- (z);
\end{tikzpicture}

\end{document}

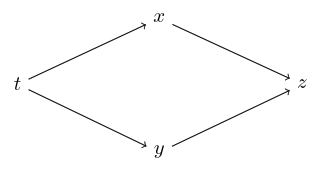
矢線になっていない。ノードの間隔が狭すぎる。
そこで,\matrix のオプション column sep,row sep によりノードの間隔を適当に設定する。
diagram.tex
\documentclass[dvipdfmx]{jsarticle}
\usepackage{tikz}


\begin{document}

\begin{tikzpicture}
\matrix [column sep=2cm, row sep=7mm] {
                  & \node (x) {$x$}; &                  \\
 \node (t) {$t$}; &                  & \node (z) {$z$}; \\
                  & \node (y) {$y$}; &                  \\
};
\draw[->] (t) -- (x);
\draw[->] (x) -- (z);
\draw[->] (t) -- (y);
\draw[->] (y) -- (z);
\end{tikzpicture}

\end{document}
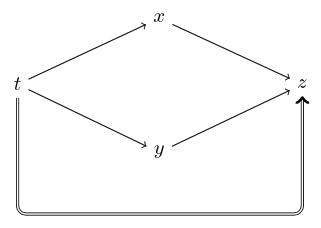
大回りの線を描くtips
$t$ から $z$ への2重矢線を引くために,ノード (y) の下にダミーノード (below y) を用意しよう。
ノード (t |- below y) は,ノード (t) を通る縦線とノード (below y) を通る横線との交点。
ノード (below y -| z) は,ノード (below y) を通る横線とノード (z) を通る縦線との交点。
角を丸くするためにオプション rounded corners を指定。
diagram.tex
\documentclass[dvipdfmx]{jsarticle}
\usepackage{tikz}


\begin{document}

\begin{tikzpicture}
\matrix [column sep=2cm, row sep=7mm] {
                  & \node (x) {$x$}; &                  \\
 \node (t) {$t$}; &                  & \node (z) {$z$}; \\
                  & \node (y) {$y$}; &                  \\
                & \node (below y) {}; &                 \\
};
\draw[->] (t) -- (x);
\draw[->] (x) -- (z);
\draw[->] (t) -- (y);
\draw[->] (y) -- (z);
\draw[->, double, rounded corners]
 (t) -- (t |- below y) -- (below y -| z) -- (z);
\end{tikzpicture}

\end{document}
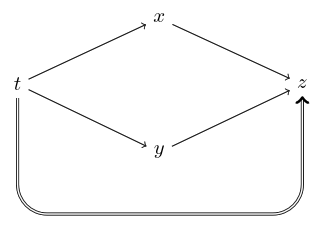
rounded corners のデフォルトは半径 4pt 。気に入らなければ変更可。
diagram.tex
\documentclass[dvipdfmx]{jsarticle}
\usepackage{tikz}


\begin{document}

\begin{tikzpicture}
\matrix [column sep=2cm, row sep=7mm] {
                  & \node (x) {$x$}; &                  \\
 \node (t) {$t$}; &                  & \node (z) {$z$}; \\
                  & \node (y) {$y$}; &                  \\
                & \node (below y) {}; &                 \\
};
\draw[->] (t) -- (x);
\draw[->] (x) -- (z);
\draw[->] (t) -- (y);
\draw[->] (y) -- (z);
\draw[->, double, rounded corners=5mm]
 (t) -- (t |- below y) -- (below y -| z) -- (z);
\end{tikzpicture}

\end{document}
矢線にラベルを貼る
(t) から (x) への矢線にラベル $\displaystyle\frac{dx}{dt}$ を貼ってみよう。
diagram.tex
\documentclass[dvipdfmx]{jsarticle}
\usepackage{tikz}


\begin{document}

\begin{tikzpicture}
\matrix [column sep=2cm, row sep=7mm] {
                  & \node (x) {$x$}; &                  \\
 \node (t) {$t$}; &                  & \node (z) {$z$}; \\
                  & \node (y) {$y$}; &                  \\
                & \node (below y) {}; &                 \\
};
\draw[->] (t) -- node {$\displaystyle\frac{dx}{dt}$} (x);
\draw[->] (x) -- (z);
\draw[->] (t) -- (y);
\draw[->] (y) -- (z);
\draw[->, double, rounded corners=5mm]
 (t) -- (t |- below y) -- (below y -| z) -- (z);
\end{tikzpicture}

\end{document}
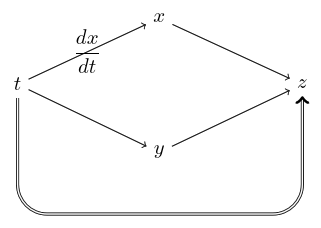
ラベルとなるノードが矢線に乗っかってしまった。
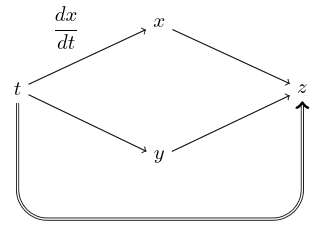
オプション auto を指定すると,TikZ が矢線のどちらかに適当に配置してくれる。
diagram.tex
\documentclass[dvipdfmx]{jsarticle}
\usepackage{tikz}


\begin{document}

\begin{tikzpicture}
\matrix [column sep=2cm, row sep=7mm] {
                  & \node (x) {$x$}; &                  \\
 \node (t) {$t$}; &                  & \node (z) {$z$}; \\
                  & \node (y) {$y$}; &                  \\
                & \node (below y) {}; &                 \\
};
\draw[->] (t) -- node [auto] {$\displaystyle\frac{dx}{dt}$} (x);
\draw[->] (x) -- (z);
\draw[->] (t) -- (y);
\draw[->] (y) -- (z);
\draw[->, double, rounded corners=5mm]
 (t) -- (t |- below y) -- (below y -| z) -- (z);
\end{tikzpicture}

\end{document}
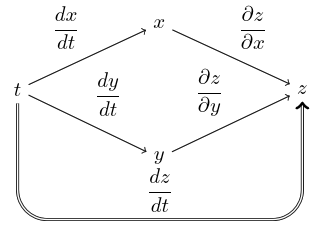
他の矢線にも然るべきラベルを貼ってみよう。
diagram.tex
\documentclass[dvipdfmx]{jsarticle}
\usepackage{tikz}


\begin{document}

\begin{tikzpicture}
\matrix [column sep=2cm, row sep=7mm] {
                  & \node (x) {$x$}; &                  \\
 \node (t) {$t$}; &                  & \node (z) {$z$}; \\
                  & \node (y) {$y$}; &                  \\
                & \node (below y) {}; &                 \\
};
\draw[->] (t) -- node [auto] {$\displaystyle\frac{dx}{dt}$} (x);
\draw[->] (x) -- node [auto] {$\displaystyle\frac{\partial z}{\partial x}$} (z);
\draw[->] (t) -- node [auto] {$\displaystyle\frac{dy}{dt}$} (y);
\draw[->] (y) -- node [auto] {$\displaystyle\frac{\partial z}{\partial y}$} (z);
\draw[->, double, rounded corners=5mm]
 (t) -- (t |- below y)
 -- node [auto] {$\displaystyle\frac{dz}{dt}$}  (below y -| z) -- (z);
\end{tikzpicture}

\end{document}
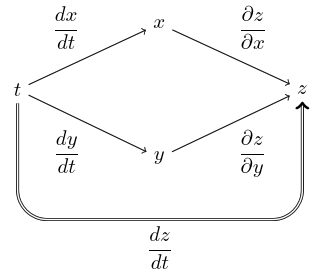
矢線の反対側に入れてほしいと思えば,auto とともにオプション swap を指定する。
diagram.tex
\documentclass[dvipdfmx]{jsarticle}
\usepackage{tikz}


\begin{document}

\begin{tikzpicture}
\matrix [column sep=2cm, row sep=7mm] {
                  & \node (x) {$x$}; &                  \\
 \node (t) {$t$}; &                  & \node (z) {$z$}; \\
                  & \node (y) {$y$}; &                  \\
                & \node (below y) {}; &                 \\
};
\draw[->] (t) -- node [auto] {$\displaystyle\frac{dx}{dt}$} (x);
\draw[->] (x) -- node [auto] {$\displaystyle\frac{\partial z}{\partial x}$} (z);
\draw[->] (t) -- node [auto, swap] {$\displaystyle\frac{dy}{dt}$} (y);
\draw[->] (y) -- node [auto, swap] {$\displaystyle\frac{\partial z}{\partial y}$} (z);
\draw[->, double, rounded corners=5mm]
 (t) -- (t |- below y)
 -- node [auto, swap] {$\displaystyle\frac{dz}{dt}$}  (below y -| z) -- (z);
\end{tikzpicture}

\end{document}
auto オプションをいちいちつけるのであれば,
\begin{tikzpicture} のオプションとして予め指定しておくのが便利かも。
diagram.tex
\documentclass[dvipdfmx]{jsarticle}
\usepackage{tikz}


\begin{document}

\begin{tikzpicture}[auto]
\matrix [column sep=2cm, row sep=7mm] {
                  & \node (x) {$x$}; &                  \\
 \node (t) {$t$}; &                  & \node (z) {$z$}; \\
                  & \node (y) {$y$}; &                  \\
                & \node (below y) {}; &                 \\
};
\draw[->] (t) -- node {$\displaystyle\frac{dx}{dt}$} (x);
\draw[->] (x) -- node {$\displaystyle\frac{\partial z}{\partial x}$} (z);
\draw[->] (t) -- node [swap] {$\displaystyle\frac{dy}{dt}$} (y);
\draw[->] (y) -- node [swap] {$\displaystyle\frac{\partial z}{\partial y}$} (z);
\draw[->, double, rounded corners=5mm]
 (t) -- (t |- below y)
 -- node [swap] {$\displaystyle\frac{dz}{dt}$}  (below y -| z) -- (z);
\end{tikzpicture}

\end{document}

ラベルは矢線の右側につけることを基本にしたいならば,明示的に auto=right を指定する。
diagram.tex
\documentclass[dvipdfmx]{jsarticle}
\usepackage{tikz}


\begin{document}

\begin{tikzpicture}[auto=right]
\matrix [column sep=2cm, row sep=7mm] {
                  & \node (x) {$x$}; &                  \\
 \node (t) {$t$}; &                  & \node (z) {$z$}; \\
                  & \node (y) {$y$}; &                  \\
                & \node (below y) {}; &                 \\
};
\draw[->] (t) -- node [swap] {$\displaystyle\frac{dx}{dt}$} (x);
\draw[->] (x) -- node [swap] {$\displaystyle\frac{\partial z}{\partial x}$} (z);
\draw[->] (t) -- node {$\displaystyle\frac{dy}{dt}$} (y);
\draw[->] (y) -- node {$\displaystyle\frac{\partial z}{\partial y}$} (z);
\draw[->, double, rounded corners=5mm]
 (t) -- (t |- below y)
 -- node {$\displaystyle\frac{dz}{dt}$}  (below y -| z) -- (z);
\end{tikzpicture}

\end{document}

ひとまず,完成。
あとは好みの問題
- 矢印の形を
stealthにする。 - 斜めの矢線について,ラベルを矢線に近づけるために
inner sepに小さい値を指定。 - $d$ を立体にするべく,ここでは
\mathrm{d}を採用する。
diagram.tex
\documentclass[dvipdfmx]{jsarticle}
\usepackage{tikz}


\begin{document}

\begin{tikzpicture}[auto=right, >=stealth]
\matrix [column sep=2cm, row sep=7mm] {
                  & \node (x) {$x$}; &                  \\
 \node (t) {$t$}; &                  & \node (z) {$z$}; \\
                  & \node (y) {$y$}; &                  \\
                & \node (below y) {}; &                 \\
};
\begin{scope}[inner sep=1pt]
\draw[->] (t) -- node [swap] {$\displaystyle\frac{\mathrm{d}x}{\mathrm{d}t}$} (x);
\draw[->] (x) -- node [swap] {$\displaystyle\frac{\partial z}{\partial x}$} (z);
\draw[->] (t) -- node {$\displaystyle\frac{\mathrm{d}y}{\mathrm{d}t}$} (y);
\draw[->] (y) -- node {$\displaystyle\frac{\partial z}{\partial y}$} (z);
\end{scope}
\draw[->, double, rounded corners=5mm]
 (t) -- (t |- below y)
 -- node {$\displaystyle\frac{\mathrm{d}z}{\mathrm{d}t}$}  (below y -| z) -- (z);
\end{tikzpicture}

\end{document}

おしまい。