背景
システムコールから先のボトルネック箇所を知りたい事がありまして、その際にperfなるものを教えてもらいました。
使ってみると色々と便利なツールで勉強になったことも多々あるのでそちらのご紹介です。
概要
perf(Performance analysis tools for Linux)とはLinuxカーネル2.6.31以降で使用可能なLinuxの性能解析ツールです。
ざっくりいえば下記
- 実行されるプログラムと OS とのイベントを見れる
- OS とハードウェアのイベントを見れる
カーネルのカウンタで計測されるイベントだったりプロセッサで計測されるイベントが知れる
例えばL1のヒット状況やTLBの様子なども観察できます。
(CPUサイクル数、分岐の数、分岐予測ミス数、キャッシュ参照数、キャッシュミス数など豊富な機能)
導入
導入はRedHat,centOSならyum,ubuntuならaptで間単にインストールできます。
今回はRHEL7.5にインストール(カーネル3.10.0-862)
$ sudo yum install perf

$ perf --version
perf version 3.10.0-862.el7.x86_64.debug
使い方
perf [サブコマンド]でプロファイルの実行だったり閲覧だったりが出来ます
サブコマンドは下記
| サブコマンド | 概要 |
|---|---|
| stat | プログラムやある時点のシステムのトータルイベントカウントを計測する |
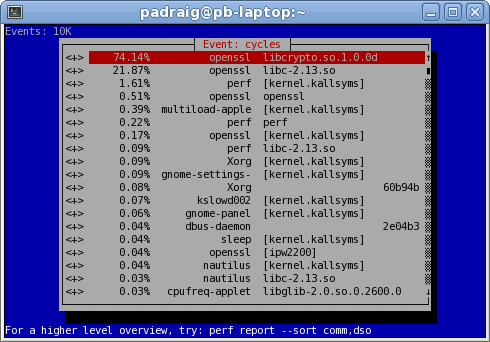
| top | 関数単位でCPU使用率を閲覧 |
| record | 一つのプログラムのイベントをサンプリング |
| report | recordで生成されたファイルを分析する |
| list | 調査可能なイベント一覧 |
メインとして使われるのは上5つとのこと他にも色々機能がありますがこちらはほぼ未調査
$ perf --help

 usage: perf [--version] [--help] [OPTIONS] COMMAND [ARGS]

 The most commonly used perf commands are:
   annotate        Read perf.data (created by perf record) and display annotated code
   archive         Create archive with object files with build-ids found in perf.data file
   bench           General framework for benchmark suites
   buildid-cache   Manage build-id cache.
   buildid-list    List the buildids in a perf.data file
   c2c             Shared Data C2C/HITM Analyzer.
   config          Get and set variables in a configuration file.
   data            Data file related processing
   diff            Read perf.data files and display the differential profile
   evlist          List the event names in a perf.data file
   ftrace          simple wrapper for kernel's ftrace functionality
   inject          Filter to augment the events stream with additional information
   kallsyms        Searches running kernel for symbols
   kmem            Tool to trace/measure kernel memory properties
   kvm             Tool to trace/measure kvm guest os
   list            List all symbolic event types
   lock            Analyze lock events
   mem             Profile memory accesses
   record          Run a command and record its profile into perf.data
   report          Read perf.data (created by perf record) and display the profile
   sched           Tool to trace/measure scheduler properties (latencies)
   script          Read perf.data (created by perf record) and display trace output
   stat            Run a command and gather performance counter statistics
   test            Runs sanity tests.
   timechart       Tool to visualize total system behavior during a workload
   top             System profiling tool.
   probe           Define new dynamic tracepoints
   trace           strace inspired tool

 See 'perf help COMMAND' for more information on a specific command.
ちなみにmanを見るときはそれぞれper-[サブコマンド]の形で見れます
perf-stat(1), perf-top(1), perf-record(1), perf-report(1), perf-list(1)
実行
perf recordを使う
とりあえず簡単なプログラムを書いて実行例を示します。
mmapしてwriteするだけのプログラム。
これに対してperf recordを実行し実行時間が特にかかっている処理を確認します。
# include <stdio.h>
# include <fcntl.h>
# include <sys/mman.h>
# include <string.h>

# define FILE_SIZE 1024

int main(void) {
    int fd;
    char *map;
    char c = 0;
    long page_size, map_size;

    fd = open("writeFile", O_CREAT | O_RDWR, 0666);
    if(fd < 0) {
        printf("Error : can't open file\n");
        return -1;
    }

    page_size = getpagesize();
    map_size = (FILE_SIZE / page_size + 1) * page_size;

    lseek(fd, map_size, SEEK_SET);
    write(fd, &c, sizeof(char));
    lseek(fd, 0, SEEK_SET);

    map = (char*)mmap(NULL, map_size, PROT_WRITE, MAP_SHARED, fd, 0);
    if(map == MAP_FAILED) {
        printf("Error : mmap failed\n");
        return -1;
    }

    strcat(map, "perf tools test\n");
    strcat(map, "aaaaaaaaaaaaaaa\n");
    strcat(map, "bbbbbbbbbbbbbbb\n");

    msync(map, map_size, 0);

    close(fd);
    munmap(map, map_size);

    return 0;
}
上記をコンパイルし実行。perf record, reportを実施
# 測定開始
$ perf record ./test
[ perf record: Woken up 1 times to write data ]
[ perf record: Captured and wrote 0.014 MB perf.data (8 samples) ]
# 測定結果を確認する
$ perf report | head -n 20
# To display the perf.data header info, please use --header/--header-only options.
#
#
# Total Lost Samples: 0
#
# Samples: 8  of event 'cycles:u'
# Event count (approx.): 441279
#
# Overhead  Command  Shared Object  Symbol
# ........  .......  .............  .......................
#
    59.13%  test     ld-2.17.so     [.] _dl_relocate_object
    34.89%  test     ld-2.17.so     [.] dl_main
     5.98%  test     ld-2.17.so     [.] _start
共有ライブラリld-2.17.soの「_dl_relocate_object」が特に時間がかかっていることが分かる。
このように具体的になんの処理が遅いのかの切り分けが出来るようになります。
またperfにはキャッシュミス回数の測定などにも使えるとのこと
下記がとても参考になるので是非ご覧ください。
http://laysakura.hateblo.jp/entry/20111015/1318738362
perf statを使う
$ perf stat dd if=/dev/zero of=./aaa bs=1M count=32
32+0 records in
32+0 records out
33554432 bytes (34 MB) copied, 0.0183909 s, 1.8 GB/s

 Performance counter stats for 'dd if=/dev/zero of=./aaa bs=1M count=32':

    2440.034235  task-clock-msecs         #      0.134 CPUs
            428  context-switches         #      0.000 M/sec
              4  CPU-migrations           #      0.000 M/sec
            420  page-faults              #      0.000 M/sec
     3857327327  cycles                   #   1580.850 M/sec
      822921345  instructions             #      0.213 IPC
       21888683  cache-references         #      8.971 M/sec
        2781896  cache-misses             #      1.140 M/sec
| 項目名 | 概要 |
|---|---|
| task-clock-msecs | CPU使用時間 |
| context-switches | コンテキストスイッチした回数 |
| CPU-migrations | 別のCPUに移動した回数 |
| page-faults | ページフォルトした回数 |
| cycles | 使ったCPUのクロック数 |
| instructions | キャンセル命令数 |
| cache-references | キャッシュヒット回数 |
| cache-misses | キャッシュミス回数 |
CPU使用時間は当然ながらコンテキストスイッチの回数だったりキャッシュミス回数だったりが
可視化される。perf_event_open(2)を使用することでイベントカウンタのfdを入手しこれをread()することで
カウント数などを得ている
以下のようなオプションを使うとユーザレベルでの命令回数などが簡単に取得できる
| Modifiers | Description | Example |
|---|---|---|
| u | monitor at priv level 3, 2, 1 (user) | event:u |
| k | monitor at priv level 0 (kernel) | event:k |
| h | monitor hypervisor events on a virtualization environment | event:h |
| H | monitor host machine on a virtualization environment | event:H |
| G | monitor guest machine on a virtualization environment | event:G |
$ perf stat -e instructions:u dd if=/dev/zero of=/dev/null count=100000
100000+0 records in
100000+0 records out
51200000 bytes (51 MB) copied, 0.0371708 s, 1.4 GB/s

 Performance counter stats for 'dd if=/dev/zero of=/dev/null count=100000':

        40,062,814      instructions:u

       0.038015773 seconds time elapsed
ここら辺の仕組みの理解で良いまとめがあれば教えてください。
まとめ
とりあえずperfのインストールから使い方や考え方について色々調べてみました。
ただ使えてもそこから何を見出すかや傾向分析なんかは経験が一番必要というお話をされました。
(現に使ってみてカーネルのどの部分が遅いなど分かっても対策案を出すにはいたりませんでした)
参考リンク
http://www.brendangregg.com/perf.html
http://int.main.jp/txt/perf.html
http://nbisco.hatenablog.com/entry/2016/12/12/000000
http://d.hatena.ne.jp/kumagi/20110327
https://www.ibm.com/developerworks/jp/linux/library/l-analyzing-performance-perf-annotate-trs/index.html