はじめに
本記事はR言語の基本的な文法をまとめたもの。環境構築(RStudioのインストール手順等)は扱わない。RStudioを用いている前提の箇所があれば都度言及する。
1. R言語入門
1.1. 電卓としての使い方
- Rはインタプリンタ言語なので1行コマンドを入力して、それを直ちに実行できる。
> 3+4
[1] 7
- 以下のように関数電卓的な使用もできる。
> sin(pi/6)+cos(pi/3)+sqrt(9)+log(exp(1))
[1] 5
- 指定した数だけ正規乱数を発生させる。(rnorm)
> rnorm(20)
 [1] -1.02053634 -0.55488115 -1.47187573  0.82275377  0.81083345 -0.32256125
 [7]  0.98641516 -1.87007312 -1.15759474 -0.26185971 -0.05742923  1.17155699
[13]  0.05900137  0.21806631 -0.47697859 -0.11519124 -1.74180094  0.64473029
[19]  0.31408455  0.17466594
出力行の[1]などはその行の先頭の要素が何番目の要素か示したもの(実行時の出力画面のウィンドウ幅によって決定する)。
1.2. ベクトル
単一のデータ型。Rにおいて、数値1つだけでも大きさ1のベクトルとして扱われる。
- ベクトルの明示的な作成には
c()関数を用いる。
> c(1,3,10)
[1]  1  3 10
> c(sin(pi/3),sqrt(2))
[1] 0.8660254 1.4142136
- 文字列のベクトルはダブルクォート若しくはシングルクォートで囲む。
- 数値型と文字列型が混在する場合、数値型が強制的に文字型になる。
> c("Hello","world")
[1] "Hello" "world"
> # 計算結果が文字型に変換
> c("Hello","world",2022)
[1] "Hello" "world" "2022"
- 規則的に並ぶ数列の作成例などを示す。
> # 1ずつ増加する数列
> 1:10
 [1]  1  2  3  4  5  6  7  8  9 10
> # 同じ数列の繰り返し
> rep(10,3)
[1] 10 10 10
> # 等差数列(1から2まで0.1ずつ増加)
> seq(1,2,0.1)
 [1] 1.0 1.1 1.2 1.3 1.4 1.5 1.6 1.7 1.8 1.9 2.0
1.3. 変数への代入とベクトルの演算
- 代入演算子は
<-により行われる。 - 変数の内容を確認したいときは、単に変数名を実行する。
> x <- c(3,6,10)
> x
[1]  3  6 10
- ベクトル同士の演算は、要素数が等しいならば対応する要素同士で演算する。
> y <- c(3,2,5)
> x/y
[1] 1 3 2
- 実数とベクトルの演算は、その演算が要素ごとに掛かる。
[1]  3  6 10
> x*2
[1]  6 12 20
> x^2
[1]   9  36 100
1.4. 配列と行列
ベクトルに次元属性を付与することで簡単に高次元配列が作成できる。
-
dim()を用いて、ベクトルを代入することで各次元の要素数を指定できる。
> # 2次元配列
> x <- 1:9
> dim(x) <- c(3,3) # 3*3行列
> x
     [,1] [,2] [,3]
[1,]    1    4    7
[2,]    2    5    8
[3,]    3    6    9
>
> # 3次元配列
> x <- 1:27
> dim(x) <- c(3,3,3) # 3*3*3
> x
, , 1

     [,1] [,2] [,3]
[1,]    1    4    7
[2,]    2    5    8
[3,]    3    6    9

, , 2

     [,1] [,2] [,3]
[1,]   10   13   16
[2,]   11   14   17
[3,]   12   15   18

, , 3

     [,1] [,2] [,3]
[1,]   19   22   25
[2,]   20   23   26
[3,]   21   24   27
- 要素の参照はベクトルとしても、配列の要素としても参照できる。
> x[4]
[1] 4
> x[1,2,1]
[1] 4
- 行列はmatrixで作成できる。
-
ncol:列数を指定。 -
byrow:行方向に行列を形成するか否か(デフォルトFALSE)
> matrix(1:15,ncol=5,byrow=TRUE)
     [,1] [,2] [,3] [,4] [,5]
[1,]    1    2    3    4    5
[2,]    6    7    8    9   10
[3,]   11   12   13   14   15
ベクトル同士を連結し、行列にすることもできる。
-
cbind():行方向に連結。 -
rbind():列方向に連結。
> cbind(1:2,4:5,7:8)
     [,1] [,2] [,3]
[1,]    1    4    7
[2,]    2    5    8
>
> rbind(1:2,4:5,7:8)
     [,1] [,2]
[1,]    1    2
[2,]    4    5
[3,]    7    8
>
> # 行列と連結させることもできる
> cbind(matrix(1:6,ncol=2),7:9)
     [,1] [,2] [,3]
[1,]    1    4    7
[2,]    2    5    8
[3,]    3    6    9
1.5. 因子型
R言語独特の型。統計データには質的変数(量的ではないデータ)がある。それらを扱うために導入される。
- 因子型変数は水準(
Levels)が出力される。 -
as.numeric():因子型を数値型に変換する。その際、水準番号に変換されることに注意(Rは1始まり)。 -
as.character():因子型を文字型に変換する。
> # 数値による因子型作成
> hakata <- c(0,2,3,1,3,2,1,2)
> factor_hakata <- factor(hakata,levels=0:3)
> factor_hakata
[1] 0 2 3 1 3 2 1 2
Levels: 0 1 2 3
> as.numeric(factor_hakata)
[1] 1 3 4 2 4 3 2 3
> as.numeric(as.character(factor_hakata))
[1] 0 2 3 1 3 2 1 2
-
levels()関数により、水準の参照・代入が可能。
> levels(factor_hakata)
[1] "0" "1" "2" "3"
> levels(factor_hakata) <- c("天ぷら","もつ鍋","ラーメン","ごまさば")
> factor_hakata
[1] 天ぷら   ラーメン ごまさば もつ鍋   ごまさば ラーメン もつ鍋   ラーメン
Levels: 天ぷら もつ鍋 ラーメン ごまさば
> as.numeric(factor_hakata)
[1] 1 3 4 2 4 3 2 3
1.6. リスト(型)
複数の異なるベクトルの集まりを1つのオブジェクトとして扱うデータ構造のこと。(C++でいうところの構造体に近い?)
> description <- "英語のテスト"
> reading <- c(198,132,180,97,190)
> listening <- c(50,29,37,15,41)
> # リストを作成
> english <- list(description=description,reading=reading,listening=listening)
> english
$description
[1] "英語のテスト"

$reading
[1] 198 132 180  97 190

$listening
[1] 50 29 37 15 41
-
{リストのオブジェクト名}${要素の参照名}でリストの要素を参照できる。
> english$reading
[1] 198 132 180  97 190
- 要素番号で参照することもできる。
> english[[2]]
[1] 198 132 180  97 190
- 要素の文字列で指定して参照できるが、その場合はリストとして返される。
> english["reading"]
$reading
[1] 198 132 180  97 190

> class(english["reading"])
[1] "list"
- リストの要素の参照名一覧は
names()で取得できる。
> names(english)
[1] "description" "reading"     "listening"
1.7. データフレーム
同じ長さのベクトルを要素とするリストである。つまり、テーブル形式のデータ集合を扱うための構造体である。
- データフレームの各行を個体。各列を変数という。
- データフレームの作成には
data.frame()を用いる。引数はlist()と同じ。
> english.seiseki <- data.frame(people=c("Bob","John","Ken","Michel","Alice"),reading=reading,listening=listening)
> english.seiseki
  people reading listening
1    Bob     198        50
2   John     132        29
3    Ken     180        37
4 Michel      97        15
5  Alice     190        41
リストの時と同様に、要素名を指定して値を返す。
> english.seiseki$reading
[1] 198 132 180  97 190
> english.seiseki["listening"]
  listening
1        50
2        29
3        37
4        15
5        41
リストとは異なり、行列の要領で値を参照することもできる。
> english.seiseki[5,2]
[1] 190
余談
Rで統計分析を行う関数の多くは引数にデータフレームを取ったり、戻り値としてデータフレームが返される。重要な型である。
2. 外部データの読み込み
- CSVファイルをデータフレームとして読み込むには
read.csv()を用いる。
実行例で用いているcsvファイルはhttps://archive.ics.uci.edu/ml/machine-learning-databases/00292/ より取得できる。
> ws.customer <- read.csv("Wholesale customers data.csv")
> ws.customer
    Channel Region Fresh  Milk Grocery Frozen Detergents_Paper Delicassen
1         2      3 12669  9656    7561    214             2674       1338
2         2      3  7057  9810    9568   1762             3293       1776
3         2      3  6353  8808    7684   2405             3516       7844
4         1      3 13265  1196    4221   6404              507       1788
5         2      3 22615  5410    7198   3915             1777       5185

... 中略 ..

121       1      3 17160  1200    3412   2417              174       1136
122       1      3  4020  3234    1498   2395              264        255
123       1      3 12212   201     245   1991               25        860
124       2      3 11170 10769    8814   2194             1976        143
125       1      3 36050  1642    2961   4787              500       1621
 [ reached 'max' / getOption("max.print") -- omitted 315 rows ]
- タブ区切りのようなカンマ区切りではないデータは
read.table()関数で取得できる。たとえばCSVをEXCELで開いてコピーするとタブ区切りになるが、それを取得するには以下のように書く。 - タブ区切りでない場合、
read.table()関数の中でsep=で区切り文字を指定する。
> ws.customer <- read.table("clipboard",header=T)
> ws.customer
  Channel Region Fresh Milk Grocery Frozen
1       2      3 12669 9656    7561    214
2       2      3  7057 9810    9568   1762
3       2      3  6353 8808    7684   2405
このときクリップボードは以下のようになっている。

また、ファイルを読み取る場合は、第一引数にclipboardの代わりにファイルのパスを設定する。
3. データの要約
データフレームに格納される各列のデータについて、代表的な統計量(平均・中央値・分散・標準偏差・四分位偏差)などを計算する関数summary()を適用し、データの要約ができる。
- Min:最小値
- 1st Qu:第1四分位点(中央値以下のデータの中の中央値)
- Median:中央値
- Mean:平均値
- 3rd Qu:第3四分位点(中央値以上のデータの中の中央値)
- Max:最大値
> # ChannelとRegionは名義尺度なので、因子型に変換
> ws.customer$Channel <- factor(ws.customer$Channel,labels=c("Horeca","Retail"))
> ws.customer$Region <- factor(ws.customer$Region,labels=c("Lisbon","Oporto","Other Region"))
> summary(ws.customer)
   Channel             Region        Fresh             Milk          Grocery          Frozen        Detergents_Paper    Delicassen
 Horeca:298   Lisbon      : 77   Min.   :     3   Min.   :   55   Min.   :    3   Min.   :   25.0   Min.   :    3.0   Min.   :    3.0
 Retail:142   Oporto      : 47   1st Qu.:  3128   1st Qu.: 1533   1st Qu.: 2153   1st Qu.:  742.2   1st Qu.:  256.8   1st Qu.:  408.2
              Other Region:316   Median :  8504   Median : 3627   Median : 4756   Median : 1526.0   Median :  816.5   Median :  965.5
                                 Mean   : 12000   Mean   : 5796   Mean   : 7951   Mean   : 3071.9   Mean   : 2881.5   Mean   : 1524.9
                                 3rd Qu.: 16934   3rd Qu.: 7190   3rd Qu.:10656   3rd Qu.: 3554.2   3rd Qu.: 3922.0   3rd Qu.: 1820.2
                                 Max.   :112151   Max.   :73498   Max.   :92780   Max.   :60869.0   Max.   :40827.0   Max.   :47943.0
-
var():分散を計算。 -
sd():標準偏差を計算。 -
IQR():四分位偏差(第3四分位点と第1四分位点の差)を計算。 -
cor():相関係数を計算。
> var(ws.customer$Fresh)
[1] 159954927
> sd(ws.customer$Fresh)
[1] 12647.33
> IQR(ws.customer$Fresh)
[1] 13806
> # 因子型を除くために3列目以降のみ指定している。
> cor(ws.customer[,3:6])
              Fresh      Milk     Grocery      Frozen
Fresh    1.00000000 0.1005098 -0.01185387  0.34588146
Milk     0.10050977 1.0000000  0.72833512  0.12399376
Grocery -0.01185387 0.7283351  1.00000000 -0.04019274
Frozen   0.34588146 0.1239938 -0.04019274  1.00000000
4. パッケージのインストール
-
install.packages()関数でインストールする。 -
library()関数で使えるようにする。- インストールは最初の1度のみ行うが、
library()はRを起動するたびに実行する必要がある。
- インストールは最初の1度のみ行うが、
> install.packages("dplyr")
> library(dplyr)
5. dplyrによるデータフレーム操作
Rの標準関数でもいいが、実行速度に難があるためdplyrを用いる。
-
filter():条件式を追加し、条件を満たす個体(行)のみ抽出する。カンマ区切りのときはAND,「|」区切りの時はORである。
> filter(ws.customer,Frozen>8000,Grocery>9000)
  Channel       Region  Fresh  Milk Grocery Frozen Detergents_Paper Delicassen
1  Horeca Other Region 112151 29627   18148  16745             4948       8550
2  Horeca Other Region  36847 43950   20170  36534              239      47943
3  Horeca       Lisbon   5909 23527   13699  10155              830       3636
4  Horeca Other Region  68951  4411   12609   8692              751       2406
5  Horeca       Oporto  32717 16784   13626  60869             1272       5609
6  Horeca Other Region  29703 12051   16027  13135              182       2204
>
> filter(ws.customer,Frozen>8000|Grocery>9000)
    Channel       Region  Fresh  Milk Grocery Frozen Detergents_Paper Delicassen
1    Retail Other Region   7057  9810    9568   1762             3293       1776
2    Retail Other Region   7579  4956    9426   1669             3321       2566
3    Retail Other Region   6006 11093   18881   1159             7425       2098
4    Retail Other Region   3366  5403   12974   4400             5977       1744

... 中略 ..

123  Retail       Oporto   9759 25071   17645   1128            12408       1625
124  Horeca       Oporto  13360   944   11593    915             1679        573
125  Horeca       Oporto  32717 16784   13626  60869             1272       5609
 [ reached 'max' / getOption("max.print") -- omitted 41 rows ]
-
select():指定した変数名を抽出する。コロンで連続する変数を抽出できる。カンマは指定した変数のみ抽出する。
> select(ws.customer,Channel:Milk)
    Channel       Region  Fresh  Milk
1    Retail Other Region  12669  9656
2    Retail Other Region   7057  9810
3    Retail Other Region   6353  8808
4    Horeca Other Region  13265  1196
... 略 ..
> select(ws.customer,Channel,Delicassen)
  Channel Delicassen
1  Retail       1338
2  Retail       1776
3  Retail       7844
4  Horeca       1788
... 略 ..
-
summarize():データの要約を行う。後述するが因子ごとにグループ分けした統計量も容易に算出できる。
下記例では、1列目にデータ数、2,3列目にそれぞれの変数の平均を出力。
> summarise(ws.customer,n=n(),Fresh.m=mean(Fresh),Milk.m=mean(Milk))
    n Fresh.m   Milk.m
1 440 12000.3 5796.266
-
group_by():因子型の種類ごとにグループ分けする。以下の例ではChannelとRegionについてグループ分けしている。
この状態でsummariseするとグループごとの統計量が計算できる。
> ws.customer.g <- group_by(ws.customer,Channel,Region)
> summarise(ws.customer.g,n=n(),Fresh.m=mean(Fresh),Milk.m=mean(Milk),.groups="keep")
# A tibble: 6 × 5
# Groups:   Channel, Region [6]
  Channel Region           n Fresh.m Milk.m
  <fct>   <fct>        <int>   <dbl>  <dbl>
1 Horeca  Lisbon          59  12902.  3870.
2 Horeca  Oporto          28  11651.  2304.
3 Horeca  Other Region   211  13878.  3487.
4 Retail  Lisbon          18   5200  10784
5 Retail  Oporto          19   7290.  9191.
6 Retail  Other Region   105   9832. 10981.
-
arrange():データをソートする。
ソートしたい変数をカンマ区切りで指定する。デフォルトは昇順だが、desc()により降順にできる。左に書いた変数ほど優先してソートされる。
> arrange(ws.customer,Fresh,Milk,Grocery)
  Channel       Region Fresh Milk Grocery Frozen Detergents_Paper Delicassen
1  Horeca       Oporto     3  333    7021  15601               15        550
2  Horeca Other Region     3 2920    6252    440              223        709
3  Horeca Other Region     9 1534    7417    175             3468         27
4  Retail       Lisbon    18 7504   15205   1285             4797       6372
5  Retail Other Region    23 2616    8118    145             3874        217
... 略 ..
>
> arrange(ws.customer,desc(Fresh),Milk,Grocery)
  Channel       Region  Fresh  Milk Grocery Frozen Detergents_Paper Delicassen
1  Horeca Other Region 112151 29627   18148  16745             4948       8550
2  Horeca Other Region  76237  3473    7102  16538              778        918
3  Horeca Other Region  68951  4411   12609   8692              751       2406
4  Horeca Other Region  56159   555     902  10002              212       2916
5  Horeca       Lisbon  56083  4563    2124   6422              730       3321
... 略 ..
-
%>%によるデータフレーム操作の結合
上記を組み合わせた一連の操作をするために、通常では1つ1つの操作で別のオブジェクトを作りそのオブジェクトをまた上記関数に渡し......という面倒な操作が生じる。それを回避するために用いる。その際に2つ目以降の関数ではデータフレームを引数に書かずに実行できる。
> select(ws.customer,Channel,Delicassen) %>% # 変数を選択する
+   arrange(desc(Delicassen)) %>% # 選択したデータフレームをソートする
+   head(4) # 選択&ソートしたデータフレームの上から4行目を抽出する
  Channel Delicassen
1  Horeca      47943
2  Retail      16523
3  Horeca      14472
4  Horeca      14351
6. データの可視化
可視化もRの標準関数があるが、ggplot2というパッケージを用いるのが主流のよう。ここでもそれを用いる。
> install.packages("ggplot2")
> library(ggplot2)
qplot関数について
ggplot2のqplot()関数の第一引数等に渡すデータ型により描画する図のタイプが変わるので、まずまとめておく。詳細は後述する。
- 棒グラフ:因子型の変数が1つだけ指定された場合
- ヒストグラム:量的変数が1つだけ指定された場合
- 箱ひげ図(ドットチャート):因子型の変数と量的変数が指定された場合
- 散布図:量的変数が2つ指定された場合
6.1. 棒グラフ
主に質的変数と比例尺度の組からなるデータの可視化に用いられる。
-
ws.customerデータにおいて、Channelの度数は以下のようにtable()関数で求められる。
> channel.tab <- table(ws.customer$Channel)
> channel.tab

Horeca Retail
   298    142
- 因子型1つ指定すると、棒グラフになる。
qplot(Channel,data=ws.customer,fill=I("red"),ylab="度数")
- 棒グラフを更に別の質的変数のカテゴリの比率に応じて区切り、対応する色を割り当てることができる。これを積み上げ縦棒グラフという。
> qplot(Channel,data=ws.customer,fill=Region,ylab="度数")
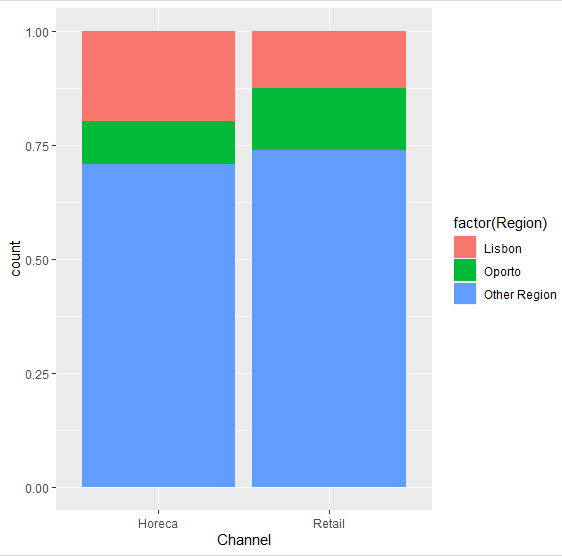
- 帯グラフ(100%積み上げ棒グラフ)は
qplotを使用できないのでggplotで以下のように書く。
> ggplot(ws.customer) +
+   aes(Channel, fill=factor(Region)) +
+   geom_bar(position="fill")
6.2. ヒストグラム
量的変数の値の分布をみるために用いる。
-
qplot()で1つの量的変数を指定することでヒストグラムを出力する。
> qplot(Milk,data=ws.customer,fill=I("grey"),color=I("black"),binwidth=8000,ylab="度数")
6.3. 箱ひげ図
質的変数により分類された個体のグループごとに、量的変数の分布を比較したいときに用いる。
-
qplotで質的変数と量的変数が指定された場合、ドットチャートが出力される。ひげ図を出力するにはgeom="boxplot"を追加する。
> qplot(Channel,Milk,data=ws.customer,geom="boxplot")
- 箱の下限と上限がそれぞれ第1四分位点、第3四分位点。箱の中の線が中央値(第3四分位点)となる。
- 箱から延びる線(ひげ)の下限、上限はそれぞれ(
第1四分位点-1.5*{第3四分位点-第1四分位点},第3四分位点+1.5*{第3四分位点-第1四分位点})の範囲にあるデータの最小値および最大値である。慣習的にこの範囲外のデータを外れ値として別途プロットしているのが上記の箱ひげ図である。
6.4. 散布図
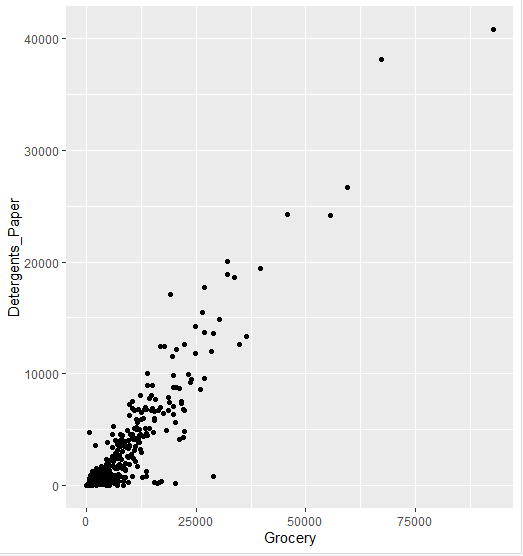
2つの量的変数を座標平面上にプロットすることで、関連性を見るときに用いる。
-
qplot2つの量的変数を指定することで、散布図を作成できる。
> qplot(Grocery,Detergents_Paper,data=ws.customer)
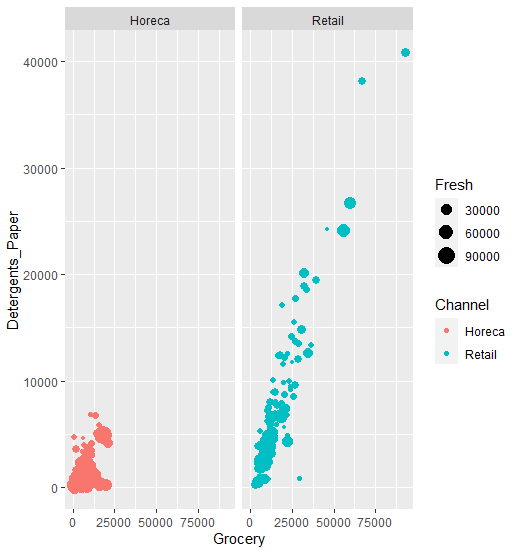
- プロットの大きさや色をそれぞれ別の変数に対応させて描画することもできる。
qplot(Grocery,Detergents_Paper,data=ws.customer,size=Fresh,color=Channel)
6.5. 層別プロット
質的カテゴリごとのプロットを図を分けて描画できる。以下の例では上記の散布図の例をChannelごとに分けて描画する。
qplot(Grocery,Detergents_Paper,data=ws.customer,size=Fresh,color=Channel,facets=~Channel)
さらにRegionで分けることもできる。
> qplot(Grocery,Detergents_Paper,data=ws.customer,size=Fresh,color=Channel,facets=Region~Channel)


