production.log監視の次はリアルタイムのパフォーマンス監視を求めてAmazonES+オンプレElasticAPM/kibanaで可視化してみました。
構成
- Amazon Elasticsearch Service 6.4
- 構築済み
- Kibanaサーバ(オンプレ:CentOS7)
- kibana-oss-6.3.0
- APM Server
- Redmineサーバ(オンプレ:CentOS7)
- APM Ruby Agent
前提
- Redmineのディレクトリを %REDMINE_DIR% と記述します
- Redmineの実行ユーザを %REDMINE_USER% と記述します
- Amazon ESのアクセスポリシーは以下
- 「特定のIPからのドメインへのアクセスを許可」として会社のゲートウェイIPを指定
Kibanaサーバ
1.リポジトリ定義
以下を新規作成
/etc/yum.repos.d/elastic.repo
[elastic-6.x]
name=Elastic repository for 6.x packages
baseurl=https://artifacts.elastic.co/packages/6.x/yum
gpgcheck=1
gpgkey=https://artifacts.elastic.co/GPG-KEY-elasticsearch
enabled=1
autorefresh=1
type=rpm-md
2.kibana-ossの導入
rpm --import https://packages.elastic.co/GPG-KEY-elasticsearch
yum install kibana-oss
AmazonESに接続できるのはOSS版のみです。
3.kibanaの設定
以下を修正
/etc/kibana/kibana.yml
server.host: "0.0.0.0"
elasticsearch.url: "http://search-XXXXXXXXXXXX.ap-northeast-1.es.amazonaws.com:80/"
kibana.index: ".kibana-6"
を参考に
-
elasticsearch.urlは、http&ポート80で設定 -
kibana.indexはAmazonESのkibanaが.kibanaで使用しているため別名で定義
としています。
4.kibanaの起動
firewall-cmd --permanent --add-port=5601/tcp
firewall-cmd --reload
systemctl enable kibana
systemctl start kibana
5.APM Serverの導入
yum install apm-server
6.APM Serverの設定
以下を修正
- APM ServerのListenポート
-
hostを修正
/etc/apm-server/apm-server.yml
apm-server:
  # Defines the host and port the server is listening on.  use "unix:/path/to.sock" to listen on a unix domain socket.
  host: "0.0.0.0:8200"
- 送信先Elasticsearchのエンドポイント
-
hostsを修正 -
protocolをコメントイン
/etc/apm-server/apm-server.yml
output.elasticsearch:
  # Array of hosts to connect to.
  # Scheme and port can be left out and will be set to the default (http and 9200)
  # In case you specify and additional path, the scheme is required: http://localhost:9200/path
  # IPv6 addresses should always be defined as: https://[2001:db8::1]:9200
  hosts: ["search-XXXXXXXXXXXX.ap-northeast-1.es.amazonaws.com:443"]

  # Boolean flag to enable or disable the output module.
  #enabled: true

  # Set gzip compression level.
  #compression_level: 0

  # Optional protocol and basic auth credentials.
  protocol: "https"
apm-server setup
うまくいくと以下のように表示されます。
Loaded index template
Loading dashboards (Kibana must be running and reachable)
Loaded dashboards
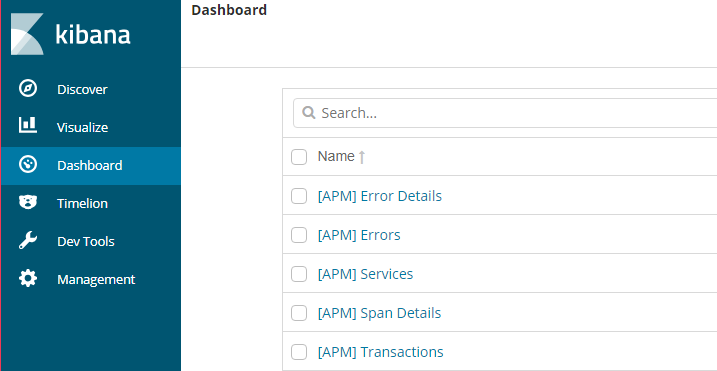
この段階でkibanaにAPMのDashboardが5つできあがっていました。
7.APM Serverの起動
firewall-cmd --permanent --add-port=8200/tcp
firewall-cmd --reload
systemctl enable apm-server
systemctl start apm-server
Redmineサーバ
1.APM Ruby Agentの導入
sudo su - %REDMINE_USER% -s /bin/bash
cd %REDMINE_DIR%
echo 'gem "elastic-apm"' >> Gemfile.local
bundle install
2.APM Ruby Agentの設定
以下を新規作成
%REDMINE_DIR%/config/elastic_apm.yml
server_url: 'http://XXX.XXX.XXX.XXX:8200'
secret_token: <%= ENV["VERY_SECRET_TOKEN"] %>
server_urlにはKibanaサーバのホスト名/IPを設定します。
以下を追加
%REDMINE_DIR%/config/application.rb
config.elastic_apm.service_name = 'Redmine'
その他のconfig.XXXと同じネストになるように追加します。
この後、Redmine自体を再起動すると、Redmineサーバ→Kibanaサーバ(APM Server)→AmazonESとデータが飛び始めます。
ダッシュボードで確認
[APM] Services
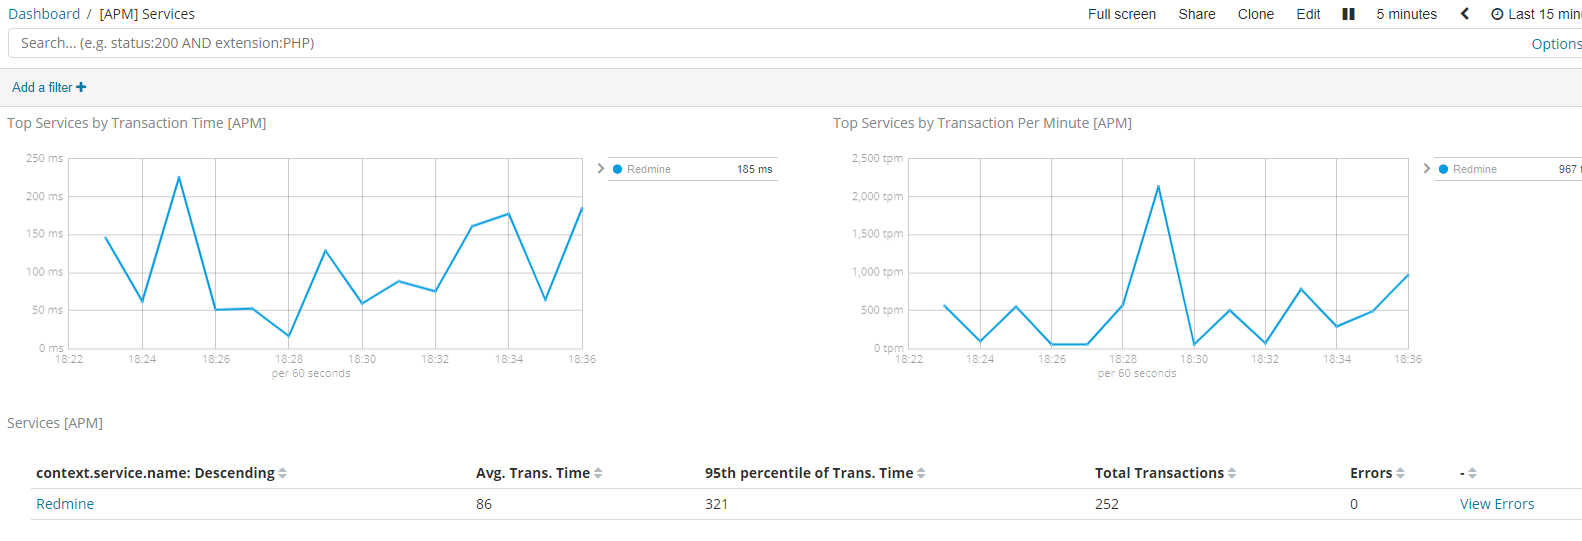
まずは全体俯瞰
[APM] Transactions
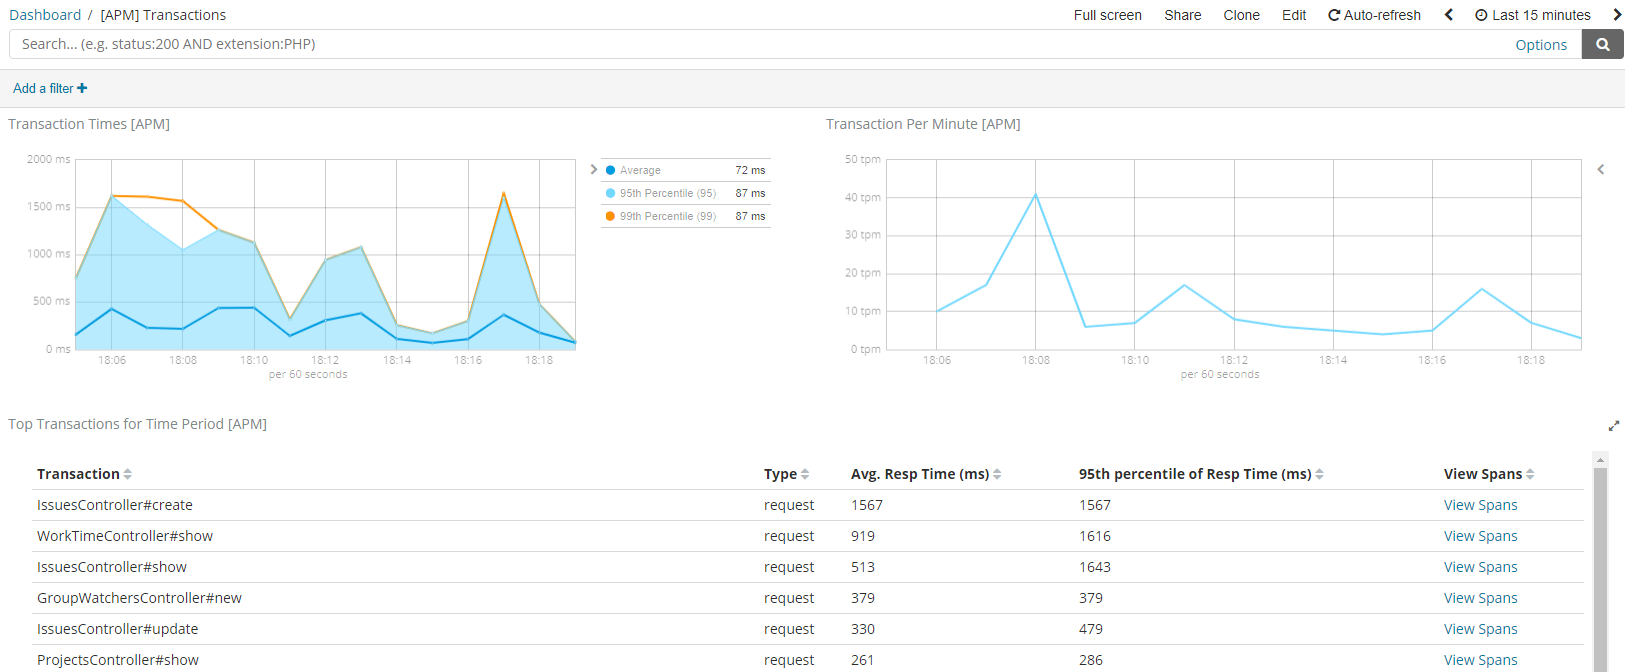
1リクエスト単位での平均時間などでしょうか。
ViewSpansをクリックするとSpan Detailsに飛びました。
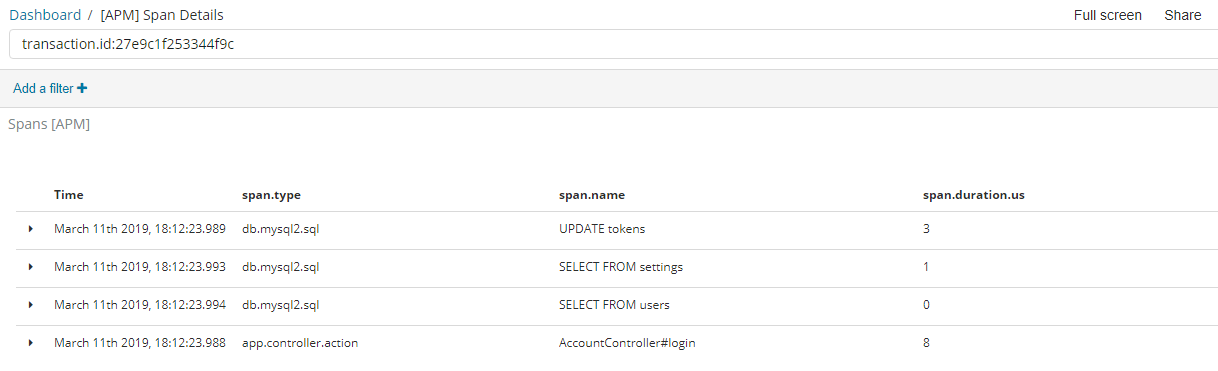
[APM] Span Details
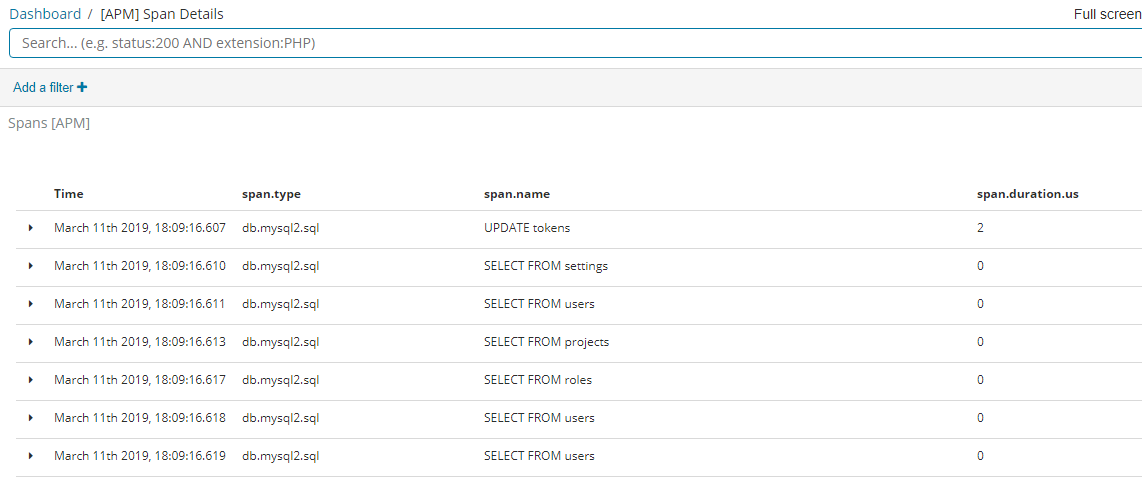
アクションやクエリ単位での実行時間のようです。
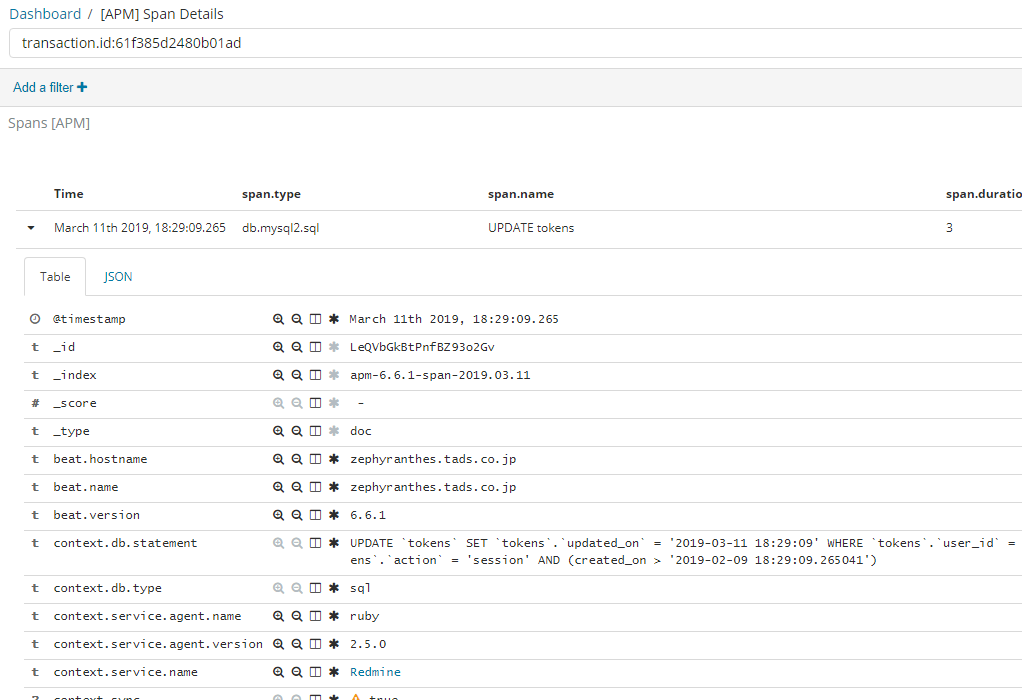
実際のクエリも確認できました。
[APM] Errors,[APM] Error Detailsはデータが無かったので割愛。
分散トレーシングにも興味があったので、しばらく使い込んでみようと思います。