イントロ
baseplot を始めとしたパッケージで相関図のための散布図(scatter plot)を描こうと思えば、便利なlibraryが幾つかあります。
下記に代表的な例を示します。
GGally(ggpairs)やPerformanceAnalytics, psychなどです。
美しいペアプロット図を簡単に作る(teramonagiさま)
R package for identifying relationships between variables (stats.stackexchange)
ですが、沢山の相関図を描きたいときには、図が小さくなってしまいます。
そこで、一枚一枚を描き出すプログラムを書いて見たかったのです。
スクリプトコード
今回、ggplotとfor文,combn関数を用いて次のようはスクリプトコードを書きました。
(データは、irisデータです)
# iris data scatter plot with combn
library(ggplot2) #ggplot libraryの読み込み
d <- combn(colnames(iris[1:4]), 2) # iris combn#カラム行の名前を取り出すことと、combnで組み合わせ
pdf(file="scatterplot_iris_combn.pdf", paper="a4r", width=11.6,height=8.2)
for (i in 1:6){
  p <- ggplot(iris, aes(x=iris[,d[1,i]], y=iris[,d[2,i]], col= Species)) +
    geom_point(size = 6.5, alpha= 0.3) +
    xlab(d[1,i]) + ylab(d[2,i])+
    ggtitle(paste("x-axis:", d[1,i], "VS  y-axis:", d[2,i], "(page",i,"/6)"  ) )
  print(p)
}
dev.off()
できあがり
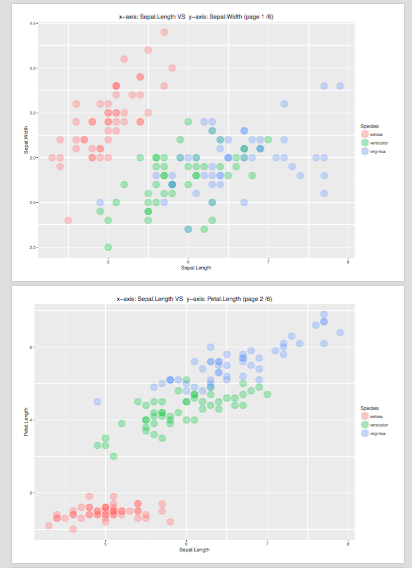
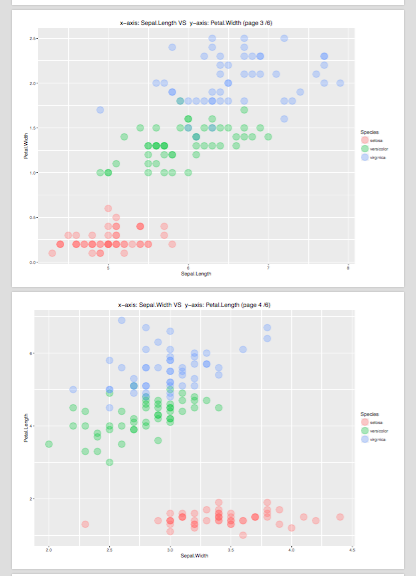
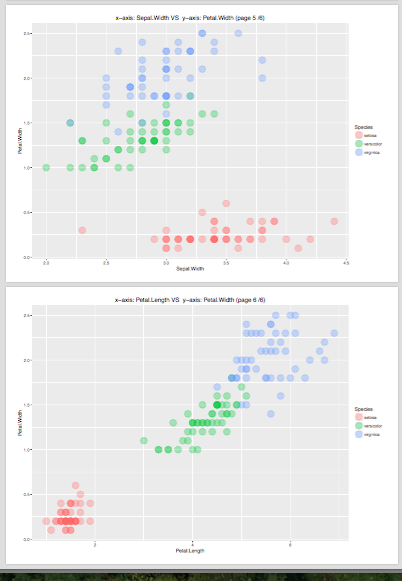
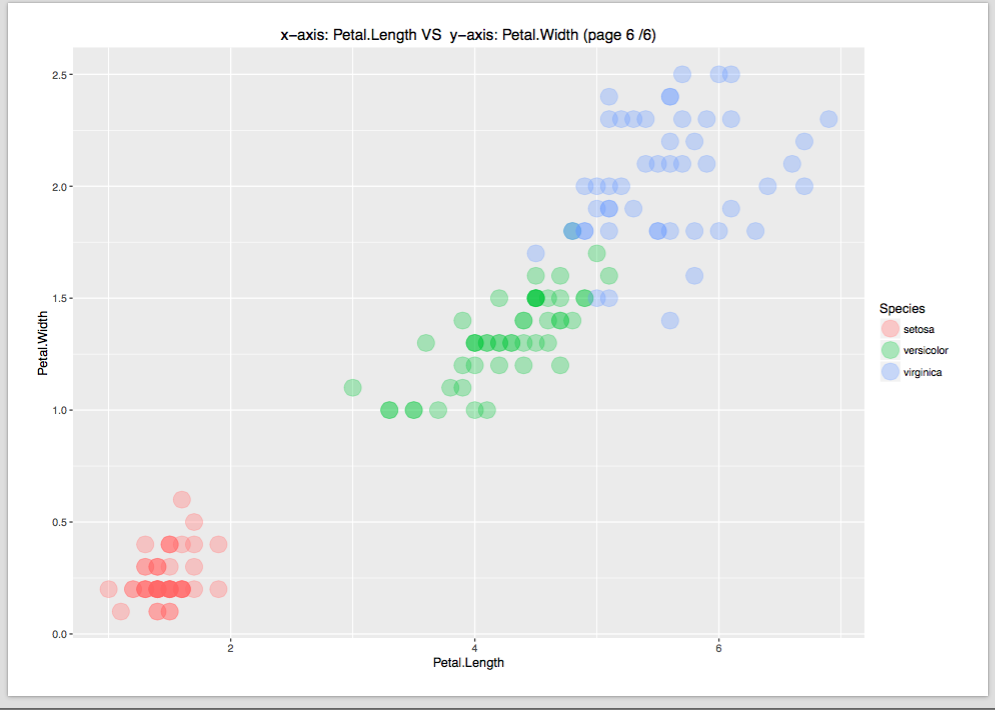
スクリーンショットを上げます。
(薄くてゴメンナサイ><)
1, 2 ページ目

簡単な説明(combnで操作した変数について)
d <- combn(colnames(iris[1:4]), 2)
dはcombn関数によって生成された行列です。
ggplot(iris, aes(x=iris[,d[1,i]], y=iris[,d[2,i]], col= Species))
では、ベクトルを入れ子にしています。
このグラフを描くにあたって欲しかった(x,y)のペアは、次の6種類です。
(iris[,1],iris[,2]) (iris[,2],iris[,3])
(iris[,1],iris[,3]) (iris[,2],iris[,4])
(iris[,1],iris[,4]) (iris[,3],iris[,4])
列名で書くならば、
(iris[,"Sepal.Length"], iris[,"Sepal.Width"])
(iris[,"Sepal.Length"], iris[,"Petal.Length"])
・・・(略)---
(iris[,"Petal.Length"], iris[,"Petal.Width"])
です。
これらは、高校数学のコンビネーション、組み合わせのCの記号にあたるによって表記できますよね。
そこでcombnというものを使いました。次のサイトを参照しました。
Rで階乗・順列・組み合わせを計算する
combn関数を利用して相関係数を求めた記事があります。
combn関数での利用の結果の詳細は、順番が前後するのですが、次の記事を御覧ください。
Rで、多量の相関係数を求めて、相関係数の値の絶対値を求めるところまで。(説明と実行結果)
簡単な説明(geom_pointについて)
また、
geom_point(size = 6.5, alpha= 0.3)
の部分は、irisデータでは、2個以上に同じ(x,y)の組があり、重なっている点があるようなので、alphaで、半透明度を0.3にしました。図で見ると、色の濃い部分が重なり合っているところです。
簡単な説明(ラベルやタイトルについて)
xlab(d[1,i]) + ylab(d[2,i])
x軸のラベル、y軸のラベルを設定します。
d <- combn(colnames(iris[1:4]), 2)
としていますので、カラム名を出せます。
ggtitle(paste("x-axis:", d[1,i], "VS y-axis:", d[2,i], "(page",i,"/6)" ) )
1ページごとに、グラフの内容が変わるように、描いています。
ggtitleで、何が来ているかは、x軸のラベル、y軸のラベルを設定と同じように行います。
こんな感じです。
動作環境
環境は、Mac 10.10.5, R 3.23, Rstudio 0.99.840
でしたっ。
ggplotとforループについて、参考となる記事です。
ggplot2でplot()的な複数グラフ表示とその闇
ggplot2でforループを使ったplot()的な複数プロットするとき…


