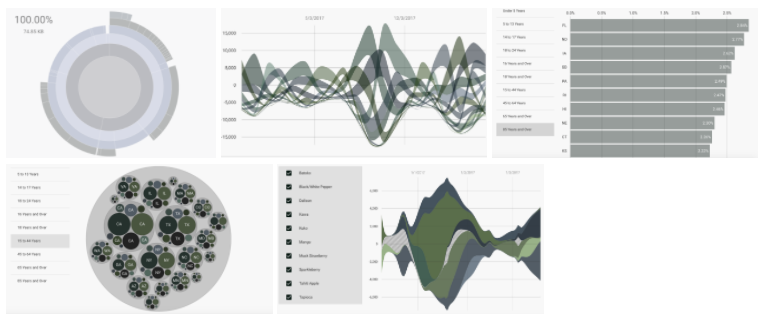
先日2.0がリリースされたこともあり、React-Moveを試してみました。
はじめに
React-MoveはReactでデータ駆動によるHTMLやSVGのアニメーションを行うツールです。
D3のようにグラフを作ることができて、状態変化のアニメーションが柔軟にカスタマイズできるような感じです。
例えばComponentのstateとSVGの属性などを紐付けて、動的かつスムーズにアニメーションすることができます。
アニメーションにはstart、enter、update、leaveとデータの動きに合わせて処理を行うことができます。
またd3-interpolateの便利機能も利用することが可能です。
上記以外にも軽量とかReact-Nativeでも利用できるなど、詳細はReact-MoveのFeaturesをご確認ください。
※補足としてReact-Move2.0にてResonance(react-d3-transitions)が統合されました。
機能の概要
NodeGroup
React-MoveのキモとなるNodeGroupコンポーネントです。
プロパティに描画するデータとTransitions(start、enter、update、leave)をセットします。
NodeGroupコンポーネントのinnerで、プロパティにセットしたデータ毎の描画要素を記述します。
※以下コードのプロパティとinnerの関数は必須です。
<NodeGroup
  data={this.state.data}

  keyAccessor={(d) => d.name}

  start={(data, index) => ({
    ...
  })}
>
  {(nodes) => (
    ...
      {nodes.map(({ key, data, state }) => {
        ...
      })}
    ...
  )}
</NodeGroup>
Transitions
start、enterプロパティなど所定の状態変化に対して関数形式で記述します。
ここでは移動値、色、サイズなどのスタイルをオブジェクトで返します。
後述しますが、duration, delay, easingなどはTimingを利用し、個別イベントをEventsで指定できます。
※もしトランジション中にデータが変更された場合、内部ではきちんと最終的な値を保持します。
// start - starting state of the node. Just return an object.
start={(data, index) => ({
  opacity: 1e-6,
  x: 1e-6,
  fill: 'green',
  width: scale.bandwidth(),
})}

// enter - return an object or array of objects describing how to transform the state.
enter={(data, index) => ({
  opacity: [0.5], // transition opacity on enter
  x: [scale(data.name)], // transition x on on enter
  timing: { duration: 1500 }, // timing for transitions
})}
Timing
基本的にはデフォルトが適用され、上書きしたい項目のみ指定することが可能です。
以下がデフォルト値となります。
const defaultTiming = {
  delay: 0,
  duration: 250,
  ease: easeLinear,
};
また以下の様に複数のオブジェクトを指定することも可能です。
enter={(data, index) => ([
  {
    opacity: [0.5],
    timing: { duration: 1000 },
  },
  {
    x: [scale(data.name)],
    timing: { delay: 750, duration: 1500, ease: easeQuadInOut },
  },
])}
Events
イベントはD3と同じで、Transitionのstart、interrupt、endの処理が記述できます。
update={(data) => ({
  opacity: [0.5],
  width: [scale.bandwidth()],
  timing: { duration: 1500, ease: easeQuadInOut },
  events: {
    start() {
      console.log('start!', data, this);
    },
    interrupt() {
      console.log('interrupt!', data, this);
    },
    end() {
      console.log('end!', data, this);
      this.setState({ fill: 'tomato' });
    },
  },
})}
公式サンプル
公式サンプルのソースを少し解説します。
import句および定数宣言
D3関連のモジュールについて、rangeは後でダミーデータ作成時に利用しています。
scaleLinearを利用して画面の横幅に合わせたスケールオブジェクトを作成します。
これは後述のマウス移動時のX座標に合わせて円図形の背景色を識別します。
import React from "react";
import { render } from "react-dom";
import { range } from "d3-array";
import { scaleLinear, interpolateInferno } from "d3-scale";
import "./demo.css";

// React-Move 2.0
import { easeElastic } from "d3-ease";
import { NodeGroup } from "react-move";

// A scale for changing the color
const linear = scaleLinear().domain([0, window.innerWidth]);
コンポーネントの初期設定およびイベントハンドラ処理
this.state = { x: 250, y: 300 }をデフォルト設定としてマウスの移動でstateを更新します。
マウスイベント内でコンテキストが変わってしまうため、constructorでbindしています。
class Example extends React.Component {
  constructor(props) {
    super(props);
    this.state = { x: 250, y: 300 };

    this.handleMouseMove = this.handleMouseMove.bind(this);
    this.handleTouchMove = this.handleTouchMove.bind(this);
  }

  componentDidMount() {
    // Track mouse/touch movement
    window.addEventListener("mousemove", this.handleMouseMove);
    window.addEventListener("touchmove", this.handleTouchMove);
  }

  handleMouseMove({ pageX: x, pageY: y }) {
    // Update the state with cursor position
    this.setState({ x, y });
  }

  handleTouchMove({ touches }) {
    // Update the state with touch position
    this.handleMouseMove(touches[0]);
  }
NodeGroupコンポーネントのプロパティ
dataにはrangeを利用して6件のデータをセットしx,yにはstateの値を紐付けます。
keyAccessor={d => d.key} で受け取ったデータのキーを戻す関数を用意します。
これは内部でどのデータが入ってくるか確認するために利用します。
startでは開始位置を指定し、update(マスポインタの移動)では更新後の位置にtimingを利用して移動します。
以下では先頭データから順に0.12秒後に1.3秒かけてeaseElasticの動きで移動します。
  render() {
    return (
      // React-Move!
      <NodeGroup
        data={range(6).map(d => {
          return {
            key: `key-${d}`,
            x: this.state.x,
            y: this.state.y
          };
        })}
        keyAccessor={d => d.key}
        start={data => {
          return { x: data.x, y: data.y };
        }}
        update={(data, index) => {
          return {
            x: [data.x],
            y: [data.y],
            timing: {
              delay: index * 120,
              duration: 1300,
              ease: easeElastic
            }
          };
        }}
      >
NodeGroupコンポーネントの中身
データ1件ずつに対して<div>を用意し、スタイルで円図形にして描画を行います
D3のinterpolateInfernoカラーテーマを利用して、x座標に紐づくカラーコードで円図形を描画します。
translate3dでは円の中心がマウスポインタの位置になるように調整しています。
<div>でpositionは指定していないため順番に並んで表示されます。
zIndexでは移動中の重なりを制御しています。
        {nodes => {
          // Just a function!
          return (
            <div>
              {nodes.map((node, index) => {
                const { x, y } = node.state;

                return (
                  <div
                    key={node.key}
                    style={{
                      backgroundColor: interpolateInferno(linear(x)),
                      width: 50,
                      height: 50,
                      borderRadius: 25,
                      opacity: 0.7,
                      WebkitTransform: `translate3d(${x - 25}px, ${y -
                        25}px, 0)`,
                      transform: `translate3d(${x - 25}px, ${y - 25}px, 0)`,
                      zIndex: nodes.length - index + 5000
                    }}
                  />
                );
              })}
            </div>
          );
        }}
      </NodeGroup>
    );
  }
}

render(<Example />, document.getElementById("root"));

