はじめに
イベントハウスにパイプラインからアクティビティの出力を記録する方法を記載します。
準備
-
Microsoft Fabric でパイプラインを使用してデータを取り込む を参考にデータを取り込むパイプラインを作成します。
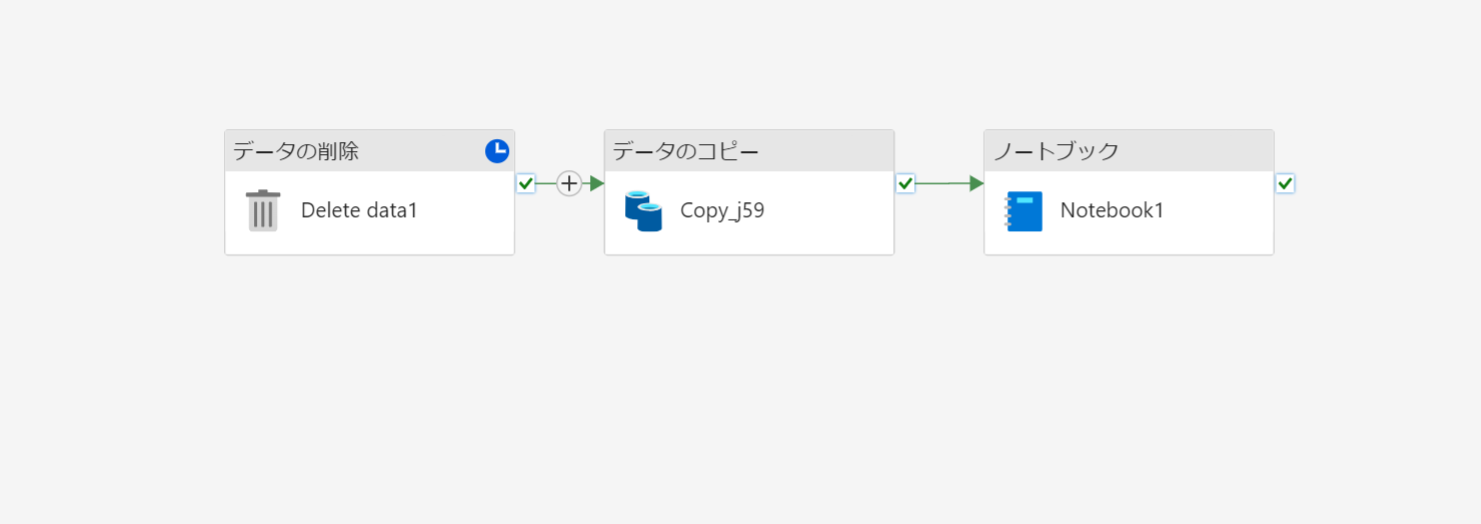
-
ノートブックの最後には 終了で結果を返すようにしておきます。
pysparkimport json count = df.count() # ノートブックの実行結果を返す result = { "df_count" : count, } result_str=json.dumps(result) mssparkutils.notebook.exit(result_str)
手順
-
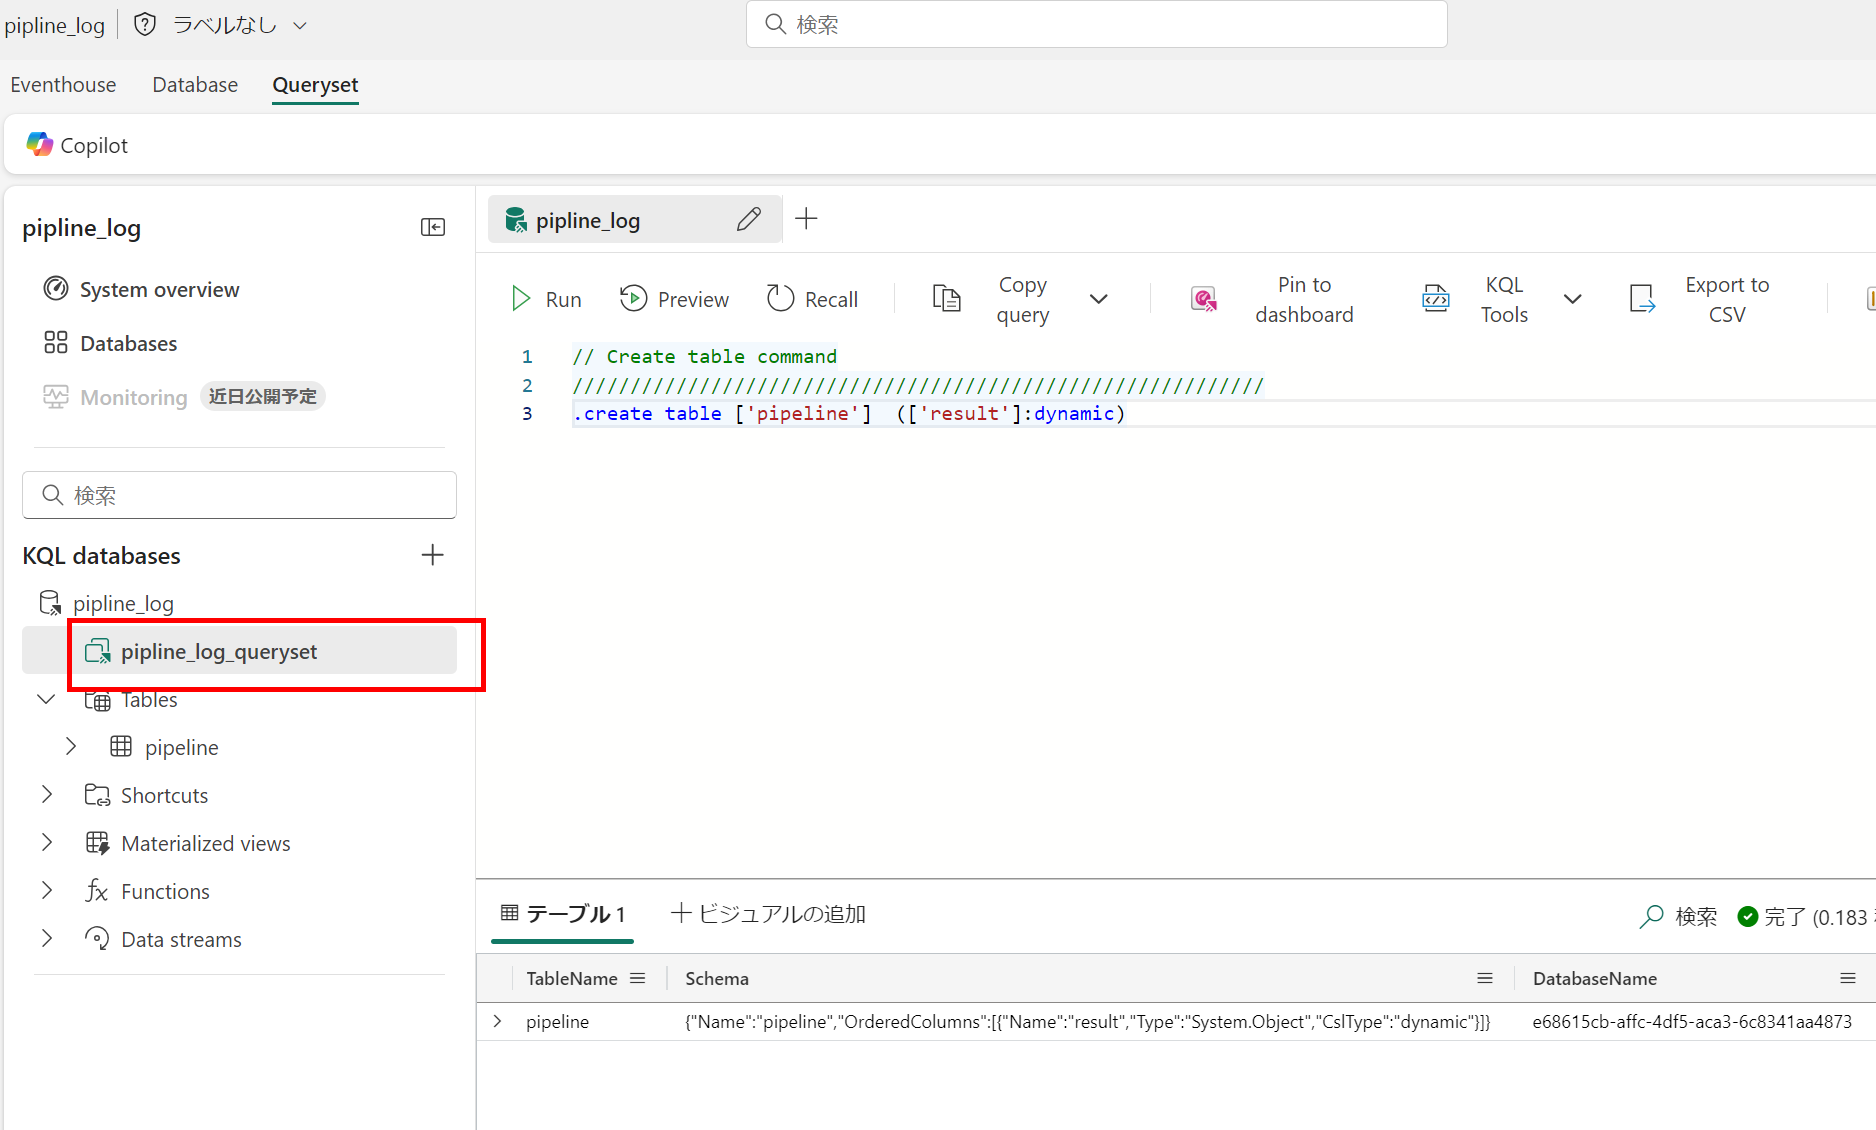
KQL データベース上で、テーブルを作成します。
KQL// Create table command //////////////////////////////////////////////////////////// .create table ['pipeline'] (['result']:dynamic) -
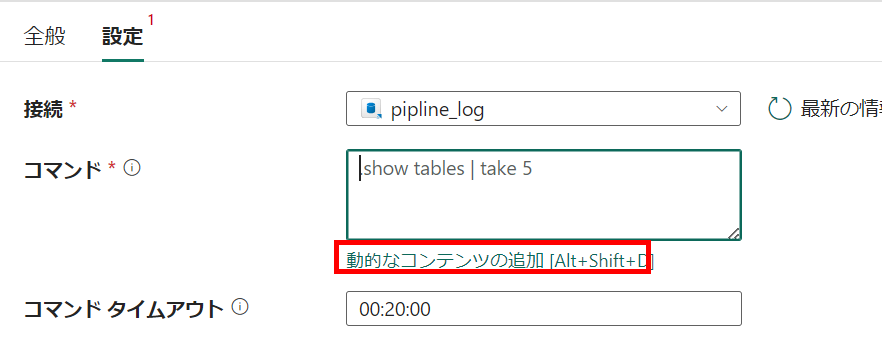
動的なコンテンツに以下を入力します。
pipeline式@concat(' .ingest inline into table pipeline with (format = "json") <| {"result":{' ,' "workspaceId":"',pipeline().DataFactory,'"' ,',"pipelineId":"',pipeline().Pipeline,'"' ,',"pipelineRunId":"',pipeline().RunId,'"' ,',"pipelineTriggerTime":"',pipeline().TriggerTime,'"' ,',"pipelineEndTime":"',utcNow(),'"' ,',"status":"success"' ,',"activities":[' ,' {"name":"<アクティビティ名を入れる>"' ,',"result":',,'}' ,']}}' ) -
入力したい出力をもつアクティビティを追加します。
-
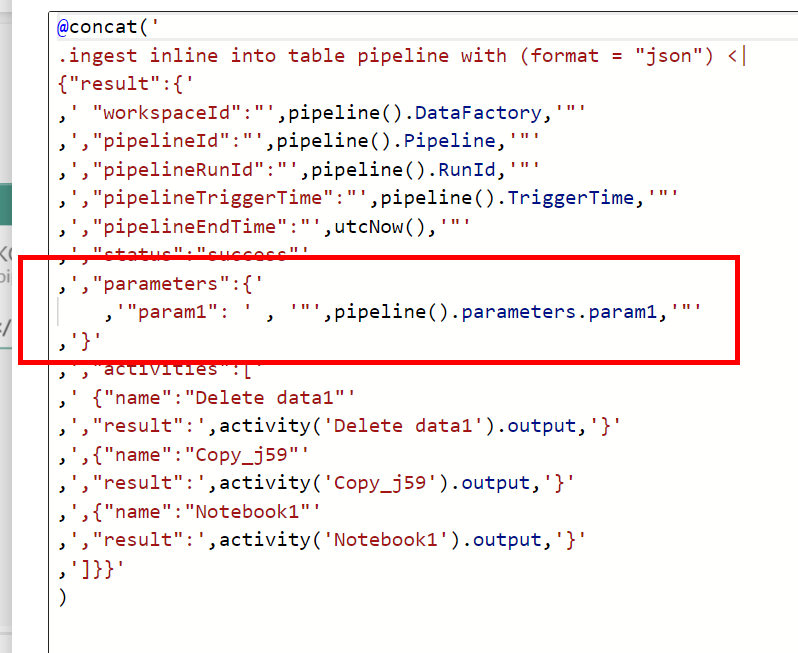
複数入れる場合は、カンマの数などに注意して追加していきます。以下のようになりました。(activities 先頭のオブジェクトだけカンマ無し、後はあり。)

-
実行し、成功すると、KQL データベース上のテーブルに結果が格納されます。
kql// Use 'take' to view a sample number of records in the table and check the data. pipeline | take 100 -
KQL例
kqlpipeline | project pipelineTriggerTime = todatetime(result.pipelineTriggerTime) ,pipelineRunId = tostring(result.pipelineRunId) ,duration = bin(todatetime(result.pipelineEndTime)-todatetime(result.pipelineTriggerTime),1s) ,status = tostring(result.status) ,delete_result = result.activities[0].result ,copy_result = result.activities[1].result ,notebook_result = result.activities[2].result ,url = strcat('https://app.powerbi.com/workloads/data-pipeline/monitoring/workspaces/',result.workspaceId,'/pipelines/',result.pipelineId,'/',result.pipelineRunId) | order by ingestion_time()desc -
KQL を基にダッシュボード化することも可能です。この例では URL を作りこんでいるので、直接監視ハブに遷移可能です。


