mpl_toolkitsのmplot3d.Axes3Dの警告を消す方法についてまとめてみた。
まずはimport
%matplotlib inline
import matplotlib.pyplot as plt
from mpl_toolkits import mplot3d
import numpy as np
バージョンは
import matplotlib as mpl
mpl.__version__
# '3.5.2'
やりたいこと
Axes3Dは三次元座標を生成する為のクラスである。
ただよく見るのは、
fig = plt.figure()
ax = plt.axes(projection="3d")
fig = plt.figure()
mplot3d.Axes3D(fig)
となっていたりする。これでもちゃんと上の画像のような結果は出るのだが、DeprecationWarningも出るので、これを消したい。
やってみたこと
それで、警告の内容は
MatplotlibDeprecationWarning:
Axes3D(fig) adding itself to the figure is deprecated since 3.4. Pass the keyword argument auto_add_to_figure=False and use fig.add_axes(ax) to suppress this warning. The default value of auto_add_to_figure will change to False in mpl3.5 and True values will no longer work in 3.6. This is consistent with other Axes classes.
このままではまるで意味がわからないので訳すと、
Axes3D(fig) が自分自身を図に加えることは、3.4 から非推奨になりました。キーワード引数 auto_add_to_figure=False を渡して fig.add_axes(ax) を使用すると、この警告を抑制することができます。auto_add_to_figure のデフォルト値は mpl3.5 で False に変わり、3.6 では True 値は動作しなくなります。 これは、他のAxesクラスと一貫しています。
とのことなので言われた通りにやってみる。
fig = plt.figure()
ax = mplot3d.Axes3D(fig, auto_add_to_figure=False)
fig.add_axes(ax)
Axes3Dの引数を使ってみる
このままではコードが一行無駄に増えただけなので、Axes3Dの引数を使って元を取りたい。
mplot3d.Axes3Dの引数にはazim(方位角)とelev(仰角)があって視点の変更ができるようなので、やってみる。
デフォルトではazim=-60, elev=30
x = y = np.linspace(-3, 3, 1000)
X, Y = np.meshgrid(x, y)
Z = (X ** 2 - Y ** 2) / 2

fig = plt.figure(figsize=(8, 6))
ax = mplot3d.Axes3D(fig, auto_add_to_figure=False)
fig.add_axes(ax)

ax.plot_surface(X, Y, Z)
ax.set_title("azim=-60, elev=30", fontsize="xx-large");
fig = plt.figure(figsize=(8, 6))
ax = mplot3d.Axes3D(fig, azim=-90, elev=0, auto_add_to_figure=False)
fig.add_axes(ax)

ax.plot_surface(X, Y, Z)
ax.set_title("azim=-90, elev=0", fontsize="xx-large");
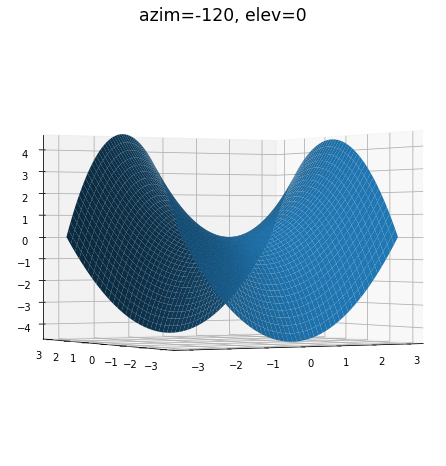
fig = plt.figure(figsize=(8, 6))
ax = mplot3d.Axes3D(fig, azim=-120, elev=0, auto_add_to_figure=False)
fig.add_axes(ax)

ax.plot_surface(X, Y, Z)
ax.set_title("azim=-120, elev=0", fontsize="xx-large");
まとめ
Axes3Dで方位角と仰角を指定したりしなくても、コマンドライン上で実行したり、
%matplotlib notebookを指定すれば、画像をグリグリ動かせる。


