概要
IntelliJ IDEAのStream DebuggerというStream APIのデータの流れを可視化してくれるプラグインがありましたので使用してみました。
環境
- Windows10 Professional
- Java 1.8.0_144
- IntelliJ IDEA Ultimate 2017.2
- Java Stream Debugger 0.1.4
参考
- [Java Stream Debugger] (https://plugins.jetbrains.com/plugin/9696-java-stream-debugger)
Java Stream Debugger
Want an easy way to debug chains of Java 8’ Stream API calls? Try IntelliJ IDEA with http://ow.ly/jT9w30bEY9i
— IntelliJ IDEA @intellijidea 2017年5月12日
使い方
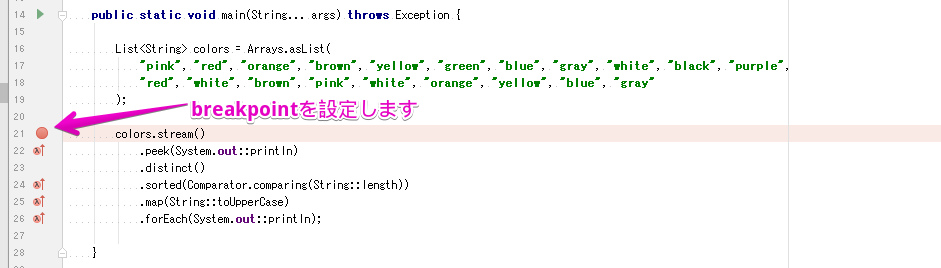
デバッグしたいstreamにブレークポイントを設定しdebugモードで実行します。
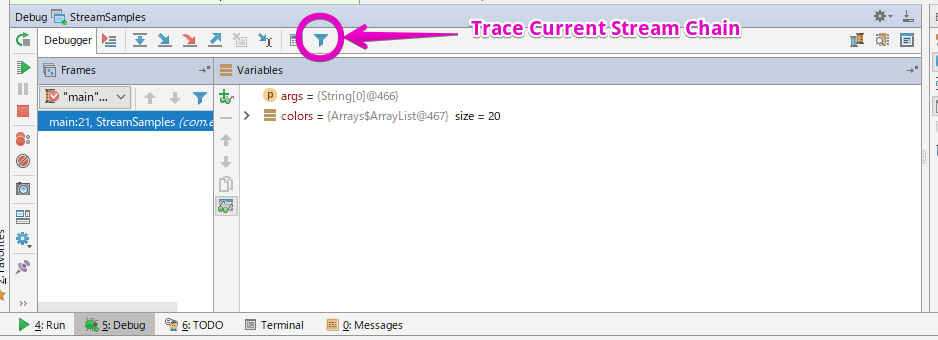
Debugパネルに"Trace Current Stream Chain"というアイコンが追加されているのでクリックします。
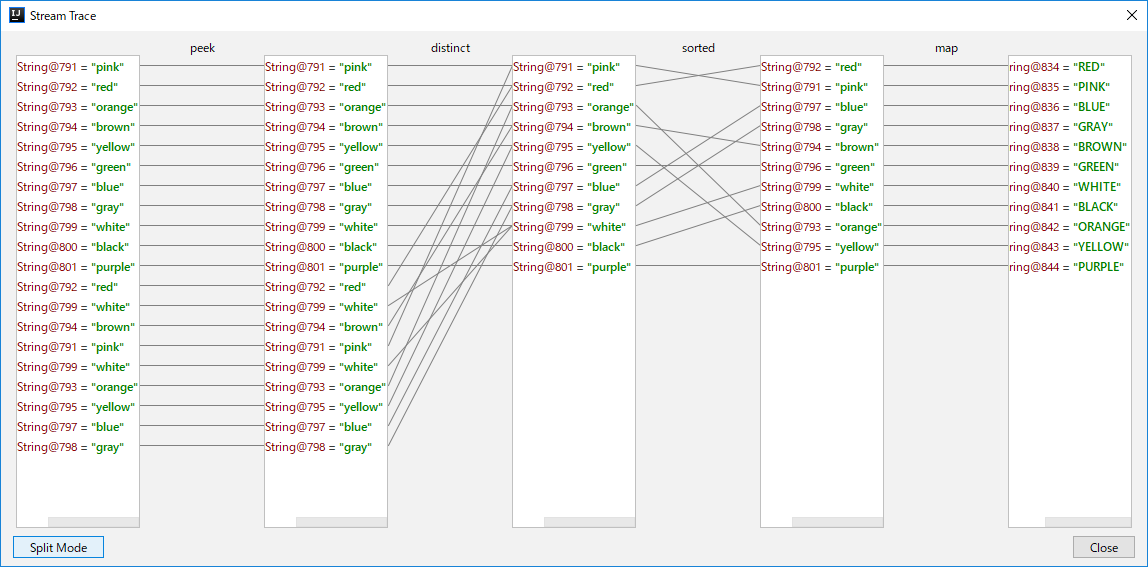
Stream Trace画面が立ち上がりデータの流れが確認できます。(データ量などによっては表示に時間がかかる場合があります)
表示モードには"Flat Mode"と"Split Mode"があり、画面下のボタンで切り替えができます。
下図は"Flat Mode"です。
List<String> colors = Arrays.asList(
    "pink", "red", "orange", "brown", "yellow", "green", "blue", "gray", "white", "black", "purple",
    "red", "white", "brown", "pink", "white", "orange", "yellow", "blue", "gray"
);

colors.stream()
    .peek(System.out::println)
    .distinct()
    .sorted(Comparator.comparing(String::length))
    .map(String::toUpperCase)
    .forEach(System.out::println);
この図のように中間処理でどのようにデータが扱われているか画面で確認することができます。
インストール
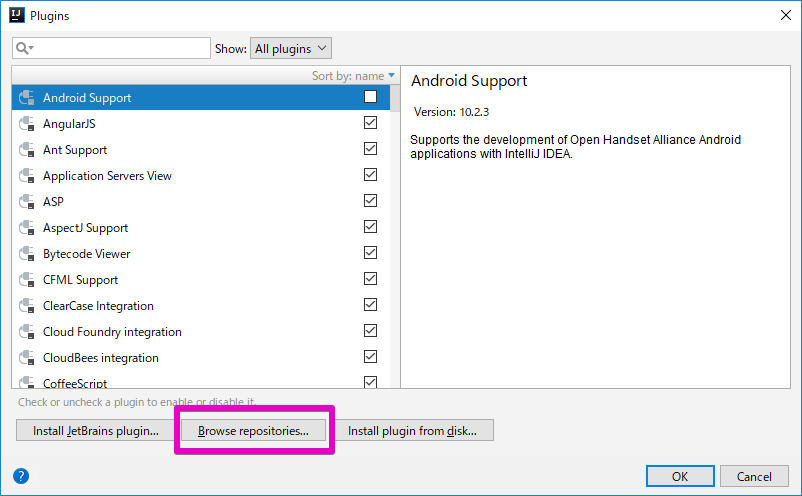
Pluginsを開き、画面下の【Browse Repositories...】ボタンをクリックします。
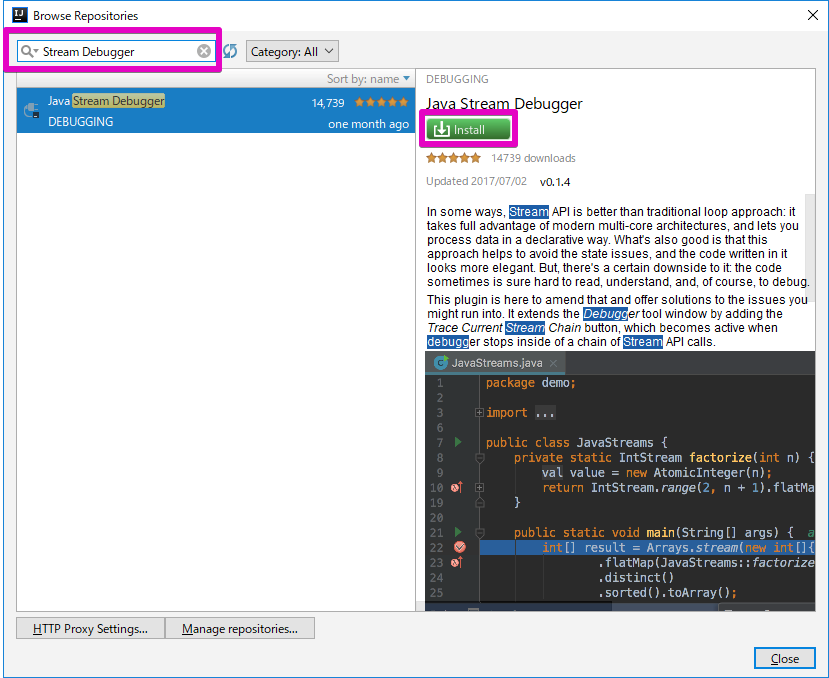
検索フィールドに"Stream Debugger"と入力してPluginを絞り込みます。
Stream Debuggerが見つかったら、Installボタンをクリックしてインストールします。
インストールできたらRestartします。
[Kotlin Sequence Debugger] (https://plugins.jetbrains.com/plugin/10301-kotlin-sequence-debugger)
A Kotlin extension for Java Stream Debugger plugin.
Stream DebuggerのKotlin拡張pluginもあります。
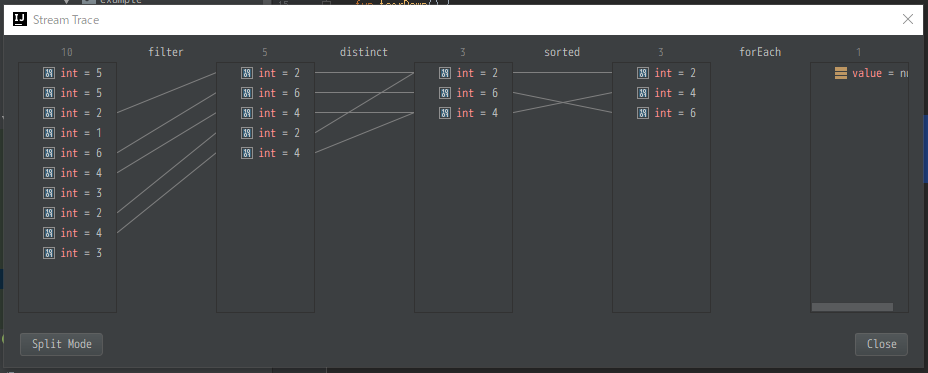
使い方は同じでデバッグしたいSequenceにブレークポイントを付けてdebugモードで実行し、Debugパネルの"Trace Current Stream Chain"アイコンをクリックします。
listOf(5, 5, 2, 1, 6, 4, 3, 2, 4, 3).asSequence()
    .filter { it % 2 == 0 }
    .distinct()
    .sorted()
    .forEach { println(it) }