lightweight-chartとは
lightweight-chartとは、TradingView社が提供するチャートライブラリです。
ローソク足チャートとか描きたいけど、自分で実装すると面倒だしクオリティーも...という方におすすめです。
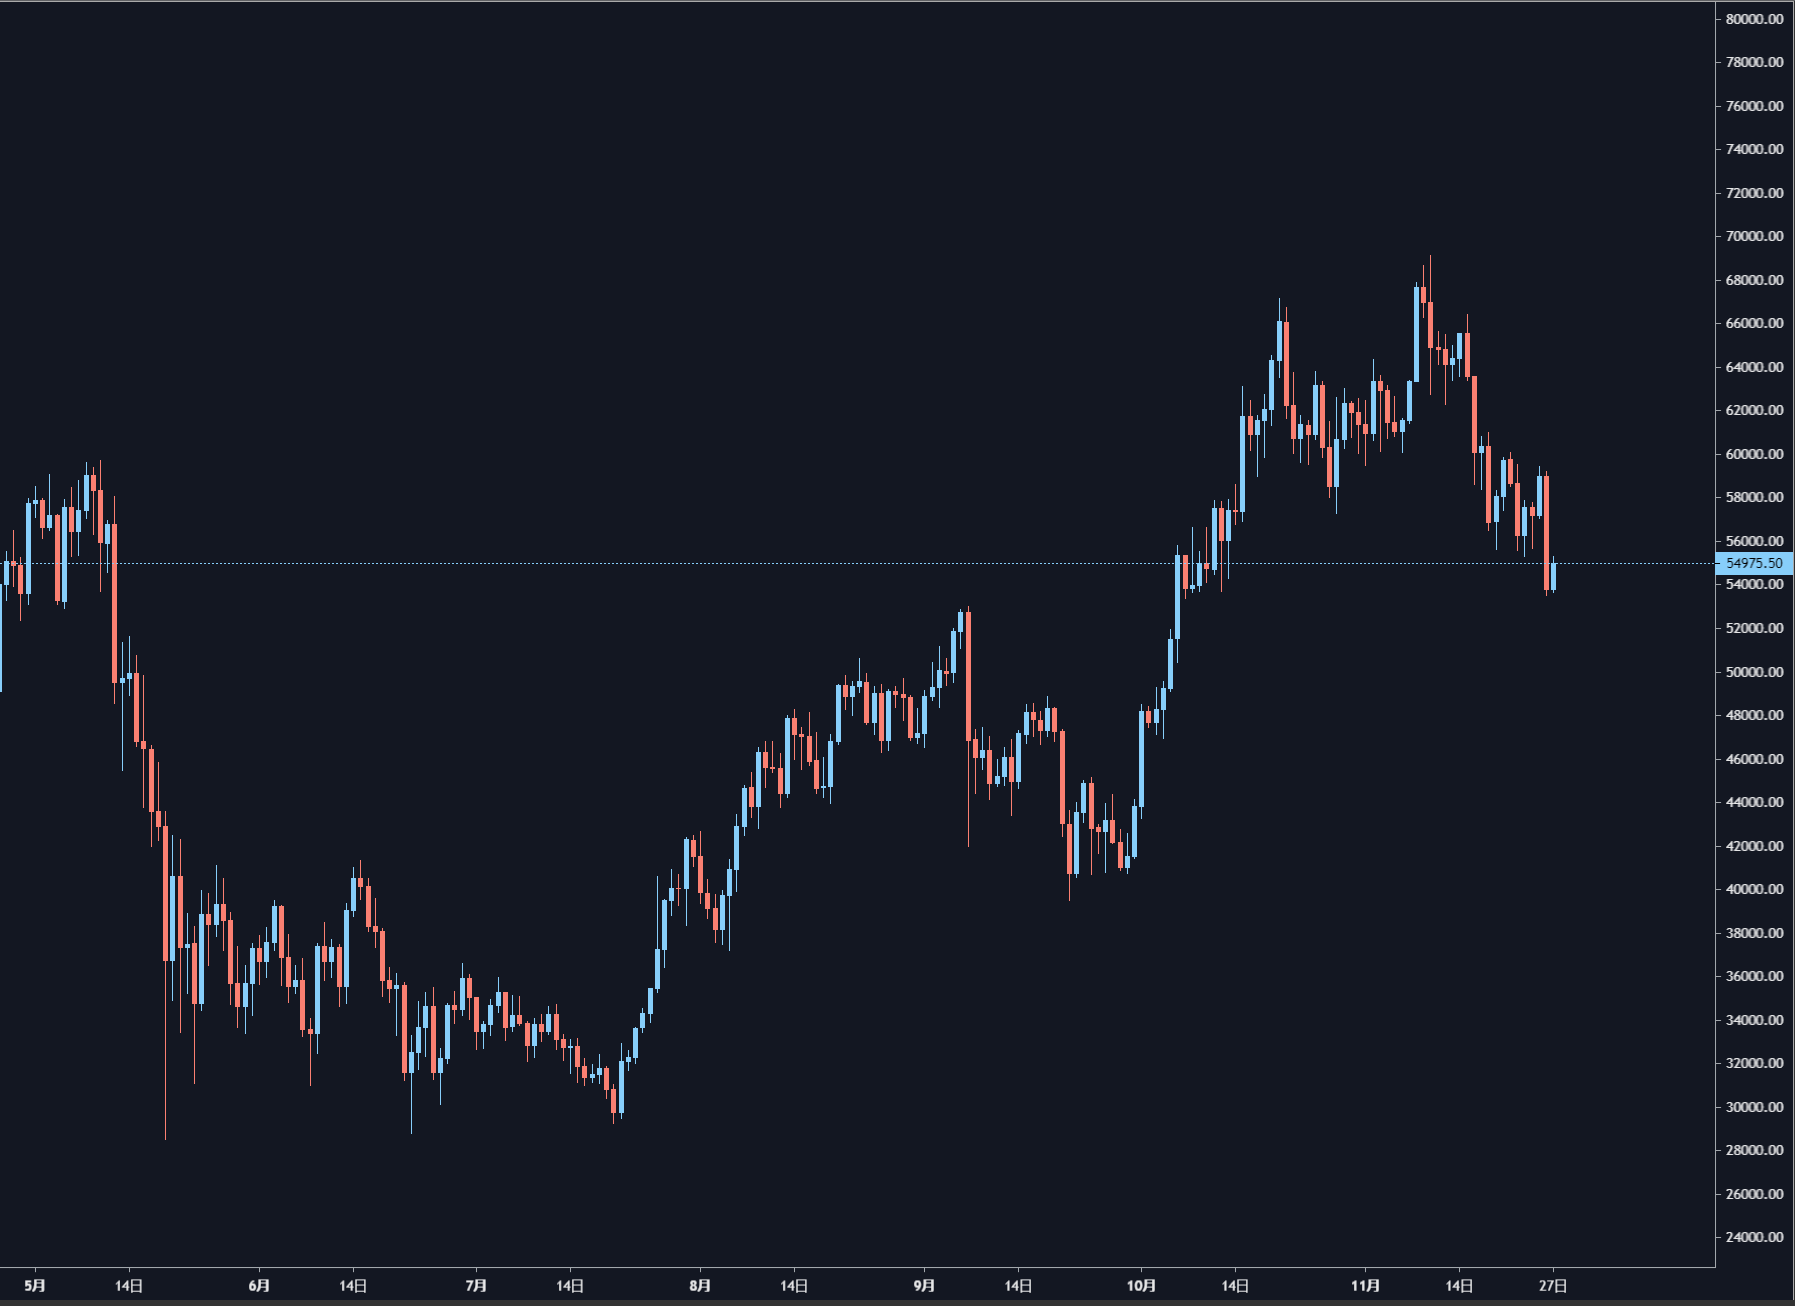
大体下の画像のような感じで使えます。TradingViewのサイトではトレンドラインとか引けるんですが、lightweight-chartは軽量版という事でチャートの描画のみが可能です。
(一応申請すればすべての機能がついてるライブラリが使えるみたいですが...)
ライブラリ等のリンクは以下から参照してください。
https://jp.tradingview.com/lightweight-charts/
https://github.com/tradingview/lightweight-charts
基本的な使い方
インストール
インストールにはnpmを用いる方法とCDN(unpkg)を用いる2通りの方法があります。
ここでは(楽なので)CDNを用いる方法でやります。
<!DOCTYPE html>
<html>
    <head>
        <title>installing lightweight-chart</title>
    </head>
    <body>
        <script src="https://unpkg.com/lightweight-charts/dist/lightweight-charts.standalone.production.js"></script>
        <script type="text/javascript" src="./index.js"></script>
    </body>
</html>
チャートを表示しよう
lightweight-chartではラインチャート, バーチャート, ローソク足チャート, ヒストグラムなどが使えます。
ここではローソク足チャートの表示方法を解説します。
var chart = LightweightCharts.createChart(document.body, {
    width: 400,
    height: 300,
	layout: {
		backgroundColor: '#131722',
		textColor: 'rgba(255, 255, 255, 0.9)',
	},
	grid: {
		vertLines: {
			color: 'rgba(197, 203, 206, 0)',
		},
		horzLines: {
			color: 'rgba(197, 203, 206, 0)',
		},
	},
	crosshair: {
		mode: LightweightCharts.CrosshairMode.Normal,
	},
	rightPriceScale: {
		borderColor: 'rgba(197, 203, 206, 0.8)',
	},
	timeScale: {
		borderColor: 'rgba(197, 203, 206, 0.8)',
		timeVisible: true,                                 //5分足とか表示したい人はtrueにしてください
        secondsVisible: false,                             //秒足を使いたい人はtrueに
	},
});

//ローソク足に関する設定
var candleSeries = chart.addCandlestickSeries({
  upColor: '#87cefa',
  downColor: '#fa8072',
  borderDownColor: '#fa8072',
  borderUpColor: '#87cefa',
  wickDownColor: '#fa8072',
  wickUpColor: '#87cefa',
});

//チャートの描画はOHLCとタイムスタンプ(秒単位)を指定して行います
//OHLC+Tのデータは連想配列の形式で指定します
//例: {time: 1534204800, open: 6035, high: 6213, low: 5968, close: 6193}
//githubの例だと時間の指定が'2019-04-11'となっていますが、タイムスタンプの方が便利かと思います
candleSeries.setData([
  {time: 1534204800, open: 6035, high: 6213, low: 5968, close: 6193},
  {time: 1534291200, open: 6187.5, high: 6620.5, low: 6176, close: 6264.5},
  {time: 1534377600, open: 6264, high: 6474, low: 6207.5, close: 6315},
  {time: 1534464000, open: 6315, high: 6588.5, low: 6290.5, close: 6575.5},
  {time: 1534550400, open: 6582, high: 6612.5, low: 6297, close: 6388},
  {time: 1534636800, open: 6387.5, high: 6535.5, low: 6304.5, close: 6490.5},
  {time: 1534723200, open: 6487, high: 6517, low: 6210, close: 6246.5},
  {time: 1534809600, open: 6245, high: 6497, low: 6235.5, close: 6461.5},
  {time: 1534896000, open: 6466, high: 6890.5, low: 6230.5, close: 6344.5},
  {time: 1534982400, open: 6348.5, high: 6570.5, low: 6336.5, close: 6521.5},
  {time: 1535068800, open: 6521.5, high: 6726, low: 6446, close: 6706.5}
]);
ここまでで、下の画像のようなチャートが出来上がります。

リアルタイムチャート
上の例だと、データを読み込んだきりチャートが更新されません。
この記事にたどり着いてしまった方の半分くらいは外部のAPIと連携してリアルタイムでチャートを表示したいのではないかと思います。
まあ、リアルタイムで表示と言っても特に難しいことをするわけではありません。
OHLC+Tをどこかに保持しておいて、新しいデータがやってくる度にOHLC+Tを更新してsetData関数を呼び出すだけです。
class Chart{
  constructor(resolution){
    this.opens = new Array();
    this.highs = new Array();
    this.lows = new Array();
    this.closes = new Array();
    this.ticks = new Array();  //time = timestamp
    this.resolution = resoltion;
  }

  //外部APIなどから取ってきた過去のチャートデータを入れる
  //ohlc+t = array, t = timestamp(sec)
  setNewChartData = function(o, h, l, c, t){
    for(let i = 0; i < this.opens.length; i++){
      this.opens.push(o[i]);
      this.highs.push(h[i]);
      this.lows.push(l[i]);
      this.closes.push(c[i]);
      this.ticks.push(t[i]);
    }
  }

  //現在のデータ(TradingView形式)を取得する
  getTradingViewData = function(){
    let data = new Array(this.opens.length);
    for(let i = 0; i < this.opens.length; i++){
      let candle =  {
        time: this.ticks[i],
        open: this.opens[i],
        high: this.highs[i],
        low: this.lows[i],
        close: this.closes[i],
      };
      data[i] = candle;
    }
    return data;
  }

  //一番新しい足のデータを更新する
  updateCurrentCandle = function(tradedPrice){
    let li = this.ticks.length-1;  // = last index
    this.closes[li] = tradedPrice;
    if(tradedPrice > this.highs[li]){
      this.highs[li] = tradedPrice;
    }else if(tradedPrice < this.lows[li]){
      this.lows[li] = tradedPrice;
    }
  }

  //次の足を生成する
  //nextTick = timestamp(sec)
  setNextCandle = function(tradedPrice, nextTick){
    this.opens.push(tradedPrice);
    this.highs.push(tradedPrice);
    this.lows.push(tradedPrice);
    this.closes.push(tradedPrice);
    this.ticks.push(nextTick);
  }

  //現在のチャートを表示する
  showCurrentChart = function(candleSeries){
    let data = this.getTradingViewData();
    candleSeries.setData(data);
  }
}
こんな感じでいいと思います(自分のプログラムから一部取ってきただけで動作確認はしてません)
あとがき
それにしても、このチャートかなり使いやすいにもかかわらず使ってる人が全然いないですね...
情報もあまりなくintradayのチャートを表示する方法を探すのにも苦労しました。
国内証券会社の変なチャートもこれに変えてくれたらなぁと思うんですが...まあ如何せんそういう訳には行かないのでしょう(残念)
私もこれを使ってちょっとしたものを作ってみました。
https://github.com/Nikkei225Futures/deribitWebsocketSample
(プログラミングが得意な訳ではないので、設計もコーディングもめちゃくちゃなのは内緒で())