背景
これまでsklearn 0.20等で混同行列を作成する場合には、confusion_matrix関数を使用していました。
sklearn 1.0では新たに追加されたplot_confusion_matrix関数がexampleに追加されています。
ただし、plot_confusion_matrixは引数にestimator, X_test, y_testを引数に取ります。
既に予測済みの結果がある場合には、少し無駄な処理に見えます。
また、Deprecatedに関するアナウンスも出ていることもあるため、あまり好んで使いたくありません。
予測済み結果から混同行列を作成する
ConfusionMatrixDisplay.from_predictions で作成できます。
import matplotlib.pyplot as plt
from sklearn.metrics import ConfusionMatrixDisplay

ConfusionMatrixDisplay.from_predictions(y_test, pred)
plt.show()
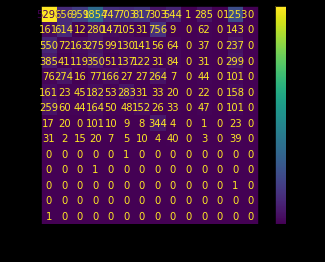
ただし、以下のように画像が小さくなってしまうことがあります。
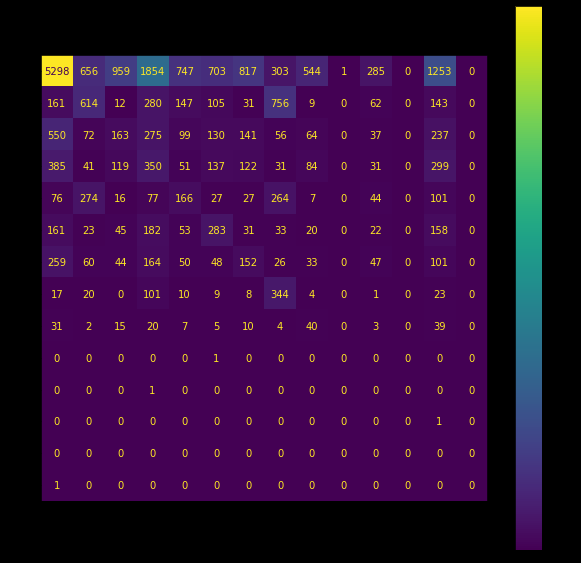
混同行列のサイズを変更する
plt.subplotsを使うことで変更できます。
import matplotlib.pyplot as plt
from sklearn.metrics import ConfusionMatrixDisplay

cmp = ConfusionMatrixDisplay.from_predictions(y_test, pred)
fig, ax = plt.subplots(figsize=(10,10))
cmp.plot(ax=ax)
従来通り配列作成のみsklearnを使う
confusion_matrix関数が使えます。
https://scikit-learn.org/stable/modules/generated/sklearn.metrics.confusion_matrix.html#sklearn.metrics.confusion_matrix