概要
lightgbmには特徴量の重要度を出すplot_importanceという関数がある。
sklearnでも特徴量の重要度を可視化したい、という気持ちになるのでやります。
ソースコード
みんな大好きirisデータセットを使っていきます。
from pprint import pprint

import numpy as np
import pandas as pd
import matplotlib.pyplot as plt
from sklearn.datasets import load_iris
from sklearn.linear_model import SGDClassifier

iris = load_iris()
irisの情報を見る
irisについてもう少し情報を得ましょう。
irisは3クラス、特徴量は4種類あることがわかります。
pprint(iris)
{'DESCR': '.. _iris_dataset:\n'
          '\n'
          'Iris plants dataset\n'
          '--------------------\n'
          '\n'
          '**Data Set Characteristics:**\n'
          '\n'
          '    :Number of Instances: 150 (50 in each of three classes)\n'
          '    :Number of Attributes: 4 numeric, predictive attributes and the '
          'class\n'
          '    :Attribute Information:\n'
          '        - sepal length in cm\n'
          '        - sepal width in cm\n'
          '        - petal length in cm\n'
          '        - petal width in cm\n'
          '        - class:\n'
          '                - Iris-Setosa\n'
          '                - Iris-Versicolour\n'
          '                - Iris-Virginica\n'
          '                \n'
          '    :Summary Statistics:\n'
          '\n'
          '    ============== ==== ==== ======= ===== ====================\n'
          '                    Min  Max   Mean    SD   Class Correlation\n'
          '    ============== ==== ==== ======= ===== ====================\n'
          '    sepal length:   4.3  7.9   5.84   0.83    0.7826\n'
          '    sepal width:    2.0  4.4   3.05   0.43   -0.4194\n'
          '    petal length:   1.0  6.9   3.76   1.76    0.9490  (high!)\n'
          '    petal width:    0.1  2.5   1.20   0.76    0.9565  (high!)\n'
          '    ============== ==== ==== ======= ===== ====================\n'
irisのデータを学習する
特徴の名前やデータを取得しておきましょう。
なにも考えずにfitします。
feature_names = iris.feature_names
data = iris.data
target = iris.target
target_names = iris.target_names

clf = SGDClassifier()
clf.fit(data, target)
重みを確認する
重みはcoef_を見ることでわかります。
shapeは(n_classes, n_features)になっています。
print(clf.coef_)

array([[  9.76085896,  30.74670571, -48.80429478, -27.33040508],
       [  9.51335529, -73.66752043,  28.90596414, -68.17904623],
       [-89.68307485, -84.96291301, 151.2699483 , 135.31130591]])
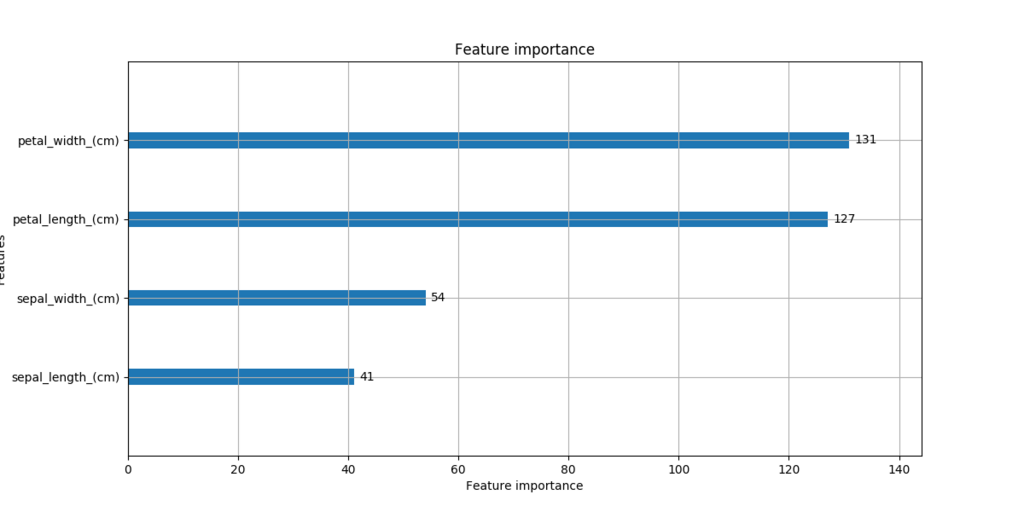
特徴量の重要度を描画する
ここまできたら後は描画するだけです。
出力結果は以下の画像です。
petal lengthとpetal widthが重要な変数であることがわかります。
これは、先ほどみたirisの情報の中でClass Correlationが高いと書かれていることからもわかると思います。
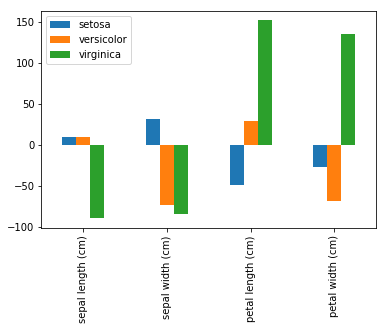
df = pd.DataFrame(clf.coef_.T, columns=target_names, index=name)

df.plot.bar()
まとめ
- coef_を見ることで特徴量の重要度がわかる
- pandasを使うと見やすく簡単に描画できる