初投稿です。
不備・マナー違反等あればコメントいただけると幸いです。
背景
個人開発でチャート描画できるようにしたいなとチャートライブラリを調べていたところ、@StathamさんのJavaScriptのチャートライブラリのデモまとめという記事に出会い、Google Chartsに興味を持ちました。
またGoogle Chartsには、(普段仕事で使いなれている)angular用にカスタマイズされたangular-google-chartsというライブラリがあるようなので、今回はこれを使ってサクッとグラフ描画しちゃいたいと思います。
環境
Angular Cli、Node.jsが導入されている前提で進めます。
versionは以下のとおりです。
> ng version

     _                      _                 ____ _     ___
    / \   _ __   __ _ _   _| | __ _ _ __     / ___| |   |_ _|
   / △ \ | '_ \ / _` | | | | |/ _` | '__|   | |   | |    | |
  / ___ \| | | | (_| | |_| | | (_| | |      | |___| |___ | |
 /_/   \_\_| |_|\__, |\__,_|_|\__,_|_|       \____|_____|___|
                |___/


Angular CLI: 8.3.26
Node: 10.16.1
OS: win32 x64
Angular: 8.2.14
...(省略
プロジェクトの作成
> ng new google-charts-sample
初期設定を色々と聞かれますが、今回はすべてdefaultで進めていきます。(Enter連打
完了したら作成したプロジェクトに移動してローカルで起動します。
> cd google-charts-sample
> npm start

(省略)
** Angular Live Development Server is listening on localhost:4200, open your browser on http://localhost:4200/ **
ローカルを開きAngularのデフォルトの画面表示ができれば成功です。
angular-google-chartsのinstall
> npm install angular-google-charts
import { GoogleChartsModule } from 'angular-google-charts'; //追加
(中略)
  imports: [
    ...,
    GoogleChartsModule // 追加
  ],
(中略)
チャート描画用コンポーネントの作成
今回はpie-chartを作成していきます。
> ng generate component pie-chart
pie-chartを表示するため、app.componentのhtmlを以下のように書き換えます。
<h1>{{ title }}</h1>

<app-pie-chart></app-pie-chart>
続いて、pie-chartのhtml、tsを編集していきます。
<google-chart [title]="title" [type]="type" [data]="data" [columns]="columnNames" [options]="options"></google-chart>
import { Component } from '@angular/core';
@Component({
selector: 'app-pie-chart',
templateUrl: './pie-chart.component.html',
styleUrls: ['./pie-chart.component.css']
})
export class PieChartComponent {
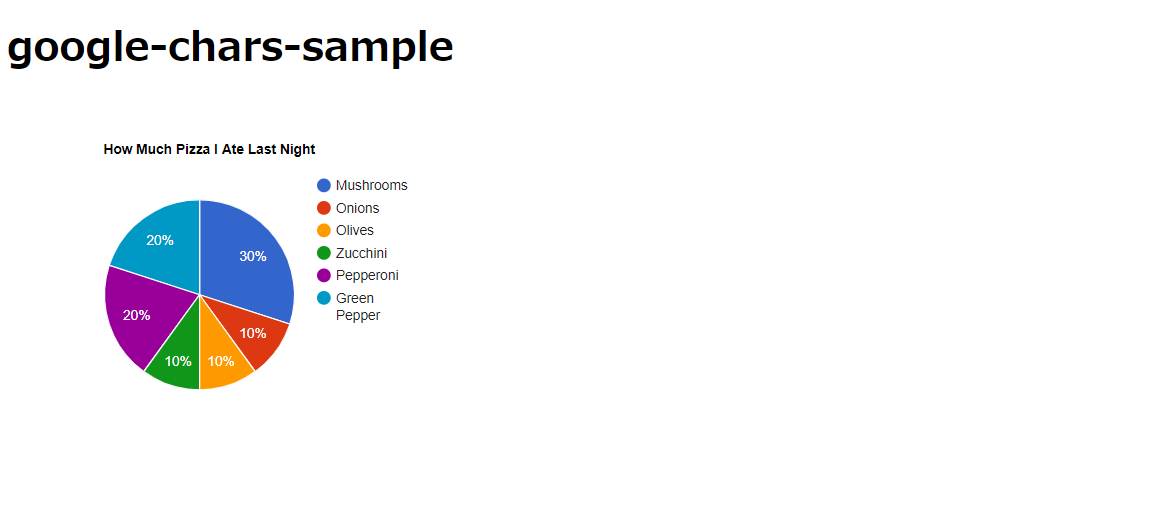
title = 'How Much Pizza I Ate Last Night';
type = 'PieChart';
data = [
['Mushrooms', 3],
['Onions', 1],
['Olives', 1],
['Zucchini', 1],
['Pepperoni', 2],
['Green Pepper', 2]
];
columnNames = ['Topping', 'Slices'];
options = {
'width': 400,
'height': 300
};
constructor() { }
}
以下のような画面表示になってれば成功です。
まとめ
angular-google-chartsのおかげで所要時間1時間もかからずグラフが作成できました。
サードパーティ製のライブラリなので製品用には向かないかもしれませんが、
個人開発用としては十分だと感じました。
最後までお読みいただきありがとうございました!
参考
angular-google-charts
Google Charts
@Statham JavaScriptのチャートライブラリのデモまとめ