参考にさせてもらいました↓(書籍「PythonとKerasによるディープラーニング」より)
https://github.com/fchollet/deep-learning-with-python-notebooks/blob/master/5.3-using-a-pretrained-convnet.ipynb
表示用のメソッド
compare_TV.py
def compare_TV(history):
import matplotlib.pyplot as plt
# Setting Parameters
acc = history.history['acc']
val_acc = history.history['val_acc']
loss = history.history['loss']
val_loss = history.history['val_loss']
epochs = range(len(acc))
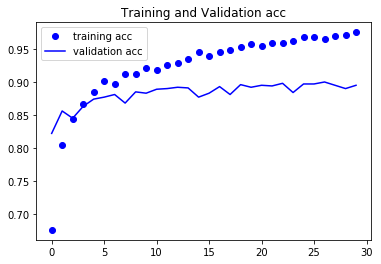
# 1) Accracy Plt
plt.plot(epochs, acc, 'bo' ,label = 'training acc')
plt.plot(epochs, val_acc, 'b' , label= 'validation acc')
plt.title('Training and Validation acc')
plt.legend()
plt.figure()
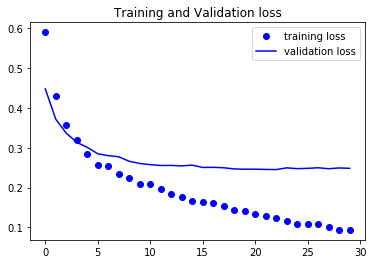
# 2) Loss Plt
plt.plot(epochs, loss, 'bo' ,label = 'training loss')
plt.plot(epochs, val_loss, 'b' , label= 'validation loss')
plt.title('Training and Validation loss')
plt.legend()
plt.show()
実行するとき。
from keras import models
from keras import layers
from keras import optimizers

model = models.Sequential()
#####################
# modelの詳細は省略  #
#####################
# declear History
history = model.fit(train_features, train_labels,
                    epochs=30,
                    batch_size=20,
                    validation_data=(validation_features, validation_labels)
                   )
# show Accuracy and Loss History
compare_TV(history)
結果はこのようになります。