通称 numpy100本ノック の 99 と 100だけ。
import numpy as np
import matplotlib.pyplot as plt
import seaborn as sns
99
Given an integer n and a 2D array X, select from X the rows which can be interpreted as draws from a multinomial distribution with n degrees, i.e., the rows which only contain integers and which sum to n. (★★★)
与えられる二次元配列Xは、なんらかのresource(候補群)があって、その中からrandom生成されるものとした
def multi_dist_n_pick(resource,size_2d,n):
    X = np.random.choice(X_resource,size_2d)

    # 抽出対象は行なので行数でループを回す
    for i in range(X.shape[0]):
        # 合計がnになる判定と配列を1で割ったあまりが全て0になることを利用した整数判定
        if (np.sum(X[i]) == n) and (np.sum(X[i]%1)==0):
            print(X[i])
np.random.seed(5020126)

# X に割り当てる候補の配列を作る
# 初項:0 末項:4 交差:0.5の等差数列を作る
X_resource = np.arange(start = 0, stop = 4.1, step = 0.5)

multi_dist_n_pick(resource=X_resource,
                  size_2d=(1000,3),
                  n=8)
100
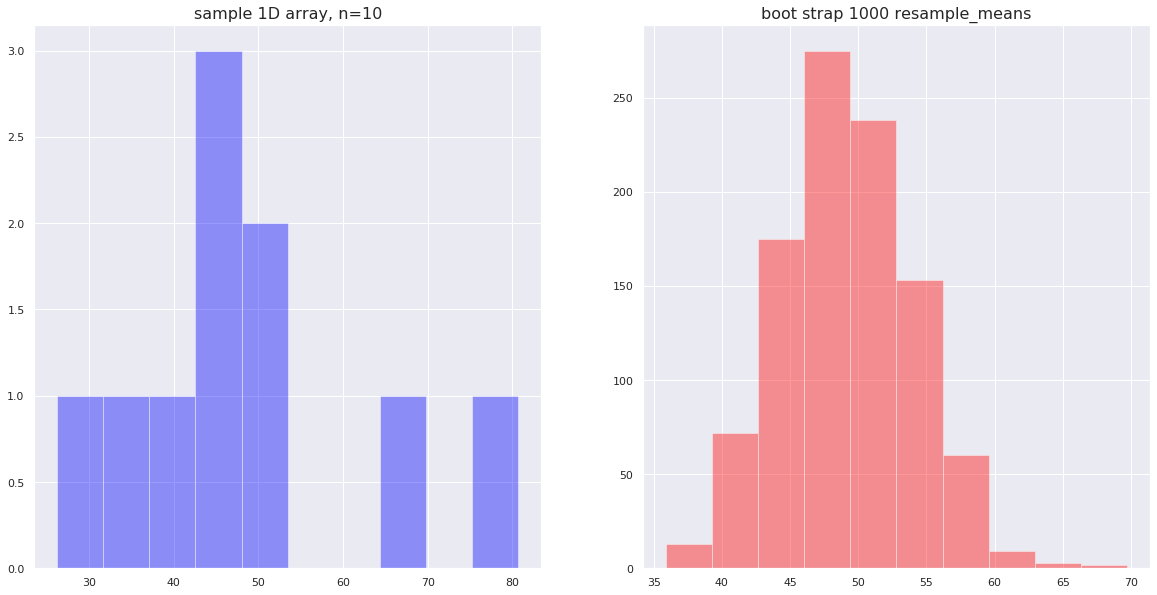
Compute bootstrapped 95% confidence intervals for the mean of a 1D array X (i.e., resample the elements of an array with replacement N times, compute the mean of each sample, and then compute percentiles over the means). (★★★)
# bootstrapped 95% confidence intervals for the means を返す
# 関数を作る
def bootstrap_for_mean_percentile(sample,resample_try):
    """
    bootstrap method

    sample : make 1D array
    resample_try : resample the elements of an array with replacement N times

    return:
    - N resample's mean
    - 95% confidence intervals
    """
    resample_means = [ ] # resampleごとの平均保存

    # resample_tryの数だけresampleを行う
    for i in range(resample_try):
        resample = np.random.choice(sample, len(sample), replace=True) # 復元抽出
        resample_mean = np.mean(resample) # 各resampleの平均
        resample_means.append(resample_mean) # 平均のパーセンタイルを計算する用に保存

    # resample_meansの平均
    mu_hat = np.mean(np.array(resample_means))
    # 平均のパーセンタイルを計算
    resample_conf = np.percentile(resample_means, [2.5, 97.5])

    # 描画しとく
    sns.set()
    fig = plt.figure(figsize=(20, 10))

    ax = fig.add_subplot(1, 2, 1)
    sns.distplot(sample, kde=False, bins=10, color='blue')
    plt.title(f"sample 1D array, n={len(sample)}", fontsize=16)

    ax = fig.add_subplot(1,2,2)
    sns.distplot(resample_means, kde=False, bins=10, color='red')
    plt.title(f"boot strap {resample_try} resample_means", fontsize=16)

    plt.show()

    return mu_hat,resample_conf[0],resample_conf[1]
import numpy as np

np.random.seed(5020126)
# 1Darrayを決める,なんでもいい。
X = np.random.normal(50,30,10)
# resample回数を決める
resample_try = 1000

# 関数で平均のpercentileの部分を受け取る
_ ,per025, per975 = bootstrap_for_mean_percentile(sample=X,
                                                  resample_try=resample_try)

print("95% confidence intervals")
print("2.5%:{}".format(per025))
print("97.5%:{}".format(per975))
95% confidence intervals
2.5%:40.214046546995746
97.5%:58.339760706475964
t検定で確認
import scipy.stats as stats
np.random.seed(5020126)

X = np.random.normal(50,30,10)
X_mean = np.mean(X)
X_var = np.var(X, ddof=1)

stats.t.interval(alpha=0.95,
                 loc=X_mean,
                 scale=np.sqrt(X_var/len(X)), # 標準誤差
                 df=len(X)-1)
(37.62043452526278, 60.19822262397027)
うる覚えだが、確か同じサンプルサイズならブートストラップの方が信頼区間は小さくなるはず。
