In this article, we will introduce Android Tracing tools to capture internal events from the TensorFlow Lite interpreter which can help us identify potential issues in performance of the models.
This article assumes you know how to use Android studio to build and run apps on mobile devices.
Discussion Topics
- What is System Tracing in Android?
- Different tools to capture Trace
- How to record TensorFlow Lite events
- How to use the System Trace data
System Tracing
The method of recording all activity happening in a device over a short period of time is called System Tracing. Developers can use System Trace to troubleshoot the run time performance of app. It combines the data from Kernel, Android Framework, CPU scheduler, disk activity and app threads.
Current Android tracing tools support for combining the TensorFlow Lite Internal events alongside Java/Kotlin code events. Some example events that can be captured by this tool are tensor allocation, operator invocation, graph modification by delegate.
Tools to capture Trace
Android platform provides different options to capture traces.
Android Studio CPU Profiler
This is one of the popular tools to investigate system performance. It is integrated directly into the Android Studio with a rich interactive UI which provides real time visual information about the CPU usage and thread activity.
System Tracing App
This is a system level app that is present in devices running Android 9 (API level 28) or later. This records all events happening in the device using the systrace command-line utility without needing to connect over ADB. The trace file is saved over device and can be shared across teams.
Systrace command-line tool
This is a legacy tool to record a system trace over a short period of time and then compress it into a text file.
Perfetto command-line tool
Perfetto is an open-source tracing project which provides platform-wide tracing tools for Android, Linux, and Chrome. It is a more sophisticated tool and was introduced in Android 10.
CPU profiler and Perfetto provide a rich user-friendly UI to visualize the trace data, which can help in identifying the performance issues and the cause very easily. All options mentioned above create a report file in either Perfetto format (Android 10 — API 29 or later) or Systrace format (earlier version of Android).
How to record TensorFlow Lite events
Before using any of the tools mentioned above we need to enable TensorFlow Lite tracing. The android system property debug.tflite.trace needs to be set to 1 before starting the android app. Use the following command to enable it.
adb shell setprop debug.tflite.trace 1
After we have recorded all trace events, we can disable it using following command.
adb shell setprop debug.tflite.trace 0
Note: This is an experimental feature and only supported when the Android app is built with the nightly released Tensorflow Lite library. (does not support stable binaries up to v2.3)
Using Android Studio CPU Profiler to record trace
Here we are profiling the Image Classification example app from the TensorFlow project to record trace and inspect. This example consists of two models EfficientNet and MobileNet. We will be profiling the MobileNet model.
Following are the specifications of the device used:
Device : Realme 6
OS : Android 10
Chipset : Mediatek MT6785 Helio G90T (12 nm)
CPU : Octa-core (2x2.05 GHz Cortex-A76 & 6x2.0 GHz Cortex-A55)
GPU : Mali-G76 MC4
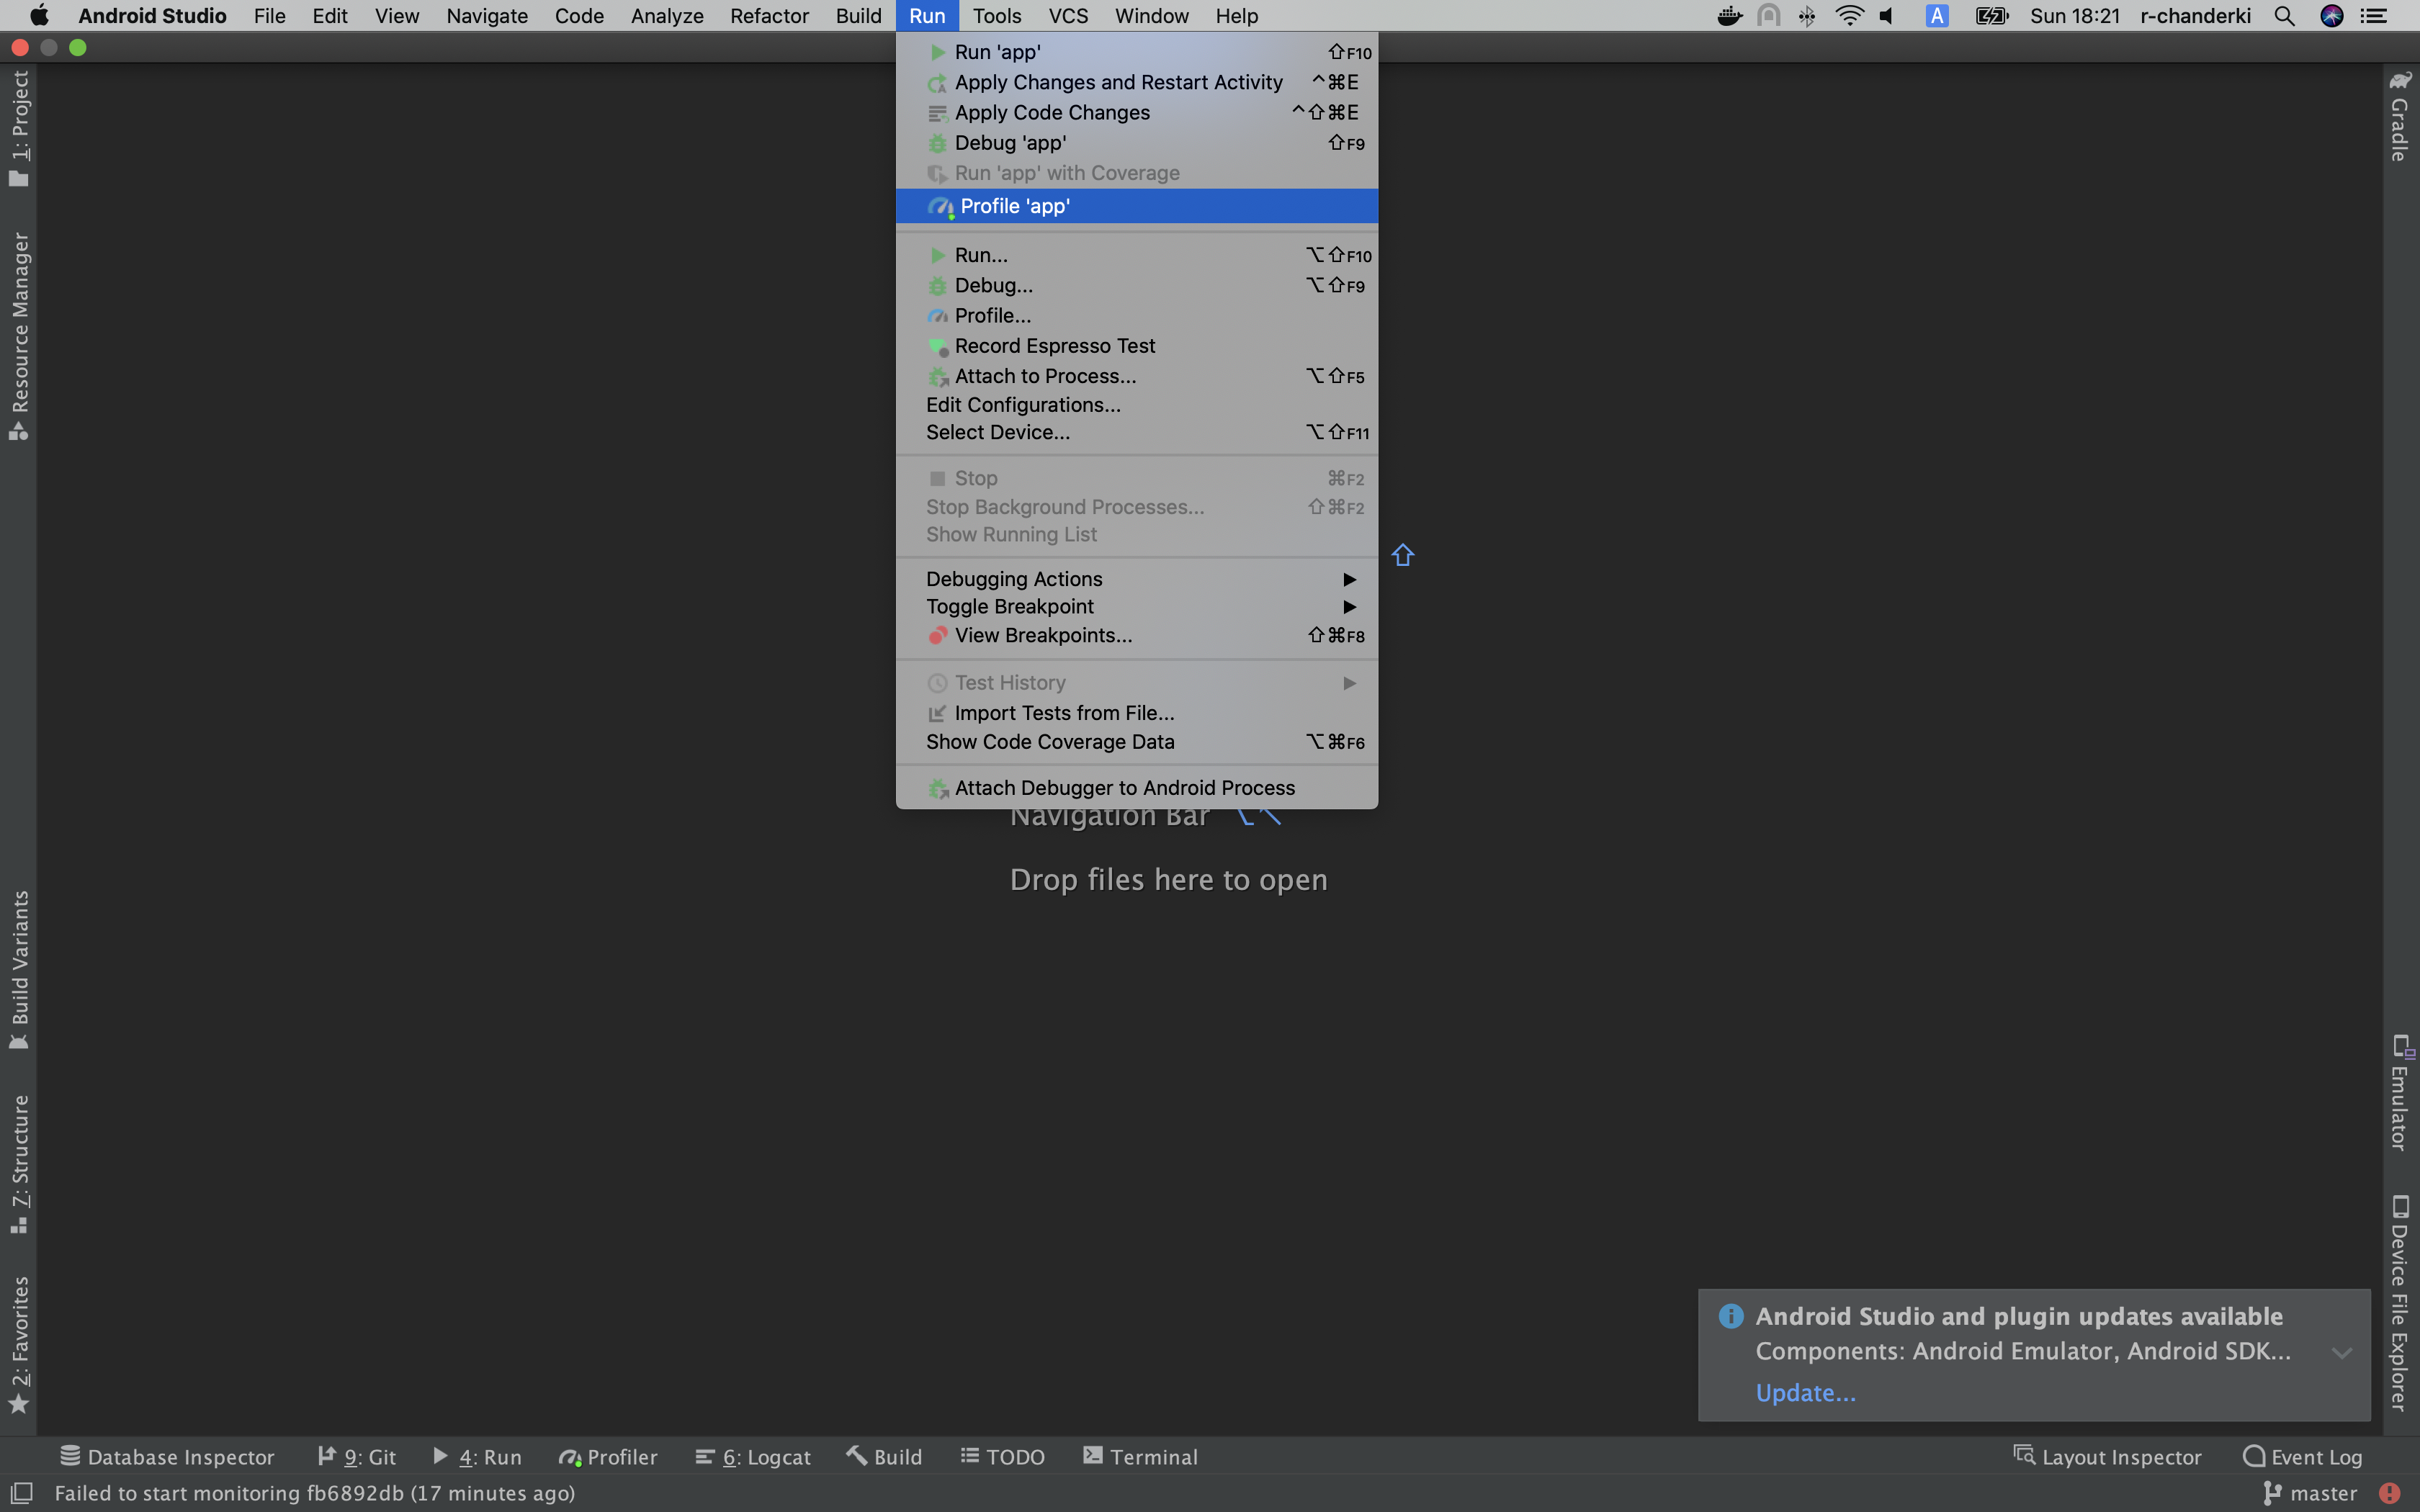
Follow the steps below to start profiler and record trace in Android studio
-
Select Run and then
Profile 'app'from the top menu.
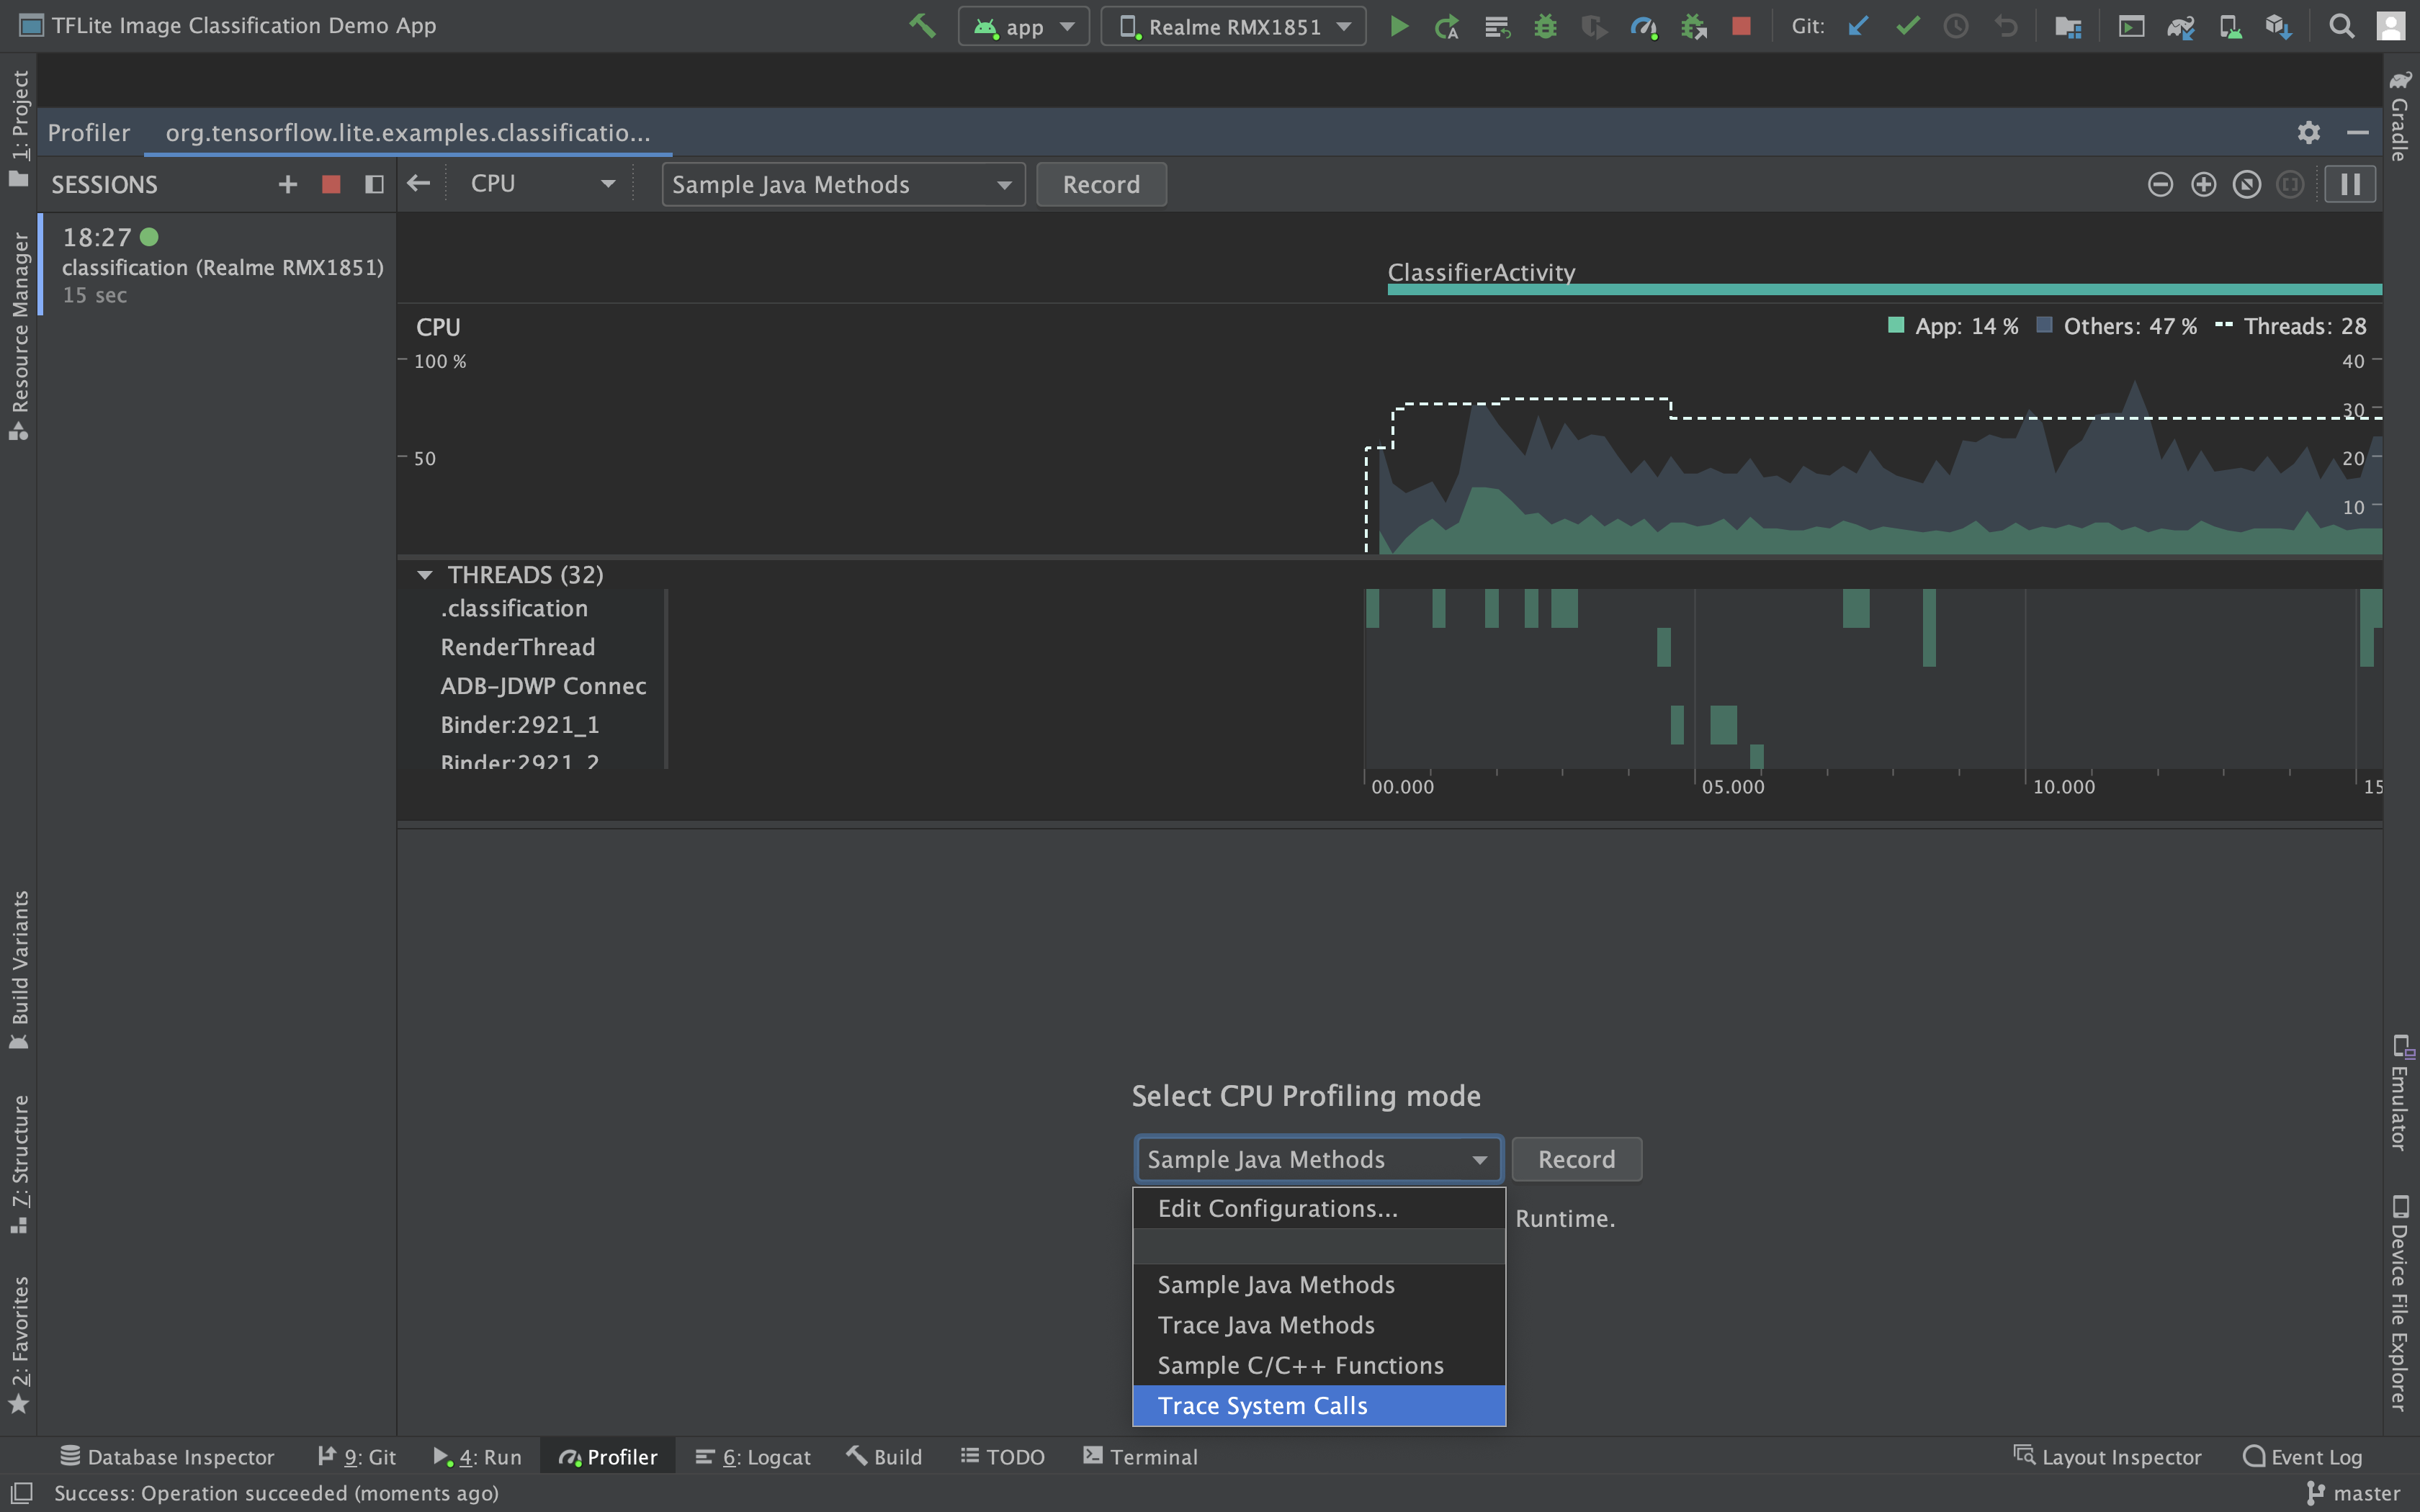
-
In the profiler window click anywhere in the CPU timeline.
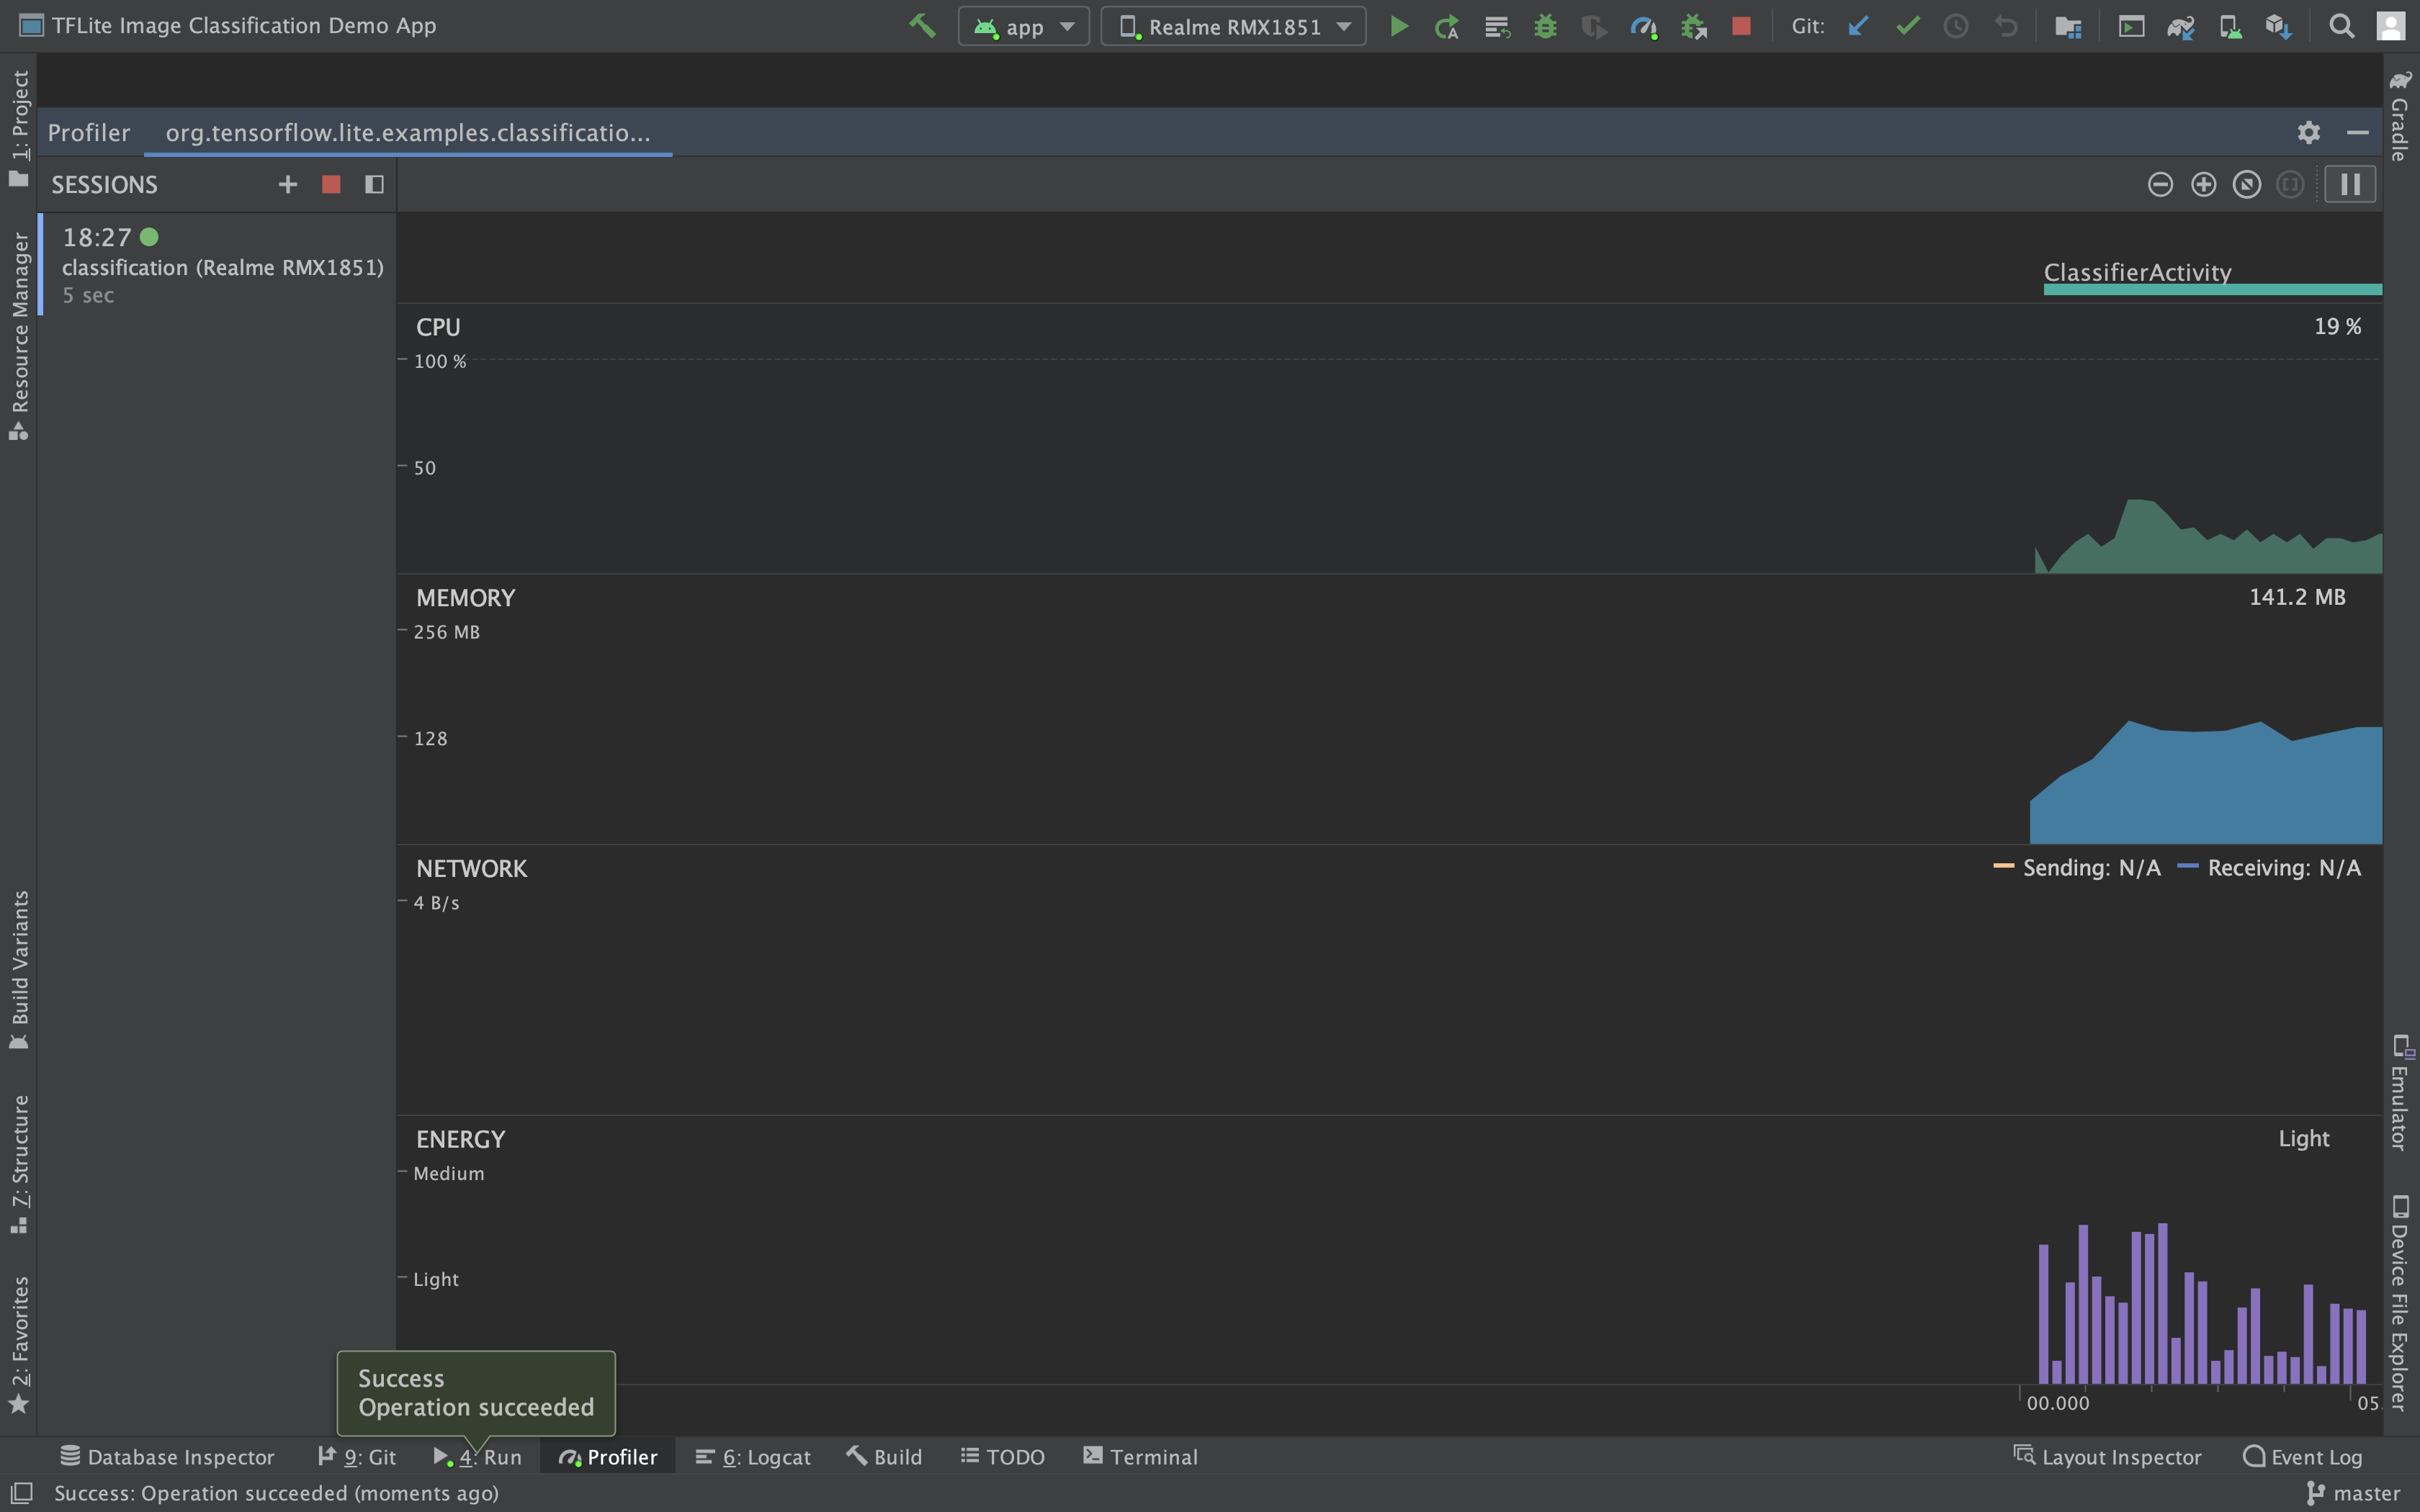
-
Select
Trace System Callsamong CPU Profiling modes.
-
Click Record and run the app for few seconds to do inference and then select stop
-
The Android CPU profiler parses the system trace and visualizes the trace data
In Android Studio, select the inference thread to understand the events happening. We can see the order of invocation of operators and their respective execution times.
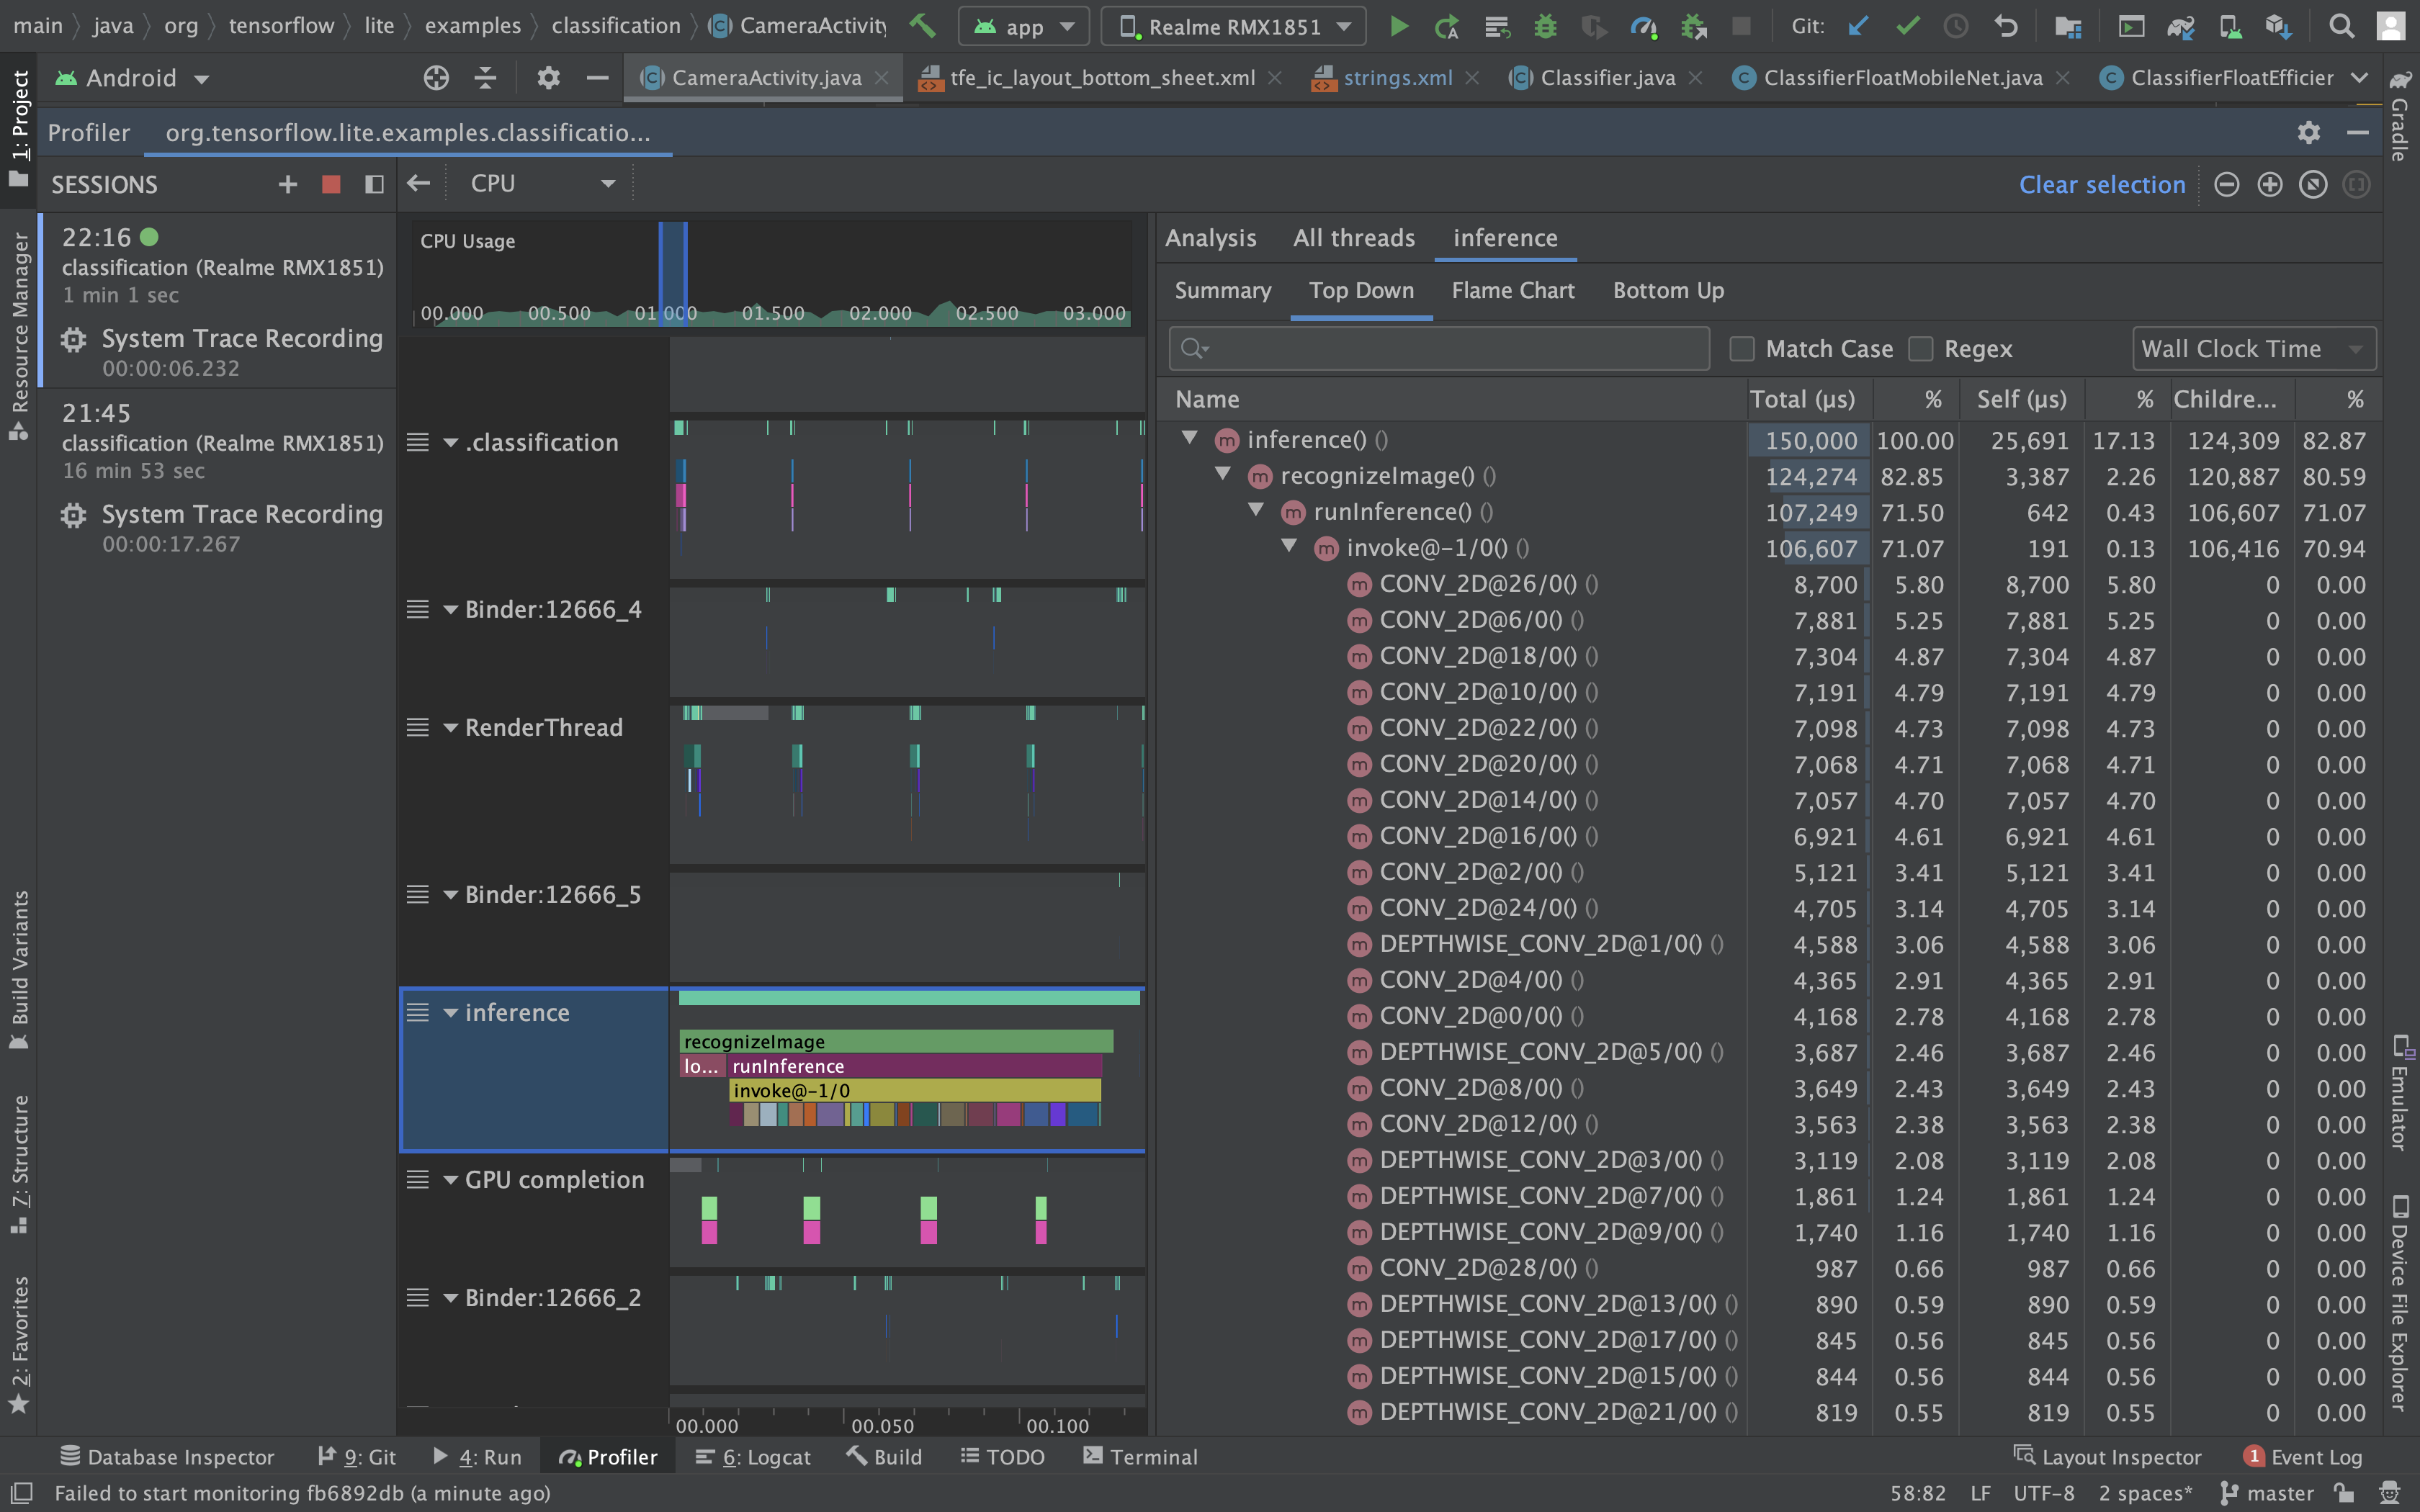
The CPU profiler is improved over various updates of android studio and has very interesting features. The top timeline shows the usage of app over the recorded time. We can select any of the time ranges to inspect CPU and thread information using the box selector. We can zoom in and zoom out the timeline using the option on the right corner of the window.
We can also insert custom trace events using the trace api to identify sections so that it is easy to distinguish. In the example app two trace events recognizeImage and runInference are added to identify the inference section. Following is how you can add them.
  ...
  Trace.beginSection("runInference");
  tflite.run(...);
  Trace.endSection();
  ...
Following is the profile data of MobileNet on GPU.
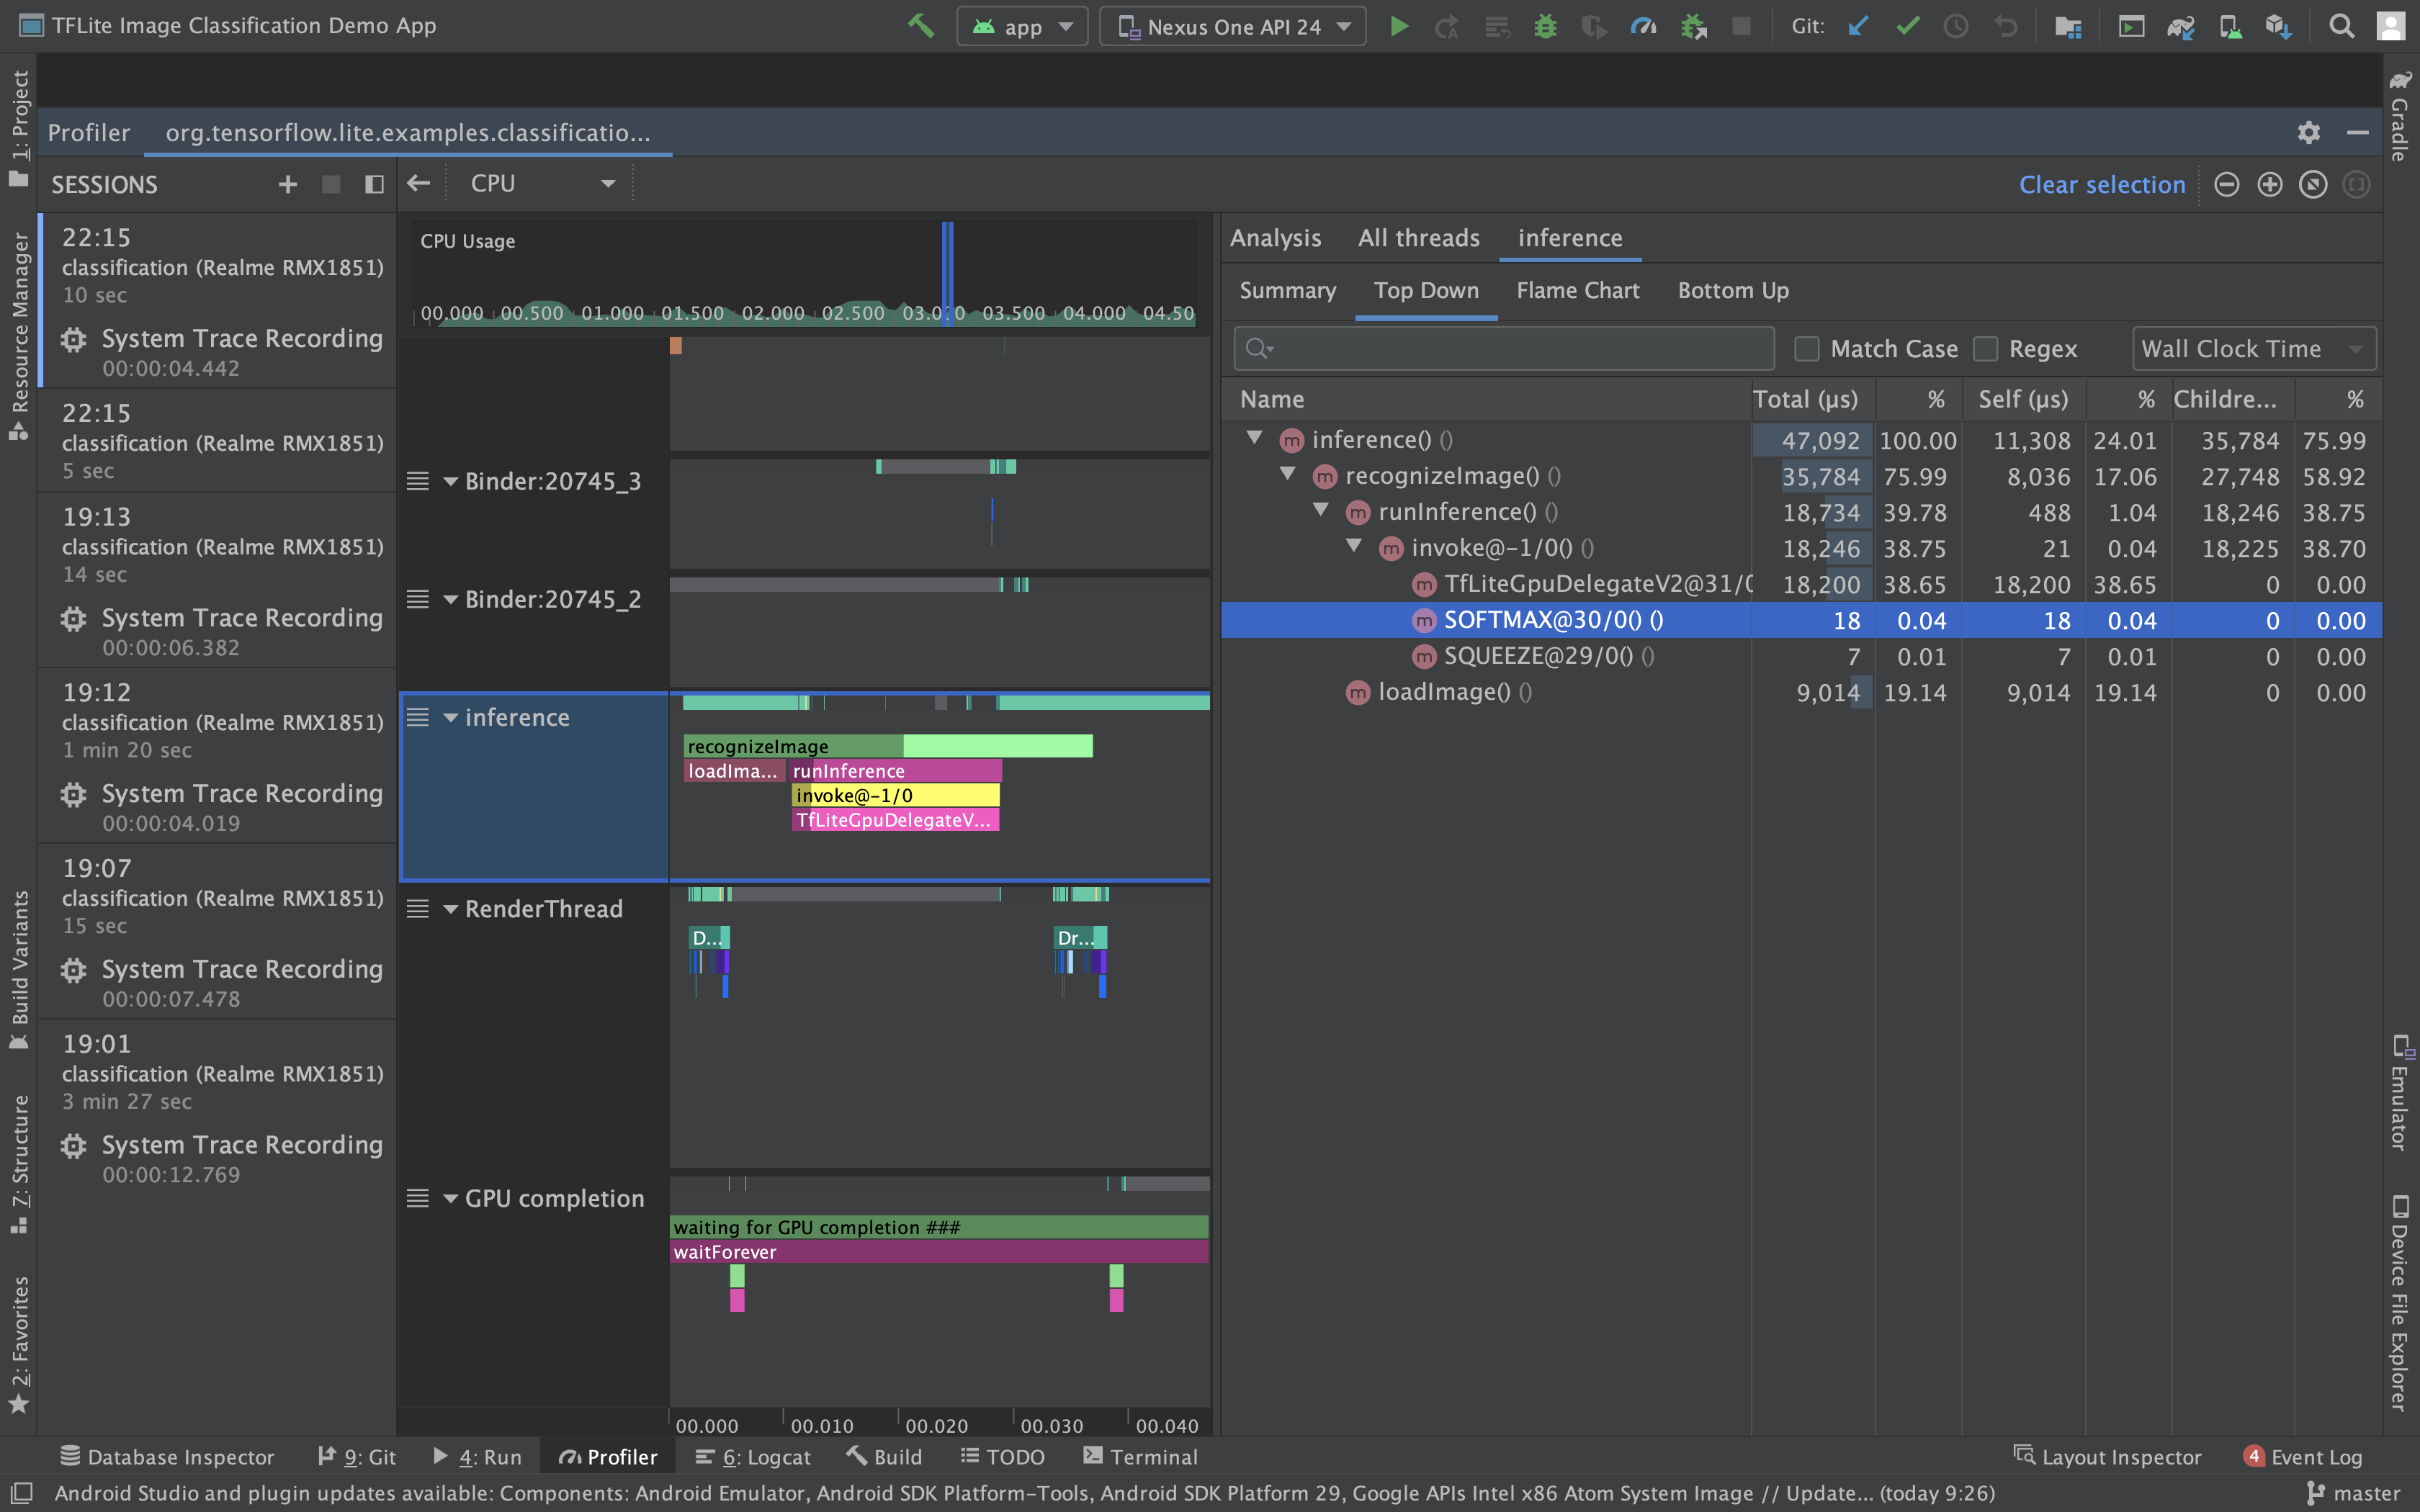
In the runInference section we can see TfLiteGpuDelegate which represents graph modification for GPU delegate. For GPU we cannot see individual operator performance but if any of the operators of model graphs are not delegated to GPU, they will be dispatched to CPU and the profiler will show run time information of such operators.
We can see that operators SOFTMAX and SQUEEZE are not supported by GPU and hence are scheduled to CPU. To improve upon inference time for such models, we can replace such operators with those supported on GPU.
If you are interested, you can check here for the list of operators supported on GPU.
Lets check the profiling information of MobileNet with XNNPack delegate.
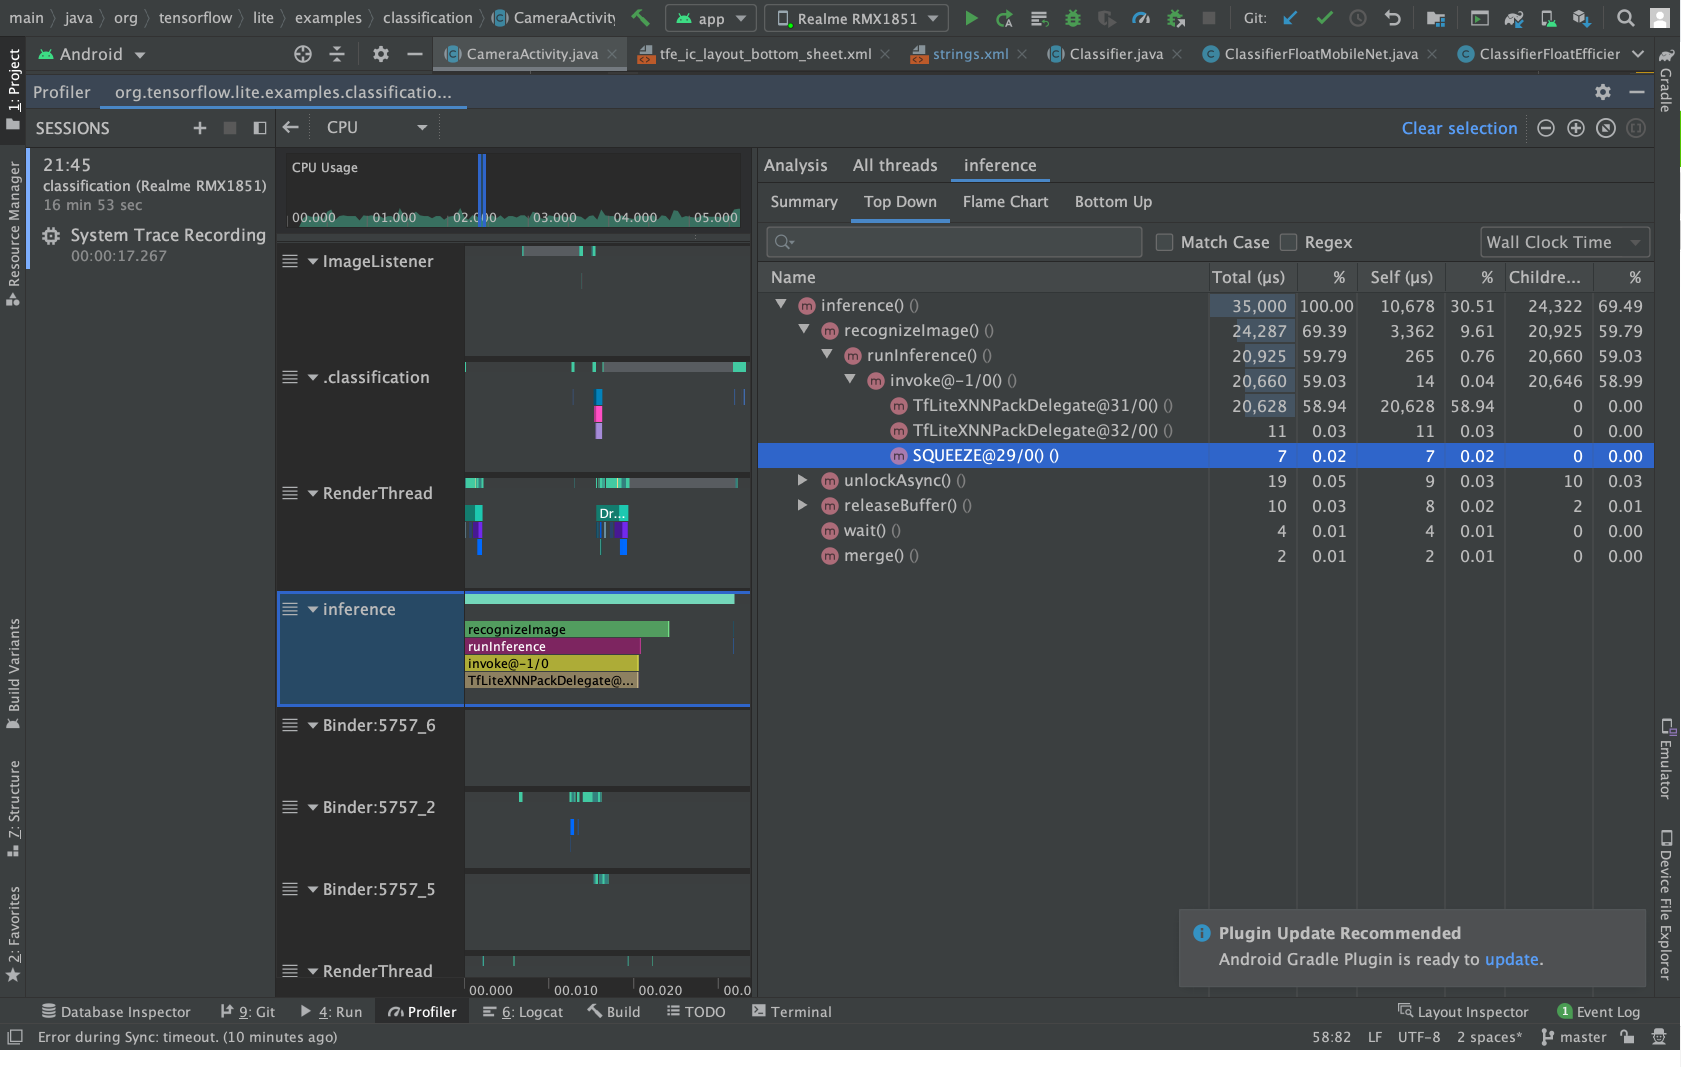
Here we can see that the operator SQUEEZE is not supported by XNNPack delegate.
Interesting point to note is that XNNPack is optimized library for tensorflow operators to run on ARM CPUs i.e., all operators are run on CPU and yet the Android Profiler does not show information for these ops.
Sometimes we use multiple inference threads which need to be scheduled with other CPU intensive tasks such as UI rendering and buffer management. Here the performance of inference is limited to the number of cores available. If the number of threads for inference is larger than available cores, then it will affect the performance. In such cases we either have to limit the number of threads or reschedule our CPU intensive tasks.
Summary
We have introduced how to investigate performance of TfLite models on Android devices using the Trace Api. There are various tools to record system traces. Perfetto and Android CPU profiler are two popular tools with a user friendly interface. We have explained how to use Android CPU profilers to record various types of information.
Profiling information such as operator invocation, graph modification by delegate can be analyzed using these tools which can help in identifying potential issues and finding solutions to improve the performance of models.